Whereas Vermont and regional deglacial history is discussed in detail in subsections below, an advance preview of Vermont’s deglacial history, including a basic explanation of the issue related to the Addendum, will be helpful. The following is a screen shot of a deglacial history map based on the January 2026 pre-Addendum version VCGI findings. This map is basically the same as reported in the Addendum except for T7 and T8 times which have been revised in the Addendum.
This map shows the receding positions of the ice margins and the associated ice sheet coverage for various times as deglaciation proceeded. This map does not show the full deglacial history. For example, it does not show the footprints of various proglacial water bodies. Nor does it include correlations with neighboring regions in New York, Quebec, and New Hampshire, as discussed elsewhere below. But it gives a general overview sense of the larger scale perspective of the deglacial history.
The only change made by the subsequent September 2026 Addendum is that:
- T7 time is subdivided into multiple times associated with destabilization of the Champlain lobe, including calving , streaming, and possible “collapse (?).”
- The Champlain lobe in T8 time was restricted to the Missisquoi Basin.
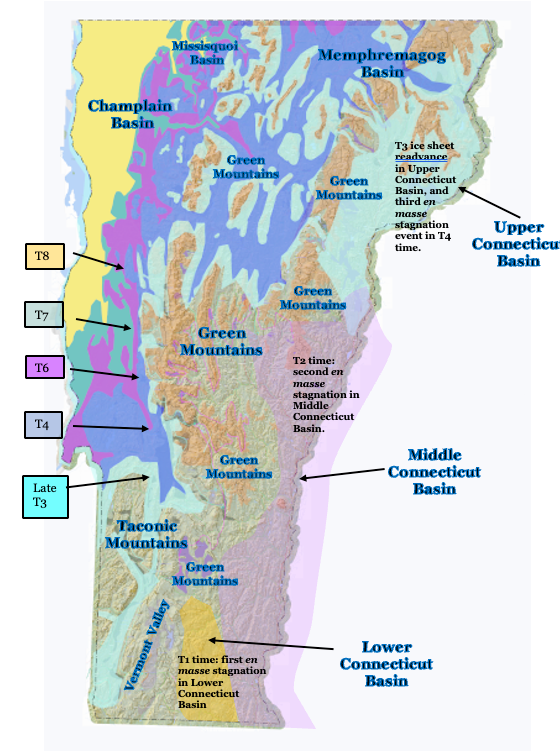
Again, this map represents findings as of January 2026, most of which remain valid and have not been changed by the Addendum study. The Addendum basically found that the Champlain lobe in T7 time extended southward as shown on the map, but became substantially destabilized, resulting in rapid recession by ice streaming and calving, and perhaps a collapse(?). The Addendum further showed that the T8 Champlain lobe, which again represents a readvance in Champlain Sea time, was restricted to the Missisquoi Basin.
The following comments pertain to the deglacial history depicted on the above map, and explain the issue of the long Champlain lobe at a late glacial time, related to the Addendum study and its revision of previous findings:
- The earliest ice margin depicted on the above map represents Late T3 time, which is not the earliest deglacial history available from VCGI mapping. Late T3 time represents the beginning of the Lobate Phase.
- Earlier and higher deglacial history in T1, T2, and earlier T3 times is marked by Ice Marginal Channels and other features in the Nunatak Phase, but these are not correlated and thus margins in these times are not delineated. The ice sheet in T1 and T2 times extended across all of Vermont, with only mountain peaks emerging as nunataks, which progressively enlarged with time. The above map gives a sense of the pattern of nunataks by the ochre-colored areas in the Green Mountains, some of which are cartographically masked or are too small to be readily evident.
- Owing to the physiographic constriction and high elevation of its headlands, the primary Laurentide ice supply to the Connecticut Basin was from the Memphremagog and Champlain Basins. In T1 and T2 times the Champlain lobe surface lowered, such that ice supply across low cols along divides from the parent Champlain Basin to the Connecticut Basin progressively ended, resulting in two en masse stagnation events , as marked by Scabby Terrain, first in the Lower Connecticut Basin in T1 time, followed by a second en masse stagnation in the Middle Connecticut Basin in T2 time. Some but not all Scabby Terrain for these events and times, as marked by the violet-colored tracts, is evident on the above map.
- The Late T3 margin is correlated with the upper, older portion of the White Mountain Moraine System (WMMS) in New Hampshire, and perhaps the Frontier moraine in Quebec. This is significant in that the WMMS is reported by Thompson et al as representing a readvance. The Late T3 readvance margin is shown here as extending southward in the Upper Connecticut Basin to the Bradford vicinity where the ice margin is marked by features with drainage linked to Lake Hitchcock (not shown).
- Ice sheet lowering and margin recession then led to the T4 ice margin as identified above. T4 time is marked by a significant and well-marked “Signature” margin in Vermont. For example, in the Memphremagog Basin ice margin features at the T4 level are extensive along basin divides between the Connecticut and Lamoille Basins. The T4 margin is correlated with the lower, younger portion of the WMMS and with the Dixville moraine in Quebec. Owing to the loss of its supply, mostly from the Memphremagog Basin, the Late T3 ice mass in the Upper Connecticut Basin stagnated en masse in T4 time, representing the third en masse stagnation event in the Connecticut Basin. Also, in the Vermont Valley, the T4 margin is marked by a major ice margin feature at Rutland near the mouth of the Vermont Valley. The Late T3 margin in the Vermont Valley is marked by another, older feature further south in the Bennington vicinity. As discussed below, the Late T3 and T4 margins are correlated with ice margins reported by DeSimone and LaFleur in east-central New York.
- The T5 margin is not delineated on the above map owing to scale limitations, but was intermediate between the T4 and T6 margins.
- T4 to T6 times are marked by a step-down pattern of receding ice margin features, including local proglacial lakes which progressively expanded and coalesced leading to Lake Winooski (and its successor Lake Mansfield) in the Winooski and Lamoille Basins in T4 to T6 time, and to Coveville Lake Vermont in the main Champlain Basin in late T6 time. Again, owing to scale limitations, and for the sake of simplicity, these water bodies are not shown on the above map. As discussed below, an early phase of calving is suggested in the pre-Addendum study, in a large open water area in the lower, western “Deep Lake” portion of the Champlain Basin floor in T6 and Coveville time. However, this early calving is disproven in the September 2026 Addendum. The T6 ice margin is correlated with the Sutton moraine in Quebec.
- As discussed in the pre-Addendum report, Late T6 and early T7 time was associated with the lowering of Lake Vermont from the Coveville to the Fort Ann level, which again is not shown on the above map. The evidence indicates that the Coveville to Fort Ann lowering massively destabilized the Champlain lobe, transforming its eastern margin from a lateral toward a frontal margin, and triggering calving in a long, narrow “Disaggregated,” more or less open water Fort Ann “corridor in multiple “re-entrant basins” in the Middlebury Bench, a raised portion of the Champlain Basin floor. This corridor along the lobe eastern margin progressively widened in T7 and Fort Ann time by calving in the re-entrant basins. And the head of the corridor along the Champlain lobe eastern margin progressively extended northward, likewise in T7 and Fort Ann time, to and beyond the Quebec border, leading to the sudden and substantial lowering of Fort Ann to the Champlain Sea level at the end of T7 time.
- Again, per the pre-Addendum interpretation, the lowering to the Champlain Sea while the T7 lobe still stood as a long convex ice mass, is suggested as triggering a readvance in T8 time, marked by evidence reported by Cannon and Wagner in the Missisquoi Basin, correlated with evidence reported by Wright in the Charlotte area and by Connally in the West Bridport area. As shown on the above map, the Champlain lobe thus was found to extend southward as a long convex ice mass in T7 and T8 time, receding rapidly northward by calving, leading to its exit from Vermont.
- The Addendum study focused on this long convex lobe in T7 and T8 times, thanks to LiDAR imagery leading to the identification of evidence for Glacial Dynamics which resulted in the rapid and complete recession of the T7 lobe from Vermont, with the subsequent T8 readvance in Champlain Sea time restricted to the Missisquoi Basin. Thus, “Glacial Dynamics,” which were identified in the pre-Addendum study in conjunction with early times, such as the formation of Ice Marginal Channels and Scabby Trrain, as well became an important part of the deglacial history story in the Addendum study, bearing significantly on modern day global warming concerns.
- These Glacial Dynamics included:
- The destabilization of the entire Champlain lobe by the lowering of Lake Vermont from the Coveville to the Fort Ann levels, as marked by LiDAR detectable features termed “Streaks.”
- The transformation of the eastern margin of the Champlain lobe from a lateral type of margin toward a frontal type of margin, as marked by Ribbed Lacustrine, Headless Delta, and Thickened Bouldery Lacustrine deposits and other features, beginning in the Middlebury Bench and then progressing northward.
- The warming of the Champlain lobe, becoming fully Warm in T7 time.
- The presence of substantial meltwater along the lobe margin and at its base, including in confined tunnel-like channels (both with and without confined hydrostatic head), and as well dispersed as a film at its base.
- The nature of the Champlain lobe geologic substrate when the Champlain lobe became restricted to the lower Trough portion of the Champlain Basin floor, with easily erodible, soft shale substrate.
- The Glacial Dynamic in T7 time involved the elements as just described and was progressive, including:
- First, the loss of buttressing support associated with the sudden and substantial lowering of Lake Vermont from the Coveville to the Fort Ann levels in late T6 and early T7 time,
- leading to calving and widening of the Disaggregated corridor in the Middlebury Bench re-entrant basins in early T7 time,
- followed by the physiologic loss of buttressing support in later T7 time, associated with the clearing of the Middlebury Bench and restriction of the Champlain lobe to the Trough, resulting in a first phase of ice streaming as marked by LiDAR features, including “Scarps” and Mega-Scale Lineations, with a physiology controlled Onset Zone at the northwestern corner of the Middlebury Bench, and calving as documented by first bouldery lacustrine and then marine sediment, and as well by a Transverse Morainic Ridge at the grounding line.
- In turn, followed by a second, accelerated phase of ice streaming in still later T7 time, possibly representing the “collapse(?) of the Champlain lobe, triggered by the clearing of the Onset Zone as a kind of “dam break” and as well by the lowering of Fort Ann level to the Champlain Sea, which likewise was sudden and substantial.
The Champlain lobe finally receded from and exited Vermont in T7 and Champlain Sea time, followed by a readvance restricted to the Missisquoi Basin in T8 time.