The finding of Streaks and their association with late T6 and T7 ice margins and elevations is a both surprising and remarkable, providing an important part of the story of the recession and demise of the Champlain lobe. Many Streaks have been identified in the Champlain Basin. Whereas these features are quite subtle and this study has only scratched the surface (pun intended), with many more such features likely yet to be identified, nevertheless the recurrent pattern of their association with the late T6 and T7 elevation (adjusted for rebound) is remarkable. Streaks mark the eastern lobe margin and as well the margins of nunataks within the lobe, with the Champlain lobe at these times standing as a long convex ice mass, as marked by the blue line on the above map in close association with the Fort Ann strandline. Streaks occur in clusters across a range of elevations at late T6 and T7 levels and margins, and thus represent progressive recession at these times.
Streaks are interpreted as representing destabilization of the Late T6 and T7 ice margin triggered by a) the lowering of Lake Vermont from Coveville to Fort Ann levels, b) the progressive transformation of the Champlain Lobe from a Cold-based to fully Warm thermal condition, and c) the increasing presence of meltwater both along ice margins and beneath the ice. This destabilization triggered calving in the re-entrant basins of the Middlebury Bench, as marked by Headless Deltas, Ribbed Lacustrine Deposits, and Thickened Bouldery Lacustrine deposits in Middlebury Bench re-entrant basins. This calving then continued in T7 time with the ice margin receding in a downgradient direction in each of these re-entrant basins. Detsabiliazation was also associated with the transformation of the eastern lobe margin from a lateral toward a frontal margin.
The Fort Ann strandline in Vermont corresponding with the blue line on the above map, which also marks the ice margin at late T6 and early T7 time, is taken from Chapman’s depiction and my own previous findings (Wagner, 1972). Whereas Chapman believed that the Fort Ann strandline was limited and excluded from the northern Champlain Basin by the ice sheet prior to the opening of the basin for the Champlain Sea, my mapping identifies Fort Ann features further northward, extending to the Quebec border. And as is well known, research in Quebec has likewise identified the Fort Ann strandline, referred to as Lake Candona. The Fort Ann strandline in New York is taken from Franzi et al 1 In a presentation entitled “Bridging the gap: glacial geomorphic mapping in the Adirondack Upland, New York.” referred to as Lake Akawasasne. As discussed below, Franzi’s et al likewise present information suggesting a close relationship between the Akawasasne strandline and the ice margin.
t is emphasized that just as Franzi has recognized that the Fort Ann strandline was diachronic, so too was the corresponding ice margin associated with this strandline. Thus, recession of the ice margin occurred in late T6 and T7 time and Fort Ann time and continuing in T7 time such that the ages of individual features vary with time, showing the progressive recession of the ice margin. All the Streaks identified in this Addendum study are at elevations which correspond with the late T6 and early T7 margin and Fort Ann strandline, again marking the lowering of Lake Vermont from the Coveville to the Fort Ann level. Fort Ann features as depicted on Chapman and Wagner profiles extend over a broad range of elevations. This likely reflects erosional lowering of the Fort Ann outlet. Similarly, the occurrence of Streaks over a range of elevations may reflect this lowering but as well the progressive nature of the ice margin adjustment.
The following is a discussion of selected Streak examples, beginning in the northern portion of the basin and progressing southward. Interestingly, the nature of Streaks appears to vary in the Basin, with more southerly Streaks along the eastern lobe margin along the foothills showing evidence of more substantial meltwater, in contrast to Streaks further north and along nunataks which do not show such evidence. In fact, in the southernmost portion of the Champlain basin, again along the foothills, the late T6/early T7 margin is marked mostly by stagnant ice deposits and kame deltas as part of the step-down sequence, without the presence of Streaks. This observation is taken as part of the evidence of progressive recession and the southward accumulation of meltwater as part of the Glacial Dynamic.
a. Streak Examples in Missisquoi Basin
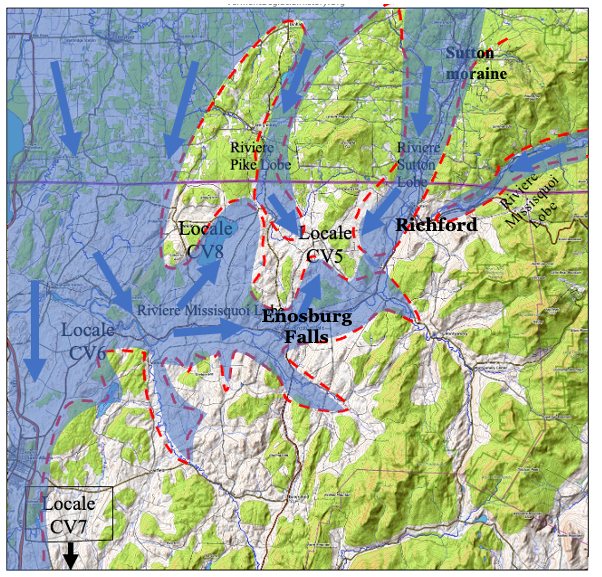
As discussed in my pre-Addendum report, including various Locales referred to in Appendix B, at a late glacial time the Missisquoi Basin was occupied by a discrete Champlain Basin sub-lobe, with multiple sub-sub-lobes associated with the micro-physiography. The Missisquoi sub-lobe was nourished by ice flow from the Laurentide ice sheet via multiple pathways extending into Vermont, again as depicted and discussed in my pre-Addendum report. The following map, taken from the Appendix B discussion of this Basin, shows the late T6 and early T7 ice margin and ice sheet cover in the Missisquoi Basin.
I
This map is intentionally schematic and imprecise. But it gives a sense of the complexity of the ice sheet pattern and ice supply flowlines. The blue-shaded pattern of ice margins was drawn using the Bath Tub Model to correlate ice margin features (mostly stagnant ice deposits, including kame deltas) with isostatically adjusted elevation as a guide. By this late time the ice sheet in this basin was relatively thin and showed a remarkable sensitivity to physiography. In general, the ice sheet extended up the Missisquoi Basin, including multiple feeders, with a main lobe tip near Richford, and as well smaller sub-lobes extending into headwater areas of tributary basins.
Streaks along the late T6 and T7 margin have been identified at four locations in the Missisquoi Basin, per the following map:
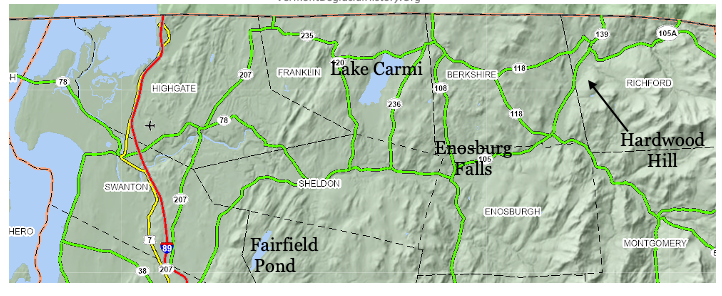
These locations were selected as more obvious features on LiDAR, but it is likely that further study will identify additional evidence of this ice margin
VCGI mapping for the Hardwood Hill location is described in Appendix B at Locale CV1. The map below, which identifies ice margin positions in T4 – T7 time, is reproduced from this Locale:
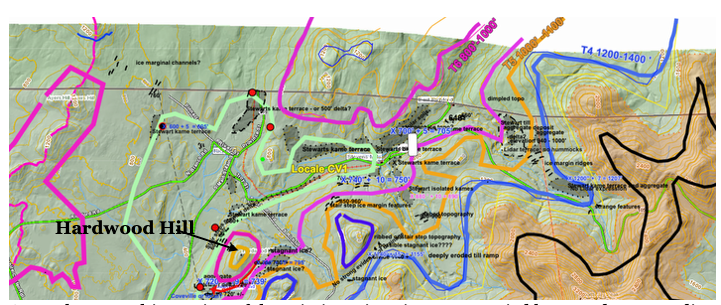
As can be seen, this portion of the Missisquoi Basin was occupied by step-down receding ice lobe margins in T4-T7 times. The Streaks at Hardwood Hill were recognized in my pre-Addendum report, but identified as “Steps,” marking the T6-T7 levels and times. The map below on the left is an unmarked close-up of the Lidar imagery of the northwest flank of Hardwood Hill, illustrating the LiDAR appearance of these features, and on the right is a markup tracing the T6-T7 linears:
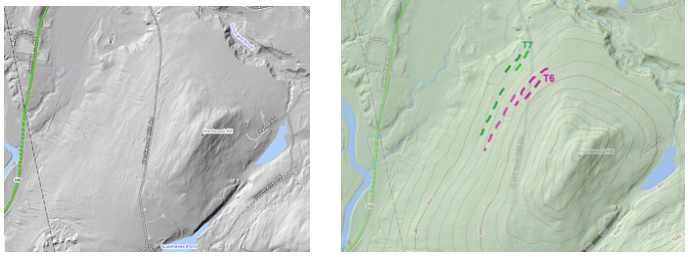
The following is an unmarked larger close-up of these features: