As noted above, physiography is an essential, foundational element for examining the deglacial history of Vermont using the “Bath Tub Model.” Thus, understanding Vermont and regional physiology is likewise essential. Whereas postglacial isostatic crustal rebound has altered present day physiographic elevations from those that existed during late glacial times, which is necessary to consider for purposes of mapping and correlating ice margins, present-day physiographic maps give a general sense of the physiography as it existed in late glacial times.
In general, ice margin features associated with specific times as were mapped in this study tend to wrap around, and closely conform to the physiography at different elevations. As indicated in the preceding, the evidence indicates that earlier ice margins associated with thicker ice may have been less sensitive to the physiography of the underlying terrain than younger ice margins with thinner ice. But, as stated above, even the earliest margins, such as T1 and T2,which are associated with “Disconnections,” show a relationship with physiography on a more major scale. Later margins, such as the T7 and T8, show remarkable sensitivity to very small topographic irregularities.
It turns out that understanding the terrain, getting a visual sense of it while mapping, especially when close up, as on VCGI maps, understanding how it varies within, across, and between basins, large and small, can be challenging. Therefore, examining physiography here is helpful as an introductory overview perspective. Numerous maps illustrating Vermont and regional physiography are reported online. While these may seem redundant, in general they provide information about subtle differences which can be important.
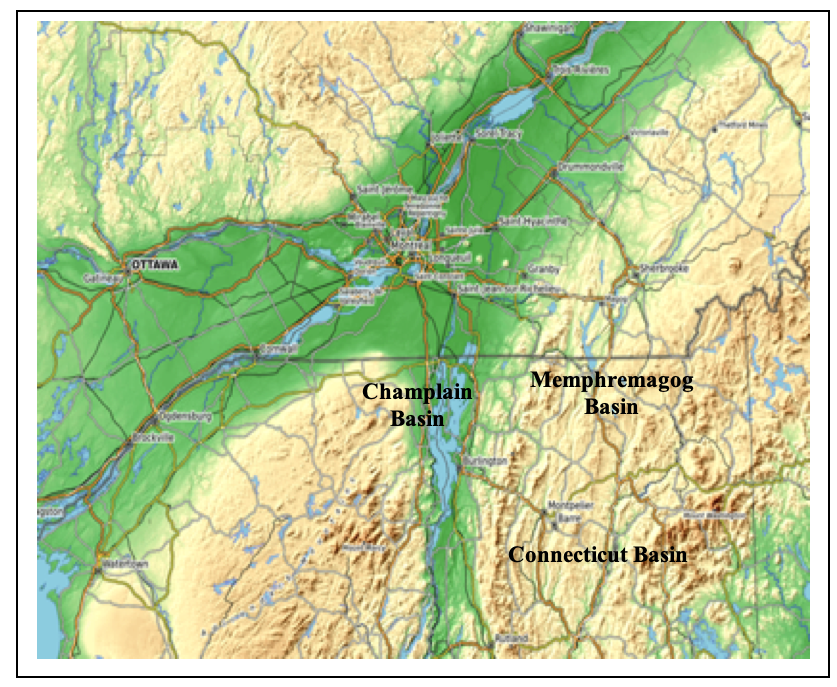
The following four maps from online sites give regional perspective. 1 https://en-ca.topographic-map.com/map-z4c3q/Quebec/?center=44.99106%2C-72.41132&zoom=15&overlay=0&base=2&popup=44.99257%2C-72.4072 , 2https:www.freeworldmaps.net/united-states/northeast/physical.html , 3 https://www.mapresources.com/products/vermont-digital-vector-contour-map-vt-usa-212176. The large size, low elevation floor, and open mouth to the north of the Champlain Basin favored a robust Champlain lobe, in contrast to the smaller, higher Memphremagog Basin. In contrast, uplands in the northern Connecticut Basin served to limit the southward flow of ice supply from the parent Laurentide ice sheet to the north. At relatively early times, the ice supply to the Connecticut ice mass came predominantly from the Champlain and Memphremagog Basins, ultimately leading to the demise of the ice mass in this basin when its supply became “Disconnected” by thinning ice across physiographic divides, as discussed below.
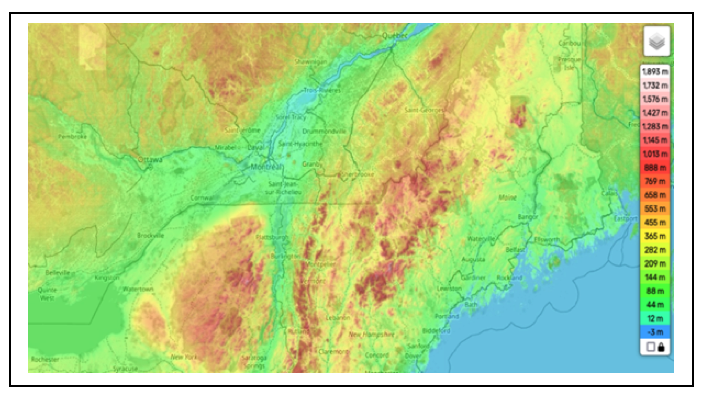
One of the most helpful physiographic maps is provided online: https://rcweb.dartmouth.edu/Geospace/lidar/newengland/ This map was generated by physiographic shading of LiDAR imagery and can be viewed at varying scales from ultra-regional to ultra-local. The map has the added benefit of enabling the determination of the elevation of the terrain at any point by usage of a computer mouse. For example, the graphic below depicts regional physiography across much of eastern Canada and the northeastern United States:
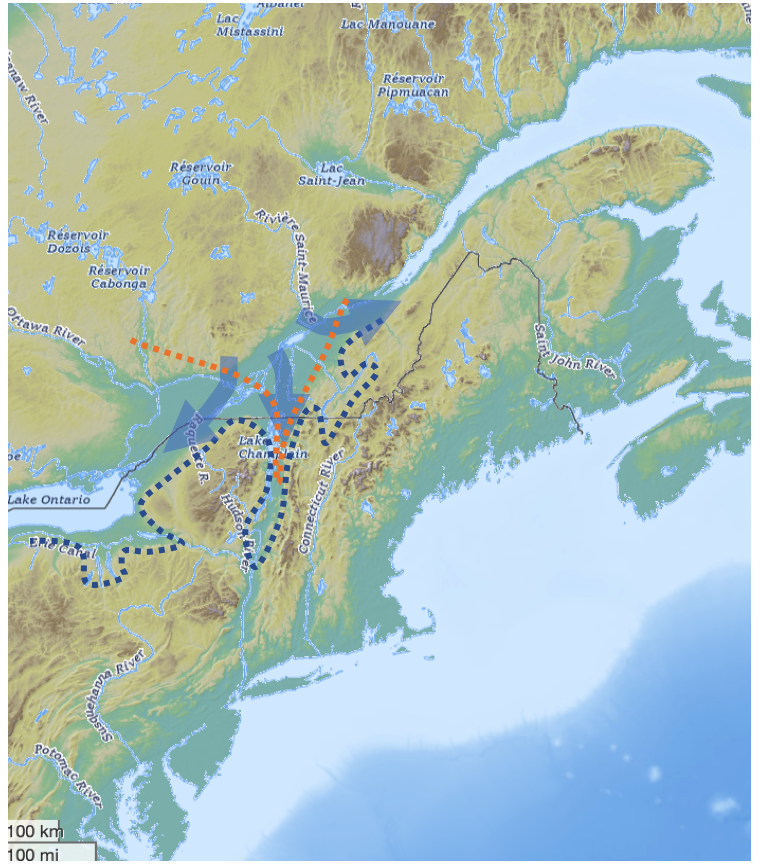
This map gives a sense of the regional “Bath Tub” which confronted and influenced the Laurentide ice sheet in its recession, as studied and described in detail in this report for Vermont. For example, I have added the dark blue dotted line to illustrate the very approximate location of the ice margin suggested by my analysis of ice margin features for T4 time in Vermont and its approximate correspondence with physiography. This time, level, and margin is well and widely marked by ice margin, ponded water, and drainage features across the State of Vermont, including Ice Marginal Channels which I interpret in this case as indicating a readvance by which the base of an outer fringe of the ice sheet became warmed, forming a three layered condition of Warm over Cold over Warm ice, with the lower layer warmed by the readvance of the ice sheet over terrain that had been heated. This resulted in conditions favoring the formation of this particular zone of Ice Marginal Channels, which along with other ice margin features provide a ”Signature” pattern that greatly facilitates mapping, again as marked by many such features across the State of Vermont.
While the determination of deglacial history in this report focuses on Vermont, it is interesting to explore the trace of this margin within and beyond Vermont as depicted on the above map. For example:
- T4 time marks the transition from the earlier and higher T3 time in the “Nunatak Phase,” which is marked my numerous (numbered in the hundreds) of Ice Margin Channels, which are interpreted as representing the oscillatory lowering of the ice sheet surface, leading to the “Lobate Phase,” when discrete ice lobes first developed in discrete basins, which in many places are clearly suggested by Channels on LiDAR imagery.
- The T4 margin was closely associated with previous the late T3 margin. In late T3 time the ice sheet in the Memphremagog Basin, extended as a spillover into the Upper Connecticut Basin forming an ice lobe with drainage features (near Bradford, Vermont), graded to Lake Hitchcock. Together the T3 and T4 ice margins in Vermont are correlated with the White Mountain Morainic System, which has been reported as a significant readvance dated as 13 – 13.8 KA BP.
- Whereas Stewart and MacClintock identified a “moraine” at St Johnsbury in the Upper Connecticut Basin, said by them to be one of the finest moraines in New England, the mapping here shows that this moraine was “Scabby Terrain,” formed by en masse stagnation of the Connecticut Basin lobe (the third and last such stagnation in T3 time in the Connecticut Basin, the first and second represented by T1 and T2 times) formed when the ice sheet in the Upper Connecticut Basin became “Disconnected” from the Laurentide parent to the north when the late T3 ice sheet level lowered to the divides between the Mempgremagog and Connecticut Basins in T4 time. The idea of “en mass” stagnation dates back to the 1930s when Richard Foster Flint proposed en masse stagnation of the “Connecticut Glacier.” This remained a long lasting controversy between active ice vs. stagnant ice theories, which is here resolved by a combination of both.
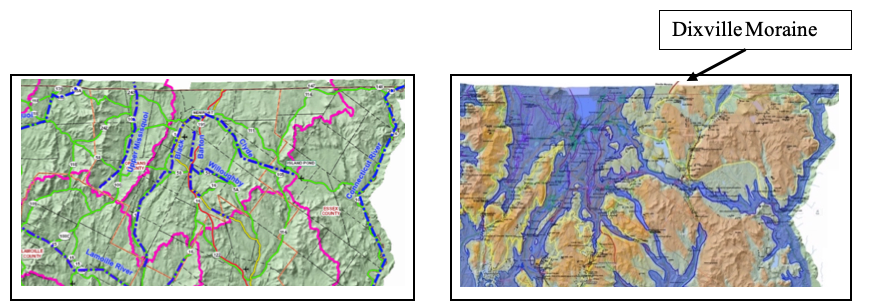
- The late T3 margin is also correlated with the Frontier Moraine of Parent et Occhietti in Quebec, which according to Etienne Brouard (personal communication, 2026), interestingly, is actually a series of Ice Marginal Channels. In addition, the T4 margin correlates with P & O’s Dixville Moraine in Quebec. Brouard et al have identified a readvance referred to as the “Memphremagog Readvance,” mostly in Quebec but extending into Vermont, which as mapped fits with my T6 ice margin in the Memphremagog Basin, but may better correlate with the T4 ice margin, which needs to be examined and studied.
- In the Champlain Basin the late T3 and T4 margins mark the beginning of the step-down recession of a long Champlain lobe which continued to T7 time. Again the T3 and T4 margins are well and substantially marked, showing that the Champlain lobe tip at these times bifurcated with a sublobe into the Vermont Valley, corresponding with the Bennington and Rutland “moraines” of Stewart and MacClintock, and a lobe in the main basin. Evidence in literature reports support a readvance associated with these moraines.
- In east central New York, Dineen and LaFleur have mapped multiple step-down ice margin positions, including in the Vermont Valley. Their positions 1 and 12 match and correlate with the late T3 and T4 ice margin positions mapped here.
- The ice margins in northwest New York have been mapped by numerous investigatiors, from Denny in the 1960s to Franzi et al most recently. The equivalent positions of the late T3 and T4 margins in northwestern New York have yet to be established but it is interesting that my examination of the Cadyville moraine of Denny on LiDAR imagery suggests that this moraine is instead a series of Ice Marginal Channels. The elevation of this feature is close to the T4 level, but whether or not this correlates with the T4 margin in Vermont remains to be determined.
- The region beyond the Champlain Basin further west in New York is, of course, far beyond the area of focus here. However, it is interesting that the T4 margin as depicted on the above map appears to extend approximately into the Finger Lakes region. Early in my undergraduate training I served as a field assistant on a study of the “Binghamton Question” which had to do with the possible correlation of the Valley Heads readvance in the Finger lakes with features further east in New York. Again, this subject is clearly well beyond the scope of study here but as noted in the text below, the deglacial history of the Finger Lakes region, with its readvance, overdeepened basins, ice streaming, moraines in headwater divide areas , and numerous Ice Marginal Channels compares remarkably well with the headwater areas of the Memphremagog Basin.
- Finally, the orange colored dashed line is added to the above map to depict the Late T7 ice margin for the Champlain lobe immediately prior to its collapse. This ice margin is substantially marked by numerous “Signature” features including “Scarps” formed at lateral shear margins of the Champlain lobe ice stream, indicative of streaming, with evidence interpreted as indicating a “ collapse.” Ice streaming lines are added to conceptually suggest the splayed ice stream into the central Champlain Basin with appendages streaming to the southwest into the Ontario Basin and to the northeast into the St Lawrence Basin.
- Not shown is a final T8 readvance restricted to the Missisquoi Basin in Champlain Sea time.
Whereas the deglacial history as just described is explored in detail in the report below, the point here is that physiography played a significant role in this history, making it necessary to understand the lay of the land.
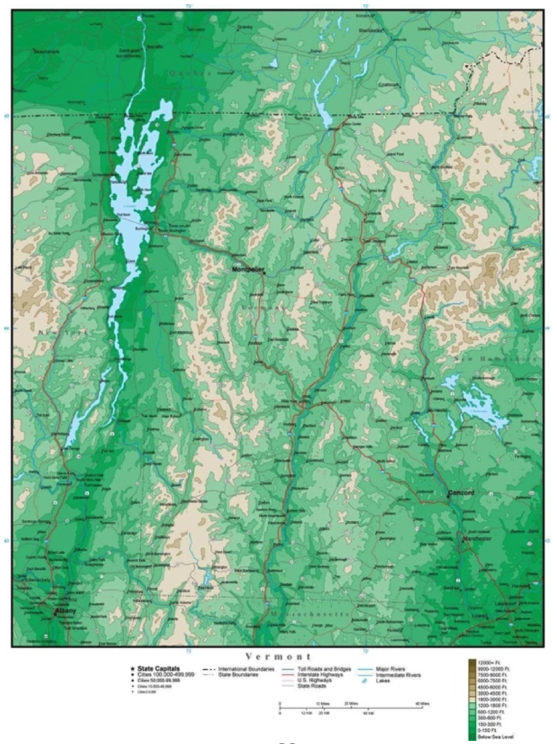
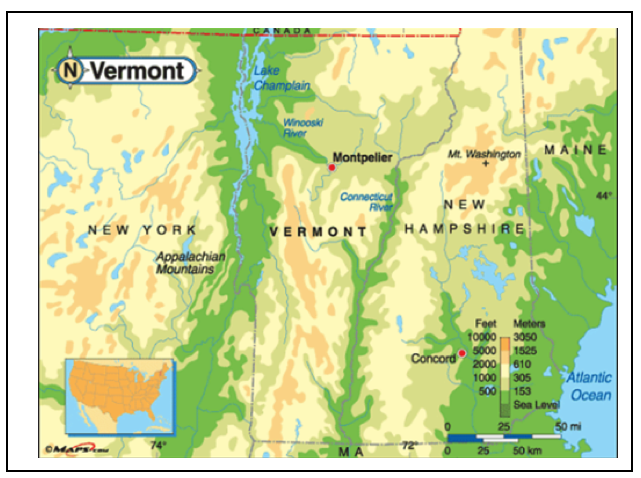
Returning to the topic of helpful physiographic maps, many maps are more pictorial, but nevertheless give helpful insight about physiographic relationships. For example, the following map shows the Winooski and Lamoille Basins, which were occupied by tributary sub-lobes of the Champlain lobe, and which as deglaciation progressed became occupied by major proglacial lakes Winooski and Mansfield as delineated by Stewart and MacClintock and Springston et al, as discussed above.
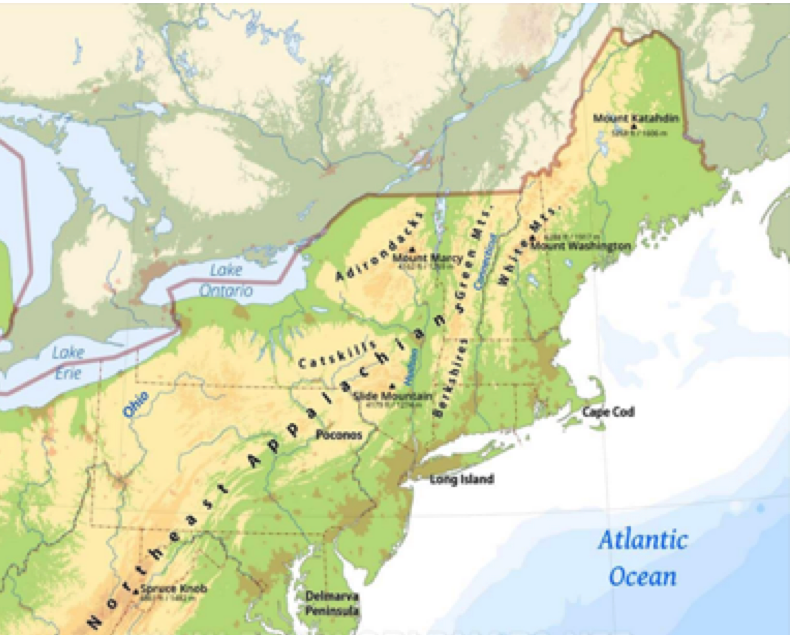
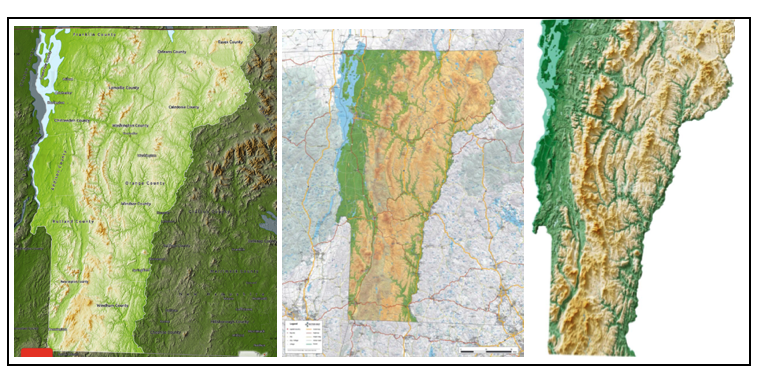
Likewise, the following maps also are examples of more pictorial physiographic maps:
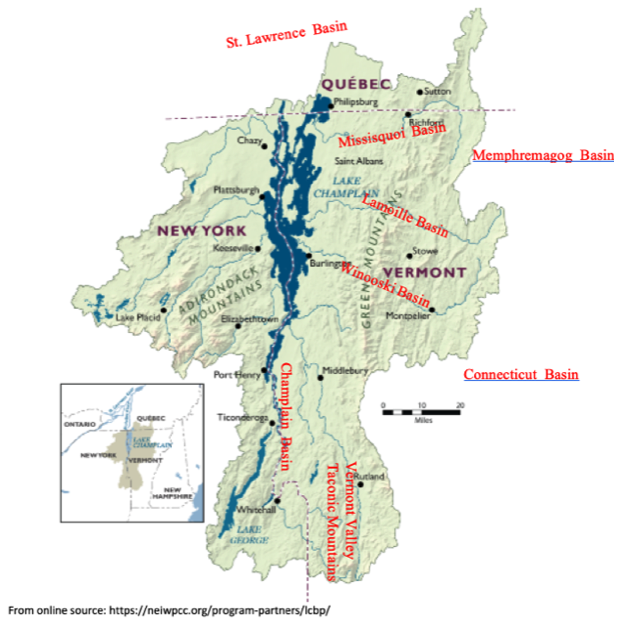
While not portraying physiography per se, the following maps show Vermont’s major drainage basins, which reflect and are dictated by its physiography: 4 https://dec.vermont.gov/watershed/map/program/major-basins
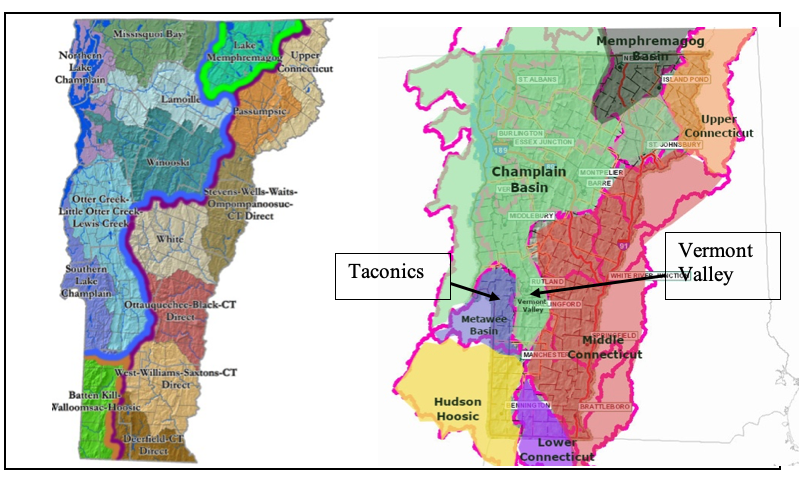
The map on the above right is the same drainage basin map as on the left, which is superimposed semi-transparently on a VCGI map of the State with the drainage basin tab turned on, with coloring to identify and demarcate regional drainage basins (purple colored lines). From the standpoint of deglacial history most of the State of Vermont can be divided into three major glacial drainage basins, specifically the Champlain, Connecticut, and Memphremagog, each of these occupied by discrete ice lobes, with small portions in the Metawee and Hudson-Hoosic Basins in the southwest corner of the State. For reasons explained below, the Connecticut Basin is here divided into Lower, Middle, and Upper portions. Also shown is the “Vermont Valley,” a colloquial name given for the long, low extension of the Champlain Basin between the Green Mountain front and the Taconic Mountains in the southwestern sector of the State.
The following map likewise is helpful in regard to the Champlain lobe, which was the most substantial ice lobe in Vermont, for its closer view of the Champlain Basin. The physiography of this basin was especially important in the State’s deglacial history:
As just mentioned in the preceding, the southern headwater area of the Champlain Basin bifurcates into two portions, specifically the lower Lake Champlain Basin floor and the higher Vermont Valley, the latter again a colloquial term for the relatively deep valley extending southward from the Rutland area to the Bennington area, separated from the Champlain basin floor to the west by the Taconic Mountains. The southernmost extent of the Champlain Basin in the Vermont Valley is near Manchester, south of which the Vermont Valley is in the Metawee and Hudson-Hoosic drainage basins. Also marked on the map for general reference are other neighboring sub-basins.
As a sidebar:
As deglaciation proceeded from the glacial maximum, the developing nunatak and ice lobe margins in Vermont were affected and largely governed by physiography, the primary lobes being in the Champlain, Memphremagog, and Connecticut Basins as depicted on the above physiographic maps. As noted above, the Champlain lobe was the largest, with the lowest floor and most open connection to the north, meaning it was directly fed by the parent Laurentide ice sheet to the north, and therefore the most robust. The floor of the Champlain Basin extends southward for over 100 miles from the Quebec border to its divide with the Hudson Basin, in the vicinity of Whitehall, New York.
The eastern margin of this lobe was against the foothills and the relatively steep front of the Green Mountains, which is broken by the major westward draining Missisquoi, Lamoille, and Winooski Basins, and other, smaller basins. As previously noted, the recession of the ice margin along the eastern side of the basin was marked by a distinctive Style, reflecting the progressive and incremental ice margin recession resembling closely spaced rings on a “Bath Tub”, characterized by a step-down sequence of stagnant ice deposits, drainage lines, and local proglacial lakes, giving way to regional proglacial Lake Vermont. This step-down sequence had a very complicated history related to the irregular topography of the foothills. One consequence of this is that the identification of Coveville Lake Vermont and its distinction from local upland lakes is very difficult and challenging.
Likewise, again as already noted, the smaller Memphremagog Basin was open to the north for a direct connection with the parent ice sheet, with a relatively flat, low gradient floor but at a relatively high elevation as compared to the Champlain Basin. This basin is marked by a massif in its southern portion, broken by long, narrow valleys extending to and across divides with the Connecticut and Lamoille Basins to the south. In a sense, the shape of the Memphremagog Basin is hand-like, with the palm representing the basin floor, with long and narrow drainage fingers. Unusually deep, “over-deepened” lakes occupy the floor of many of these fingers. The analogy with the Finger Lakes of New York, both physiographically and geologically, is remarkable. The present day basin floors of these over-deepened basins are at elevations below the present day Lake Memphremagog, thus representing deep, closed basins which, along with many other unusually deep lakes and ponds in northeast Vermont, served to hold isolated blocks of long lasting ice during deglacial times. These contributed to an ice margin Style, as explained below, and referred to as “Everything, Everywhere, All at Once and Continuing.” This same, relatively complex Style also was found in the foothills of the Champlain Basin in conjunction with a calving ice margin. The point being made here is that ice margins were more complex than the traditional view of these as simple lines on maps.
Also as previously noted, in contrast, the Connecticut Basin, while substantial in size, representing almost half of the State, is marked by significant uplands to the north and thus the ice mass that occupied this basin was less well connected to the parent ice sheet. This difference had significant impact on the deglacial history of the Connecticut Basin, at least for the Vermont portion. In particular, again as discussed below, the lowering of the ice sheet resulted in much and perhaps all of the ice mass in the Connecticut Basin, again at least in Vermont, becoming “Disconnected,” resulting in en mass stagnation of the ice mass at three successive times in different locations, governed by physiography. Also, a different type of Disconnection is identified in association with Lake Winooski, a large standing water proglacial lake in the interior uplands of the Winooski and Lamoille Basins.
Whereas the Connecticut Basin drains southward along the eastern portion of Vermont, continuing southward to Long Island Sound, the Champlain and Memphremagog Basins drain northward. As such, again as noted above, the generally northward recession of the margins of the lobes in the Champlain and Memphremagog Basins faced “reverse gradient” conditions. 5 Numerous publications in the glaciology literature identify “reverse gradient” environments as being especially vulnerable for destabilization, which may become irreversible as the ice margin retreats into areas where the depth of proglacial waters increases. Of course, the surface gradient of the ice sheet itself was generally southward, associated with the southward flowing ice, as was necessary for the nurture and feeding of these ice lobes by flow from “accumulation areas” to the downgradient “ablation areas” near lobe frontal margins. Thus, during recession of the ice sheet its frontal margins retreated northward, down the regional physiographic gradient related to the St. Lawrence lowland, and as a consequence, whereas meltwater drainage off the ice sheet during its retreat was southward, as marked by ice marginal drainage features along its margins, in the low areas of the Champlain and Memphremagog basins, the lower, frontal and lateral side margins of the ice lobes were associated with standing proglacial water.
The above physiographic maps give a helpful sense of late glacial terrain which is illustrative, supportive, and even predictive of detailed aspects of the deglacial history reported here. Ice margin features have been found at many elevation levels in both the Nunatak and Lobate Phases, again like closely spaced rings on an irregularly shaped “Bath Tub”. These are numerous, spanning a broad elevation range, suggestive of progressive, incremental, more or less steady lowering of the ice sheet. However, features are more numerous and larger at particular levels, which can be correlated across the State (using elevations adjusted for isostatic rebound) which supports the usage of a Bath Tub Model as a basis for deciphering deglacial history “stillstands.” 6As discussed elsewhere below, whereas “stillstands” are commonly regarded as indicative of climatic variations, that is not necessarily the case and not the intended meaning of the usage of this term here. Ice margin and drainage features provide links between basins, further documenting the correlation of ice margins at different, multiple levels across the State with different ice margin Styles, again supporting the applicability of the Bath Tub Model. The history of deglaciation as documented by ice margin features and presented in this report in the context of the Bath Tub Model is not just consistent with this physiography, but physiography as portrayed on such maps as above is suggestive of considerable detail as has actually been found.
By way of underscoring and illustrating the close correspondence between Vermont’s deglacial history and its physiography, the map on the left below, taken from VCGI, shows drainage basin boundaries in northern Vermont in the Memphremagog Basin and portions of the adjoining Connecticut Basin, highlighted by purple lines, with individual surface water drainage systems by blue colored lines, all as exist today, in modern times. And the map on the right, also from VCGI ice margin mapping, shows the ice sheet extent in the Memphremagog Basin at a particular (“T4”) time with ice coverage shown by blue color shading, with discrete finger-like lobes extending across divides into the Connecticut Basin. The ochre shaded areas represent terrain above 1600 feet(488 m).
The ice margins of this blue shaded ice sheet are marked and documented by many stagnant ice deposits at correlative elevations, with elevations adjusted to take into account isostatic rebound effects. This ice margin represents the lower portion of the aforementioned T4 “hybrid margin,” which again is marked by stagnant ice deposits in contrast to the upper portion of the hybrid margin marked by Ice Marginal Channels associated with active ice. This hybrid ice margin is also part of the aforementioned ice margin “Signature,” which as discussed in more detail below facilitates mapping and correlation by easily recognizable, recurrent patterns. This T4 active ice margin receded northward to a new, lower T5 position while the stagnant ice deposits were still forming at the T4 level, as part of the “Everything, Everywhere, All at Once, and Continuing” Style.
The upper, active ice margin portion of the hybrid margin on the map above is marked by T4 Ice Marginal Channels which can be traced across the Memphremagog Basin where they correlate with the Dixville moraine in Quebec, as indicated by the small red line on the above map, right. Also, the T3 and T4 margin is correlated with the White Mountain Moraine System in the Littleton and Bethlehem area of New Hampshire (not shown on the above maps), as reported by Thompson et al, and as discussed at length below in Section 3. This correlation suggests that the blue shaded areas on the above map represents the ice sheet associated with an Older Dryas readvance, again as reported by Thompson et al, also as discussed below. Not shown on the above T4 map is the margin of the ice mass in the Connecticut Basin, marking the last of three Disconnections, as marked by Scabby Terrain at the late T4 level.
As reported by Thompson et al, the White Mountain Morainic System represents a readvance. It is believed that the T3 and T4 margins on the above maps in Vermont represent this readvance, again, marked by a “Signature” ice margin pattern which can be traced southward and westward across nearly the entire State of Vermont, with suggested correlations in New York, again as discussed in Section 3 below. This is also discussed in Appendix 3.
Of course, the close correspondence between physiography and ice margins results from using the Bath Tub Model and thus should not be surprising, and in a sense this observation entails circular reasoning. However, the fact is, and this is an important and key point, that in each and all of the Memphremagog basins, specifically the Clyde, Willoughby, Barton, Black, and Upper Missisquoi, very substantial (frontal ice margin) stagnant ice deposits occur at the same adjusted elevations at valley heads, extending across divides with neighboring Lamoille and Connecticut Basins in close contact with similar deposits at comparable elevations. This represents and reflects the ice margin being closely controlled by physiography in the “Bath Tub Model.”
Whereas the above maps give a general sense of physiography bearing on deglacial history, local and more detailed physiographic differences were important but are not so obvious by a casual examination of these large scale maps. For example, in the northeastern Champlain Basin, per the map below, the terrain of the Green Mountain foothills is very irregular. The ice margin in T4 time stood firmly against the flank of the Green Mountains, with numerous drainage features, including Bedrock Grooves, marking the ice margin, with a multitude of local proglacial lakes which coalesced and enlarged through time. Owing to terrain configuration, the foothills just north of the Lamoille Basin, extend further westward than much of the foothill and mountain front further north, thus trapping meltwater on the ice sheet surface itself and along its margins, leading to the formation of the Shattuck Mountain Pothole Tract, as shown on the map below:
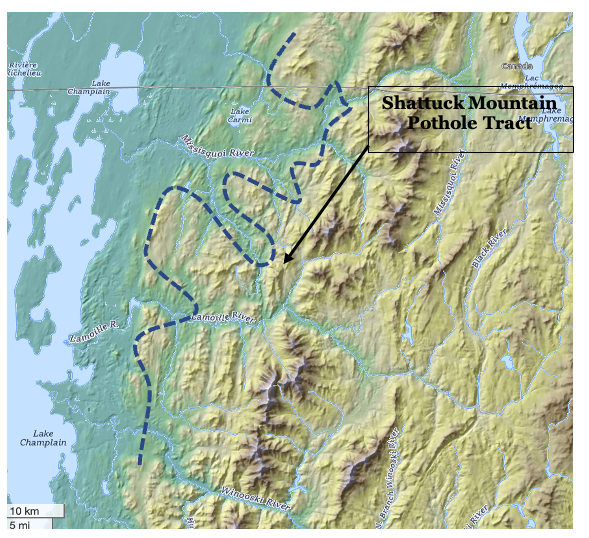
This physiographic projection served to trap meltwater drainage from a large watershed area on the surface and along the margin of the ice sheet, which is presumed to have sloped southeastward, accounting for accumulation of substantial meltwater at this location, and resulting in the development of many Bedrock Grooves, and the very unusual potholes as discussed further below. This drainage is believed to have continued southward along the eastern margin of the Champlain lobe, transporting huge quantities of gravel southward which at a late glacial time became incorporated in lateral shear margins, marked by Scarps, where this material was incorporated into a distinctive type of glacial till as part of the record for the “collapse” of the Champlain lobe.
Also as illustrated by the two maps below and discussed in great detail in the body of this report, another example of the importance of local topography relates to the floor of the Champlain Basin. The Basin floor is not flat but instead consists of three distinct divisions, as shown on the maps below, for the portion of the basin south of Burlington.
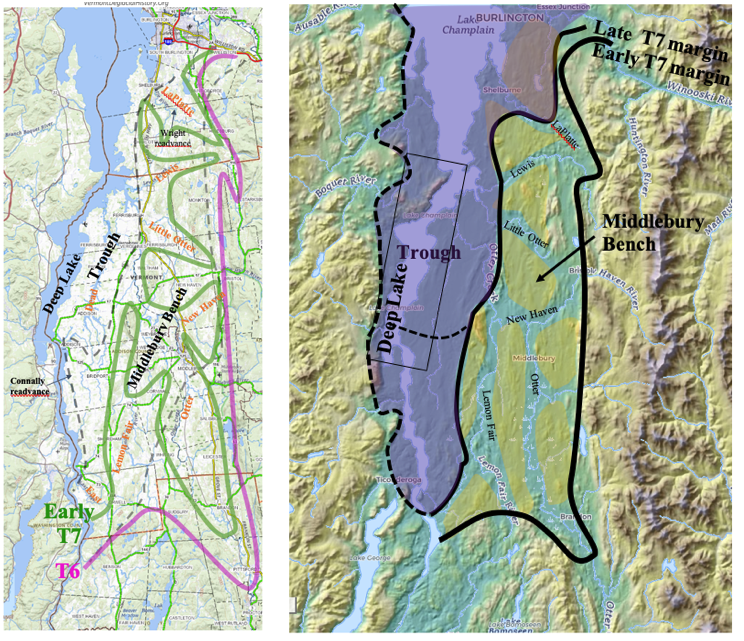
The map on the left above is from a base map provided by Vermont Center for Geographic Information (VCGI), which was used extensively for the surficial geologic mapping reported here, especially VCGI’s LiDAR imagery. VCGI offers several base maps for marking findings; the version on the left is a relatively simple USGS type map, but without the contours. The map on the right was taken from the above described online source of a shaded relief LiDAR based map. In general, the selection of map bases used in this report are from VCGI base maps, which are functionally very effective for mapping but unfortunately do not convey a good sense of the topography or physiography. Were I to rewrite this report from scratch, I would utilize improved base maps. to better convey the terrain.
In any case, both of the above maps are presented in separate discussions in the report below to refer to the importance of the unevenness of the Basin floor in regard to Glacial Dynamics and deglacial history. A raised portion of the Basin floor, referred to as the “Middlebury Bench” served to buttress the Champlain lobe as it receded and lowered, with calving beginning in T7 time when Lake Vermont lowered from the Coveville to the Fort Ann level. Calving ice streams developed in the re-entrant basins penetrating the Bench such as the LaPlatte, Lewis, and others as shown on the map, with the Bench uplands serving as buttressing support. Further recession led to the development of a long convex lobe confined to the Trough, a lower portion of the Basin floor, at which time the buttressing support was lost. Lateral shear margins of the streaming Champlain lobe ice stream at this time are marked by many Scarps and other features, which are part of a story interpreted as indicating the collapse of the Champlain lobe, as discussed in detail below.
Also with regard to physiographic maps and the Champlain Basin floor unevenness, the makers of such physiographic maps generally rely on topography, such as provided by USGS topographic contour maps. While this is appropriate for most general purposes, the omission of bathymetric information for Lake Champlain results in an incomplete and in a sense misleading picture of the physiography of the lowermost floor of the Basin. For example the following map shows the bathymetry of Lake Champlain.7 Manley, T.O., Manley, P.L., and Fisher, G.B. at Middlebury College. [/mfn}:
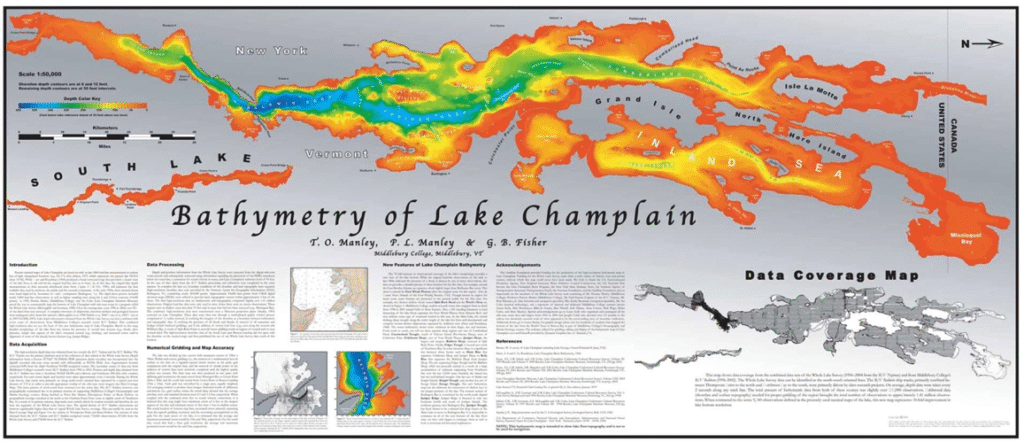
This map is quite significant in that it shows the “Deep Lake” (the area of blue shading) as Vermont residents call the deeper portions of Lake Champlain, reaching depths of about 400 feet. Given that the elevation of present day Lake Champlain is about 100 feet above sea level, the bottom of the “Deep Lake” is well below present day sea level. Of course, this bathymetry was different in late glacial times owing to isostatic uplift since then. However, even taking this into account, the configuration of the Deep Lake portion of the basin is significant. It is here believed that the floor of the Lake Champlain Basin as depicted above represents an “overdeepened” basin. Overdeepened lakes are also found in the Memphremagog Basin, which likewise is not evident on topographic or physiographic maps. The term “overdeepened” is used here in the same context as the Finger Lakes of New York, where the Valley Heads moraines are remarkably similar to the Memphremagog Basin deglacial record. It appears that overdeepening relates to the narrowing of the physiographic “funnel” through which ice flow is constrained.
Further, it is suggested that the Deep Lake portion of the Basin may have resulted in differences between the deglacial records on the Vermont versus the New York side of the Basin, as for example perhaps with calving occurring earlier and more substantially on the New York side. Also, while not shown by these maps, the physiography on the New York side versus the Vermont side is generally quite different which may further result in differences in the deglacial history records.
Footnotes: