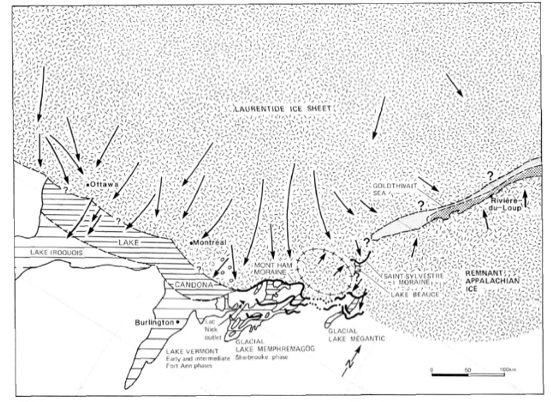
According to conventional thinking, the configuration of the Champlain lobe and its ice margin position during recession through time is that the position of its margin stood north of the Quebec border in Fort Ann time. Parent et Occhietti, 1988, give a sense of splaying of the Laurentide ice sheet in Fort Ann time, again with the ice margin in Quebec in Fort Ann time:
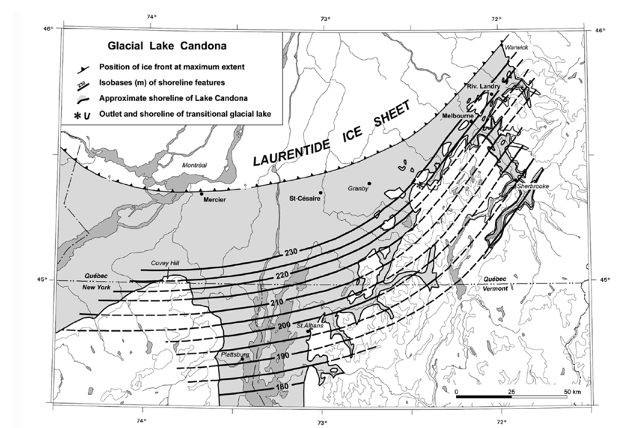
Similarly, Parent et Occhietti (1999, Figure 5) depict the ice margin as standing substantially to the north in Fort Ann (Lake Candona) time:
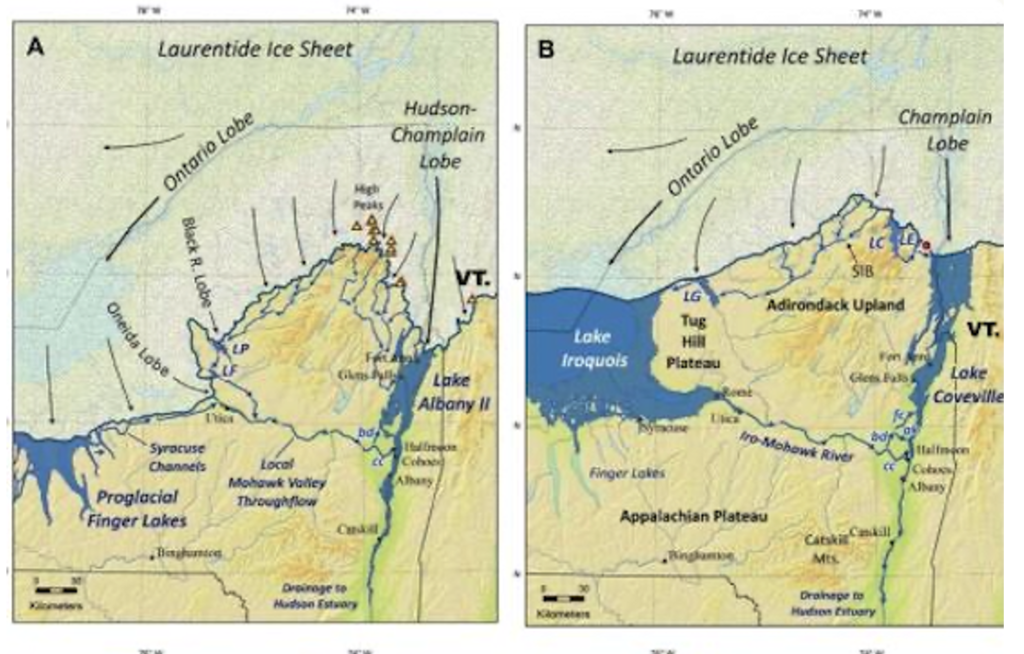
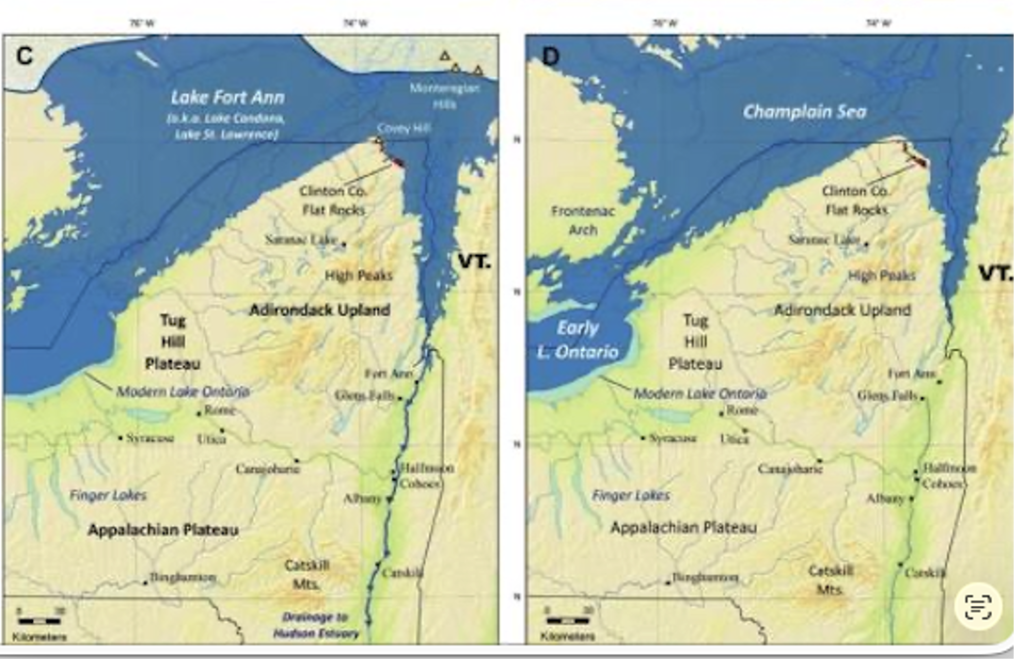
A 2023 report by Franzi, Carl, and Pepperstone (2025) 1 Franzi, D. A., Carl, B.S., and Pepperstone , H.S.(2025) Late glacial lake and marine strandlines in the Ontario, St. Lawrence, and Champlain Lowlands, USA and Canada record steadily decreasing water levels interrupted by breakout floods; Quaternary Research, V 129, pp 1-18. https://doi.org/10.1017/qua.2025.15 shows receding ice margins and associated water bodies:
More recently, Parent (2023) 2 Parent, M., 2023, The Younger Dryas in the Lower St. Lawrence Valley, Québec: Readvance to the St-Antonin Moraine and development of the St. Lawrence Ice Stream; 84th Annual Reuni9n Friends of the Pleistocene; 33 p. presented findings in the St Lawrence Basin indicating a late glacial shift in the Laurentide ice sheet from southward flow to an ice stream in the Basin with strong easterly, down-basin ice flow, and with a late glacial readvance which briefly re-closed the basin. A series of maps by Parent (Figure 11) show a tri-lobed pattern of ice flow, with five successive times:
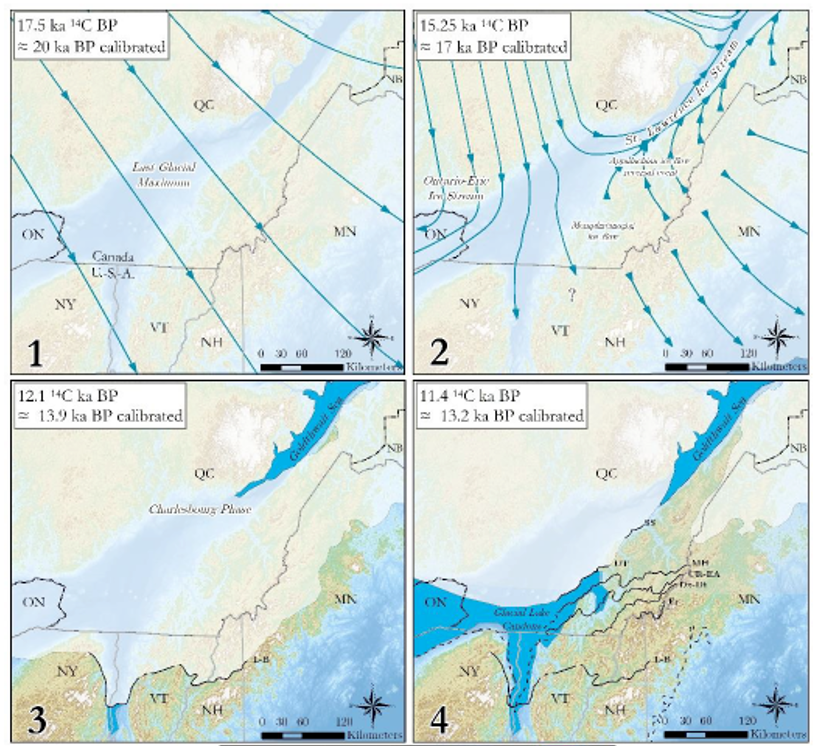
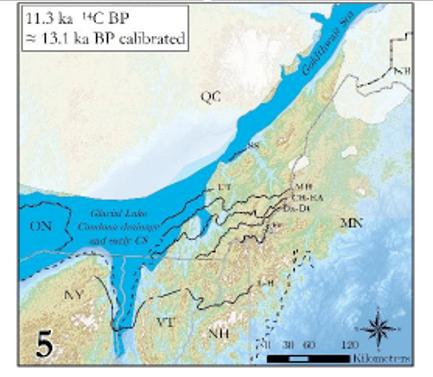
By comparison with the mapping presented here for Vermont, whereas the details differ, Parent’s third time step approximately corresponds with late T3 and T4 time, and his fourth time step with T7 and Fort Ann time.
To facilitate comparison, several of Parent’s maps are enlarged. His time step 2 is shown on the following:
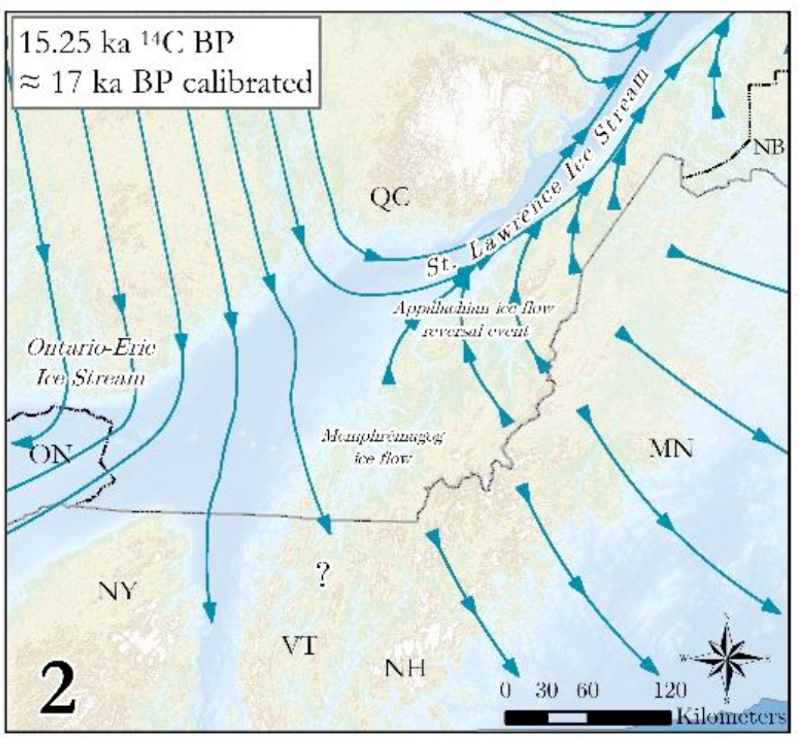
Parent’s time step 2 corresponds with an early time, likely prior to late T3 time in the Nunatak Phase as mapped here. Interestingly, Parent depicts ice flow lines clearly showing a tri-lobed pattern with three Ice Streams, in the Ontario, St. Lawrence, and Champlain/Memphremagog Basins in Vermont.
Parent’s time step 3 is shown below:
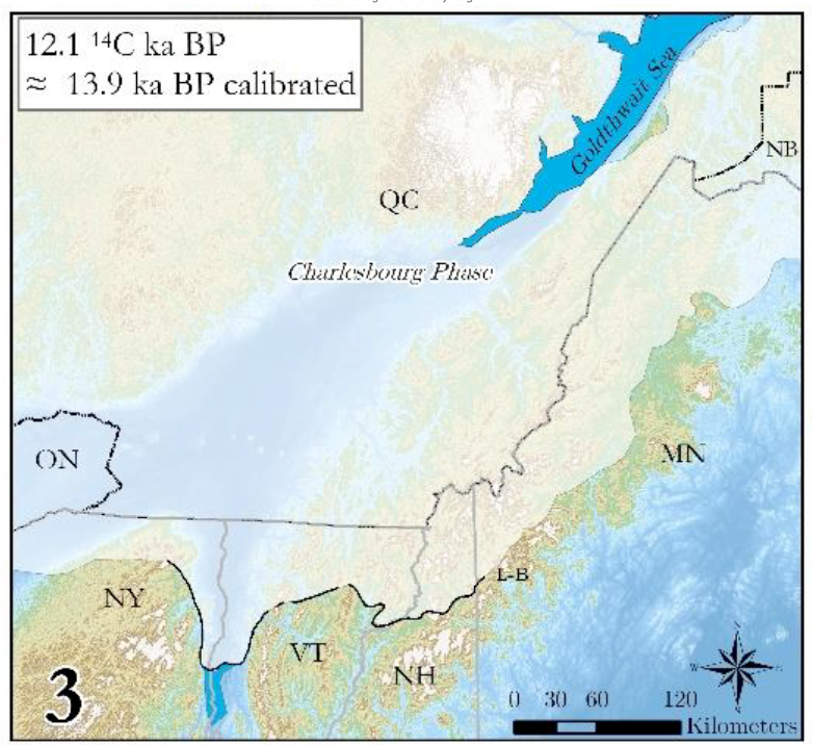
This time corresponds with the Littleton-Behlehem moraine in New Hampshire, which in this present report here is referred to as the lower portion of Thompson et al’s White Mountain Morainic System (WMMS) in lateT3 and early T4 time. In the VCGI mapping presented here the early, higher part of Thompson’s White Mountain Morainic System is mapped as corresponding with late T3 time and the lower portion as T4 time. Based on isostatically adjusted elevations corresponding with the reported NE/SW trending isobases, this late T3 time is correlated with the Frontier moraine. Interestingly, Brouard (2026, personal communication) has indicated that he believes the Frontier moraine may correspond with Ice Marginal Channels. Later portions of the WMMS in T4 time are correlated with the Dixville moraine. Further, the mapping here for Vermont shows much more convoluted and detailed ice margins in late T3 and T4 times in close correspondence with the physiography in the Memphremagog and Champlain Basins than suggested by the above Parent map. In this present report, late T3 and T 4 margins stood in the Vermont Valley at Bennington and Rutland, respectively, wrapping around the Taconics, and extending southward in the Champlain Basin prior to the development of Coveville Lake Vermont.
Parent’s time step 4 is shown below:
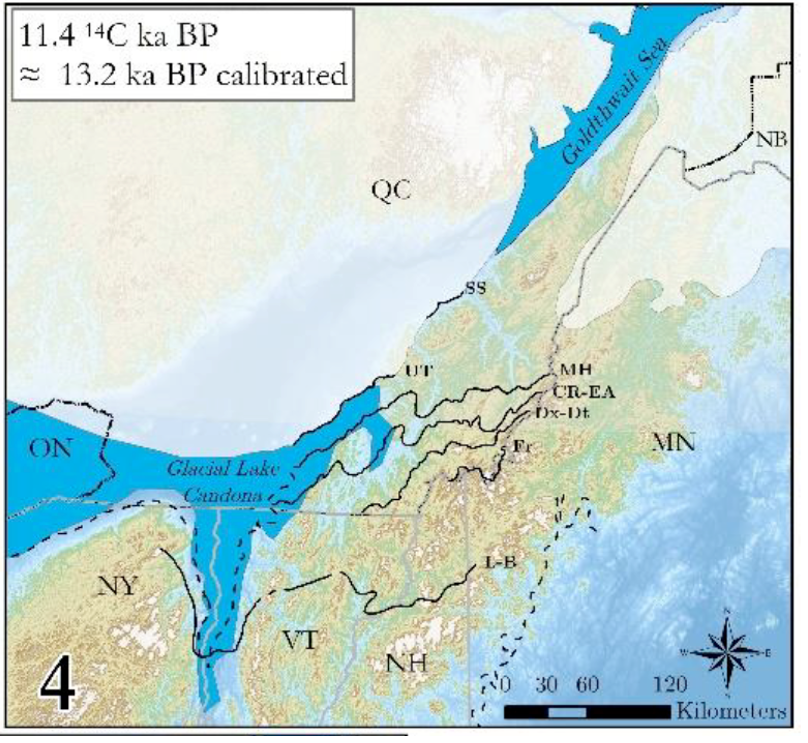
As can be seen, this time step corresponds with Lake Candona, which correlates with Fort Ann Lake Vermont. However, in this present report Fort Ann corresponds with a range of times, including:
- The lowering of Lake Vermont from the Coveille to Fort Ann levels in late T6 and early T7 time as marked by Streaks, when the ice margin extended substantially southward in the Champlain Basin with a bifurcated frontal margin.
- Westward recession of the margins of ice masses in the Middlebury Bench re-entrant basins in T7 time from the foothills to the Trough, triggering the first phase of ice streaming of the Champlain lobe, as marked by Scarps, again with the Champlain lobe occupying the southern and central portions of the Champlain Basin.
- A second phase of streaming, and possibly the “collapse(?)” of the Champlain lobe in late T7 time associated with the lowering of Fort Ann Lake Vermont to the Champlain Sea, during which time the Champlain lobe receded northward to and beyond the Quebec border.
The mapping here in T7 time suggests that the Champlain lobe stood as a long, convex ice mass extending southward in the Champlain Basin, with Lake Fort Ann occupying a narrow, “Disaggregated”more or less open water corridor, the head of which progressed rapidly northward into Quebec in T7 time to allow for the opening of the basin for the incursion of the Champlain Sea, followed by rapid northward recession of the Champlain lobe frontal tip, to and beyond the Quebec border, as part of the collapse(?) of the Champlain lobe – again all in T7 time. Thus, Parent’s time step 4 as shown on the above map would represent a late but perhaps not the latest T7 time.
Parent’s time step 5 is shown below:
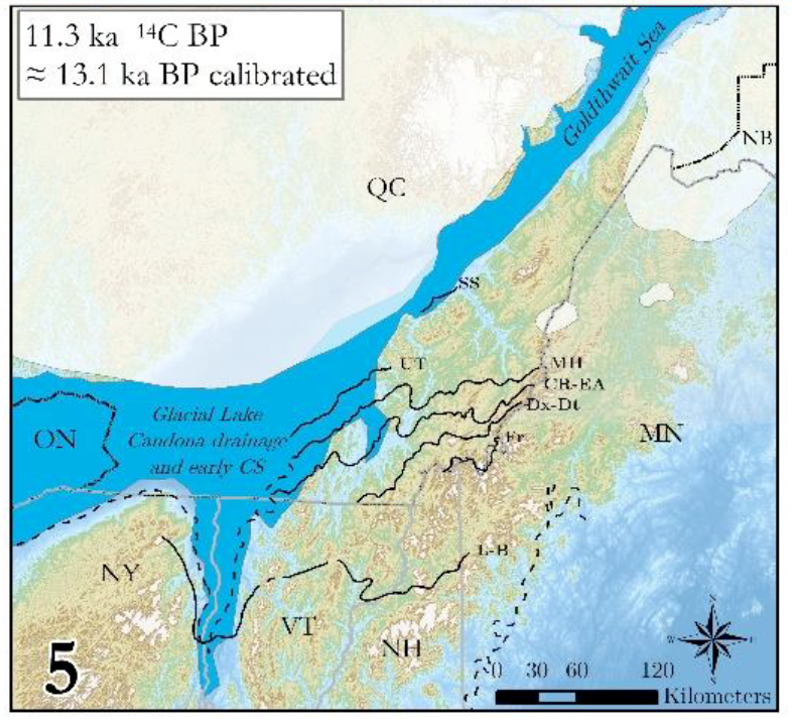
As indicated by Parent, this time step represents the transition from Candona (Fort Ann) to early Champlain Sea time. By contrast, the mapping here suggests that at Parent’s time step 5 time the Champlain lobe still stood as a long convex ice mass occupying the Trough in Vermont, with the second phase of accelerated streaming (or collapse(?)) beginning at the time of lowering from Fort Ann to Champlain Sea, as marked by the erosional gouges in the Onset Zone near Shelburne, south of Burlington.
To illustrate this difference, a patterned lobe is added to Parent’s time step 5:
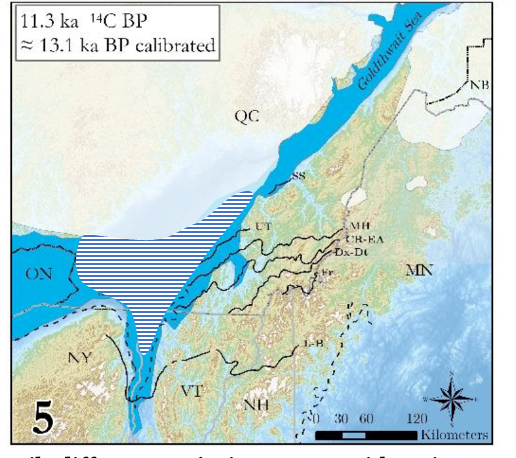
Whereas the details differ, Parent’s time step 5, with an ice margin in Quebec, would fit with the recession of the ice margin recession as suggested here for the collapse(?) of the lobe in very late T7 time, in as much as T8 time is here defined as representing a readvance in Champlain Sea time after its initial incursion.
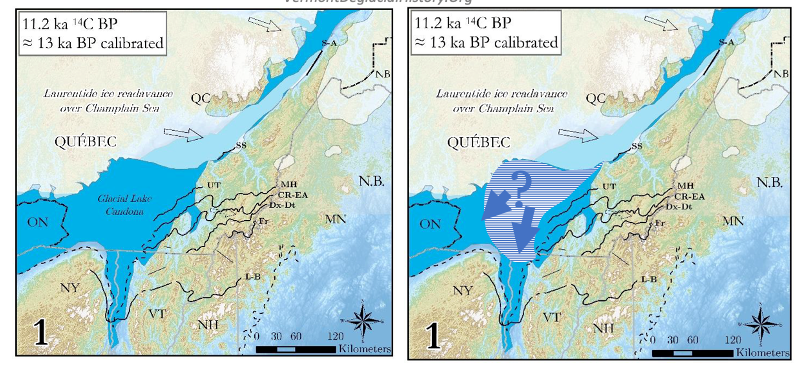
Interestingly, Parent’s Figure 12 shows a readvance of the Champlain lobe to close the basin, suggesting the re-establishment of Lake Candona (Fort Ann), but with the ice sheet remaining in Quebec. Parent’s position of this portion of the ice sheet as depicted on his Figure 12 is documented by newly identified moraines in the vicinity of Quebec City, but these moraines do not indicate the position of the ice margin further toward the west and southwest. It is possible but not established that this readvance corresponds with the T8 readvance in the Missisquoi Basin of Vermont, although obviously such an interpretation would require the projection of the ice margin at this time into the northern portion of the Champlain Basin in Vermont. Parent’s map depicting this readvance is shown below (left), with a revision (right) to suggest a possible correlation of Parent’s readvance with the T8 readvance evidence in the Missisquoi Basin in Vermont (which again is based on Cannon (1964) and Wagner(1972):
The above discussion conceptually suggests a tri-lobed regional model, with a long convex Champlain sub-lobe projecting southward in the Champlain Basin in Champlain Sea time, and with sub-lobes as well projecting southwesterly in the Ontario basin and northeasterly in the St. Lawrence Basin, as depicted schematically below:
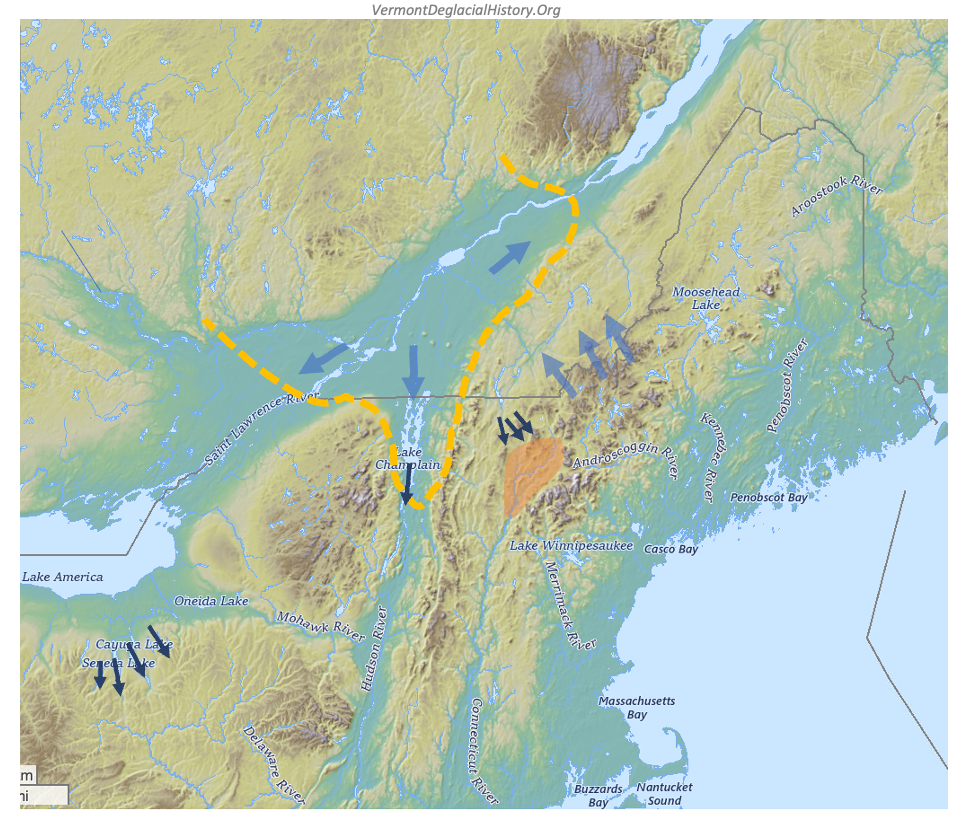
This depiction represents a time in deglacial history prior to the collapse(?) but more importantly is an expression of Glacial Dynamics, primarily driven by the recession of the ice sheet largely but not entirely in a reverse gradient setting, with a close correspondence of the ice margin to the proglacial water bodies, including Lake Iroquois, Lake Vermont, and the Atlantic Ocean.
Added to this conceptual model are other elements associated with the Glacial Dynamics during the recessional history at different times, including:
- Overdeepening of basin floors, as marked by the small dark arrows, possibly involving multiple glaications, as is well known for the Finger Lakes area, and again as discussed above for the Champlain Basin and the Memphremagog Basin. As discussed above, such overdeepening may represent Dynamics associated with multiple glaciations over a longer time, including prior to the last glaciation being discussed here.
- The evidence presented here indicates that the Glacial Dynamics for Vermont, included Disconnections of ice masses and resultant en masse stagnation at three times in the Connecticut Basin, and as well Disconnections of ice masses in the deeper basins along the eastern flank of the Green Mountains associated with Lake Winooski. Whereas the latter are too small to be shown on the above map, the ochre colored pattern is added to depict the Connecticut Basin Disconnections associated the recession of the parent ice sheet in the Champlain and Memphremagog Basins across cols on physiographic divides.
- Separation of a residual active ice mass portion of the ice sheet in the northern Appalachians as marked by blue colored arrows, as reported by Quebec researchers.
The point of this schematic is to suggest that further study aimed at bringing these pieces together likely will paint a regional story as both an intriguing academic matter of deglacial history and as well Glacial Dynamics with considerable relevance to modern day global warming concerns. To that end the Vermont story likely serves as a central keystone for this story which until now has been missing. From my perspective this synthesis is best done by collaboration of researchers from New York, Quebec, and Vermont.
The following regional map shows relevant regional information for the Champlain lobe, including neighboring portions of New York and Quebec, again as discussed in detail below:
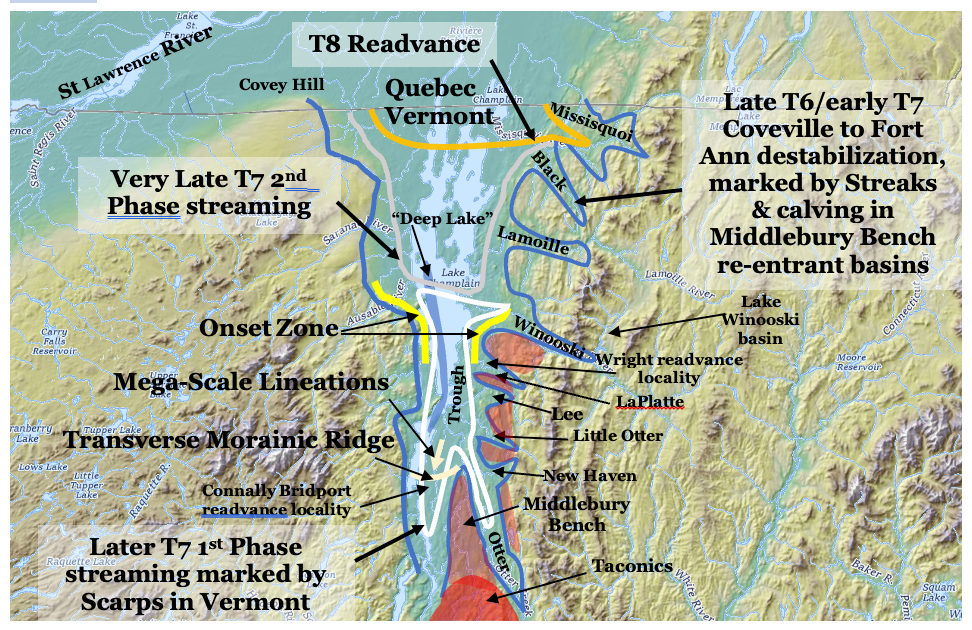
This map presents information which is helpful as a background context for the following Addendum discussion, even though these details are again discussed below.
- The nose of the Taconics at the southern end of the Champlain Basin is depicted by dark red shading, which separates the southern Basin into two portions, including the Vermont Valley to the east and the main Basin floor to the west along the New York border.
- The major tributary Champlain Basins specifically include the Missisquoi, Lamoille, Winooski, and Otter Creek basins.
- The Middlebury Bench is marked by lighter red shading. This is a slightly raised, uneven portion of the Champlain Basin floor, lying west of the higher Green Mountain foothills, and traversed by smaller tributary re-entrant basins including the LaPlatte, Lewis, Lee, Little Otter, and New Haven Basins. Otter Creek Basin, which again is one of the major drainage basins. Otter Creek traverses the Middlebury Bench as a re-entrant basin, which differs from the others by its more north-south orientation. This orientation made the Otter Creek basin more favorable for the Champlain lobe as compared to other Middlebury Bench re-entrant basins.
- West of the Middlebury Bench is the “Trough,” a lower, flatter portion of the Basin floor.
- The “Deep Lake” is a long narrow physiological , “over-deepened“ trench in the floor of Lake Champlain, mostly on the New York side of the Lake.
- In the interior upland of the Lamoille and Winooski Basins is a low area which was occupied by proglacial Lake Winooski and its successor Lakes Mansfield I and II, as reported by others.
- Covey Hill is a northward projection of upland terrain in northeastern New York and southern Quebec.
- North of Vermont is the St Lawrence lowland in Quebec.
- The dark blue line on the above map approximately (meaning schematically and not precisely) marks the late T6 and early T7 margin, and as well marks the Fort Ann strandline. This late T6 and early T7 margin represents the ice margin position at the time of the lowering of Lake Vermont from the Coveville to the Fort Ann levels. This margin is marked by many, diverse types of ice margin features including many substantial stagnant ice deposits, kame deltas, and other features as identified in the pre-Addendum study. It is also marked by many “Streaks.” These are numerous, distinctive LiDAR linears (not individually shown on the above map) identified in this Addendum study and discussed in detail below. Significantly, Streaks are interpreted as having formed by destabilization of the Champlain lobe caused by the lowering of Lake Vermont to the Fort Ann level.
- As found in the pre-Addendum study the frontal tips of long, narrow ice masses in the re-entrant basins within the Middlebury Bench receded downgradient in ensuing T7 time by calving. This calving was part of the destabilization of the Champlain lobe caused by the Coveville to Fort Ann lowering. These calving margins are marked by Headless Deltas, Ribbed Lacustrine deposits, and Thickened Bouldery Lacustrine deposits, which were identified in the pre-Addendum report. At the same T7 time, the Middlebury Bench between the re-entrant basins was still ice covered by the Champlain lobe, and provided buttressing support for the lobe, including by its raised physiography and as well by its relatively durable dolostone bedrock as compared to the lower, smoother topography underlain by shales in the Trough.
- The white line on the above map demarcates the later T7 ice margin when the Champlain lobe had receded from the Middlebury Bench, still in Fort Ann time, with the ice margin now along the Trough margin. With the lobe now free and clear of the Middlebury Bench, buttressing support was lost, causing a second destabilization of the Champlain lobe, triggering its streaming, with a continuing calving margin. The margin of the Champlain lobe at this later T7 and Fort Ann time is marked by the lowest Ribbed Lacustrine deposits in the re-entrant basins, and more significantly by numerous “Scarps” (also not shown on the above map), which are a distinctive type of linears identified on LiDAR in this Addendum study and discussed in detail below. Scarps are interpreted as representing the lateral shear margin of the Champlain lobe ice stream in the Trough.
- The dotted pale-yellow line represents the position of a Transverse Morainic Ridge near Addison which represents a paused T7 position of the grounding line for the receding calving ice shelf associated with this ice stream.
- The solid bright yellow lines mark pivot points and an Onset Zone for the Champlain lobe ice stream in late T7 time as discussed below. Interestingly, this Onset Zone is evident in two-dimensional plan view as a narrowing of the Basin floor, but is als0 marked in the vertical, third dimension by the “Deep Lake” floor of the basin, as evident on bathymetric maps, and interpreted as having formed by “overdeepening,” perhaps by multiple glaciations. Interestingly, this three-dimensional configuration with associated ice streaming closely and remarkably resembles the physiography and ice streaming history in the Finger Lakes region and the Ontario Basin more generally as reported in the literature.
- Significantly, Scarps are found predominantly in the southern and central Champlain Basin, southward from the Onset Zone, but are largely absent north of Onset Zone. Detailed Addendum mapping of Scarps shows the ice margin of the Champlain lobe ice stream, as marked by Scarps, extended across the mouth of the Winooski, and continued northward a short distance into the Colchester area. However, only a few possible Scarps are found further north, and the validity of these is uncertain. This paucity or absence of Scarps in the northern Champlain Basin is interpreted as indicating more rapid streaming recession of the Champlain lobe, possibly indicating its “collapse(?).” This accelerated recession is regarded as having been caused by the loss of buttressing support by recession of the ice from the Onset and by the lowering of Lake Vermont from the Fort Ann to the Champlain Sea, as further buttressing support loss contributing to destabilization.
- As reported by others, the incursion of the Champlain Sea into Vermont was both sudden and involved a substantial water level lowering. The position of the ice margin at this time generally is not marked and is largely unknown, but is marked by erosional grooves on the Onset Zone at the northern end of the Scarp defined margin, consistent with Glacial Dynamics associated with accelerated streaming as reported elsewhere as for example in the Ontario Basin.
- Further, the evidence indicates that Fort Ann waters extended and progressed northward in late T7 time along a long and narrow, “Disaggregated” margin along the eastern margin of the Lobe, as identified in the pre- Addendum study and discussed in the preceding. It is possible and seems likely that the northward penetration of this corridor persisted in conjunction with the recession of the streaming and calving Champlain lobe tip, extending into Quebec, leading to the opening of the Basin for the Champlain Sea. As noted above, Brouard (2026, personal communication) believes that it is possible that the opening of the St Lawrence for the draining of Fort Ann Lake Vermont and incursion of Champlain Sea waters into the Champlain Basin may have been along such a long, narrow open water corridor.
- Also shown on the above map by the orange-colored line is the ice margin representing the readvance of the Champlain lobe in the Missisquoi Basin in T8 and Champlain Sea time. This is based on the evidence previously reported by Cannon (1964) and Wagner (1972), indicating a readvance specifically in and now believed to have been restricted to the Missisquoi Basin after the incursion of the Champlain Sea into the Champlain Basin. The extent of the recession of the ice margin prior to the readvance is not known, but the readvance may have been minor. The exact position of the T8 margin in the Missisquoi Basin is uncertain but is inferred by the readvance evidence, by remarkably fresh-looking, bouldery ground moraine, and by the absence of Fort Ann deltaic deposits on the north flank of the Missisquoi Basin, presumably owing to their being overrun or somehow blocked by the T8 readvance. It is possible that the readvance may have re-established a higher freshwater strandline in the Basin.
- And also shown on the above map are the locations of the Connally and Wright readvance localities which were previously correlated with the T8 readvance evidence, resulting in my previous interpretation of a long convex Champlain lobe in T8 time. However, I would emphasize that the finding of a long convex lobe in T8 time, prior to the Addendum study, was based on multiple lines of evidence, and not just the Wrigh and Connally advance localities. Again, it is this long, late Champlain lobe which served as the impetus for the Addendum study. The Connally and Wright readvance evidence is now interpreted as representing the lateral shear margin of the streaming Champlain lobe in late T7 time. Accordingly, based on the Addendum evidence, the Champlain lobe is now believed to have extended as a long convex ice mass southward in the Champlain Basin in T7 and Fort Ann time, but rapidly receded in T7 time, thus resolving the initial conundrum which prompted this Addendum study.
- Of course, all of the margins shown on the above map beyond Vermont, in New York and Quebec, are uncertain and not documented by this study. However, the regional implications for the late T7 and T8 margins, including in Vermont, New York, and Quebec, as just described in partnership with the Ontario lobe and the St Lawrence lobe for the last days of the Champlain lobe, are especially intriguing, as suggested schematically or pictorially on the following map, which again is discussed further in more detail below:
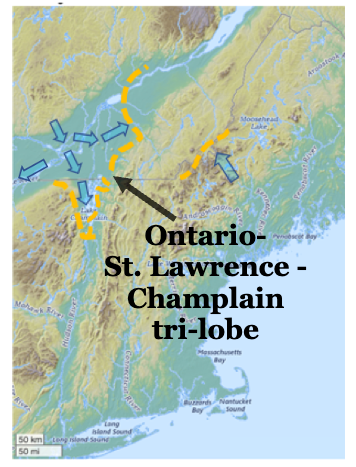
This map is intended to conceptually depict a late stage of the tripart Champlain, Ontario, and St Lawrence lobes. immediately before its demise, possibly by a collapse(?) in late T7 and Fort Ann time. Of course, this depiction and the possible collapse(?) of this ice mass are speculative, but are consistent with and suggested by the Addendum findings and represent an intriguing new paradigm for Vermont and regional deglacial history, again underscoring the importance of deglacial history, Styles, and Glacial Dynamics, not just for this last phase of deglacial history but as well for the entire recessional history of Vermont. Again, all of this has obvious relevance to modern day concerns about global warming, as discussed in more detail below.