The T5 margin is not marked on a State-wide map for presentation here but was intermediate between T4 and T6 times. T6 time ice coverage is shown on the following map by the violet color:
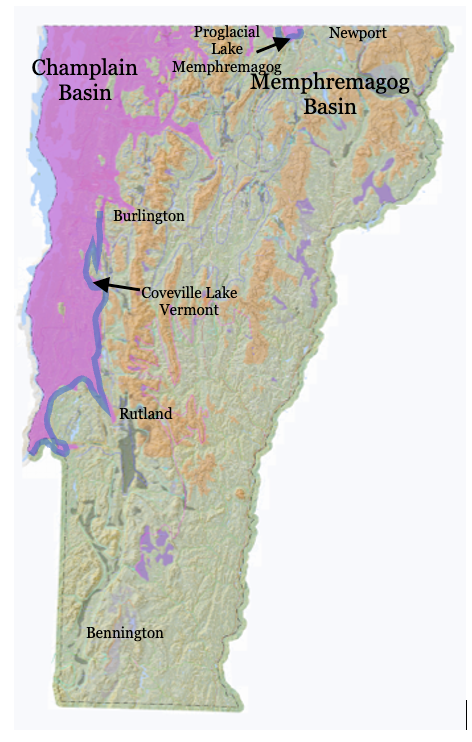
As can be seen the Memphremagog Basin was mostly ice free at this time except for a small ice mass in the Newport area. The evidence indicates the progressive step-down recession of the Memphremagog lobe in late T3-T6 times, leading to the demise of the Memphremagog lobe in Vermont in T6 time. This step-down recession reflects progressive warming of the ice sheet and increasing volumes of ponded and running meltwater along ice margins, and again represents a Glacial Dynamic between the ice sheet and standing water along the ice margins. The T6 margin in the Newport area includes many deep kettle holes interspersed with kame deltas associated with proglacial Lake Memphremagog, as a “Disaggregated” type margin (as shown on the above map by the blue shading), again an indicator of a Glacial Dynamic.
Brouard (2026, personal communication) and his colleagues have identified evidence of a readvance in Quebec (their “Memphremagog Readvance”) with its margin extending into Vermont in the Newport area. The Newport area was previously studied in detail by Wright, who reported no evidence of a readvance. It is suggested alternatively that the “Memphremagog Readvance” may correlate with the WMMS readvance in late T3 and early T4 time, as just described in the preceding, but this needs further study.
A similar step-down recession occurred in the Champlain Basin leading to T6 time. In the Vermont Valley in southwestern Vermont numerous ice margin features, including Ice Margin Channels and stagnant ice deposits, mark the late T3-T6 recession in the Lobate Phase of both the lateral margins and frontal tip of a lobe in this Valley from the Bennington to Rutland areas, including an almost continuous, very substantial esker on the floor of the Valley indicative of meltwater drainage associated with recession of a warm, stagnant ice margin.
In T6 time these stagnant ice deposits include a succession of progressively lower kame deltas in the Proctor area, just north of Rutland, leading to the development of Coveville Lake Vermont, as the first regional water body along the margin of the Champlain lobe. As shown on the above map, Coveville waters occupied a narrow, more or less open water “Disaggregated” corridor which extended northward from New York in the main basin floor as marked by numerous substantial kame deltas, around the northern flank of the Taconics to the Rutland (Proctor) area. This Coveville corridor then extended progressively northward in T6 time along the eastern margin of the Champlain lobe in the Green Mountain foothills to the vicinity of Burlington and the Winooski Basin.
As discussed previously, the development of such corridors was a significant part of the step-down recession of the eastern margin of the Champlain lobe. Ice Marginal Chanels and Bedrock Grooves mark the progressive step-down recession of the active ice margin, along with associated stagnant ice deposits, together marking the recession of Hybrid margins. “Disaggregated” ice margin corridors represent a significant Glacial Dynamic for the Champlain lobe owing first to the ability of standing water to penetrate northward along its ice margin, resulting in the increasing convexity of the lobe, and second by the destabilization of the Champlain lobe associated with the sudden and substantial lowering of water levels for regional water bodies at different times.
In late T6 and early T7 time Lake Vermont lowered from the Coveville to the Fort Ann levels, as an externality associated with its outlet channel. This lowering resulted in destabilization of the entire Champlain lobe as marked by numerous Streaks which are mapped widely across the Basin, as discussed above. Also as discussed, this destabilization was associated with the transformation of the eastern margin of the Champlain lobe from a lateral type toward a frontal type ice margin. And further, as discussed above and depicted on a map below, this destabilization led to calving of narrow ice masses in the re-entrant basins in the Middlebury Bench in early T7 time. Again, such destabilization represents a Glacial Dynamic showing the close interaction between the ice sheet and water levels along its margin. The step-down sequence and corridor development speaks to the effectiveness of thermodynamic transfer of heat between solid ice and liquid water in Glacial Dynamics, with the development of narrow, more or less open “Disaggregated” ice-water margin corridors which penetrated along ice margins (such corridors thus represent a Glacial Dynamic).