Whereas Streaks are identified throughout the Champlain Basin, these features could not be identified via field examination. In contrast, field study provided substantial information about Scarps, Transverse Morainic Ridges, and Mega-Scale Lineations, all in the southern and central portions of the Champlain Basin, and all associated with T7 and Fort Ann time.The following looks at how this information fits together, providing a new insight about the Champlain lobe late deglacial history.
The map below shows the locations of Scarps in the southern and central Champlain Basin:
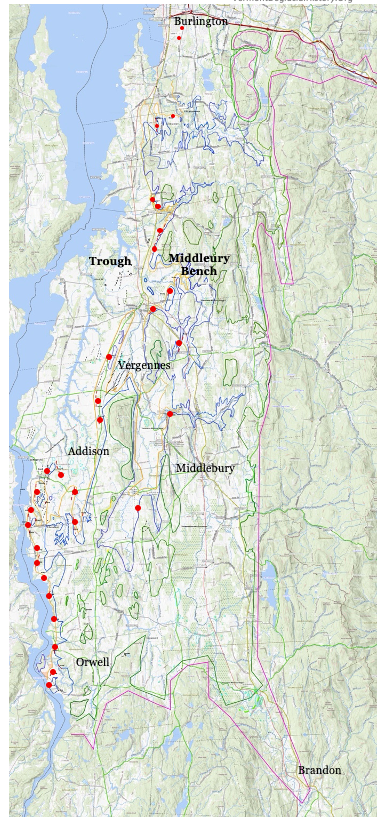
Scarps, marked by the red dots, are interpreted as marking the lateral shear margin of the first phase of streaming of the Champlain lobe in late T7 and Fort Ann time. It needs to be remembered that the T7 ice margin receded significantly in Fort Ann time. The lowering from Coveville to Fort Ann took place in late T6 and early T7 time. This lowering is marked by Ribbed Lacustrine, Headless Delta, and Thickened Bouldery Lacustrine deposits in the re-entrant basins in the Middlebury Bench, associated with calving in these basins. These calving ice margins receded downgradient in T7 and Fort Ann time, reaching the edge of the Trough in later T7 time, when loss of buttressing support provided by the Bench triggered the first phase of ice streaming of the Champlain lobe, with the head of this streaming at an Onset Zone in the Shelburne-Burlington area, in the northern portion of the above map.
The above map depicts the T6 (violet color) and early T7 (green color) ice margins. The transition from Coveville to Fort Ann took place when the ice margin stood along these ice margins, with subsequent calving recession progressing to the Trough margin as marked by the blue colored line on the above map, still in Fort Ann and T7 time. The blue colored line on the above map marks the Trough margin, and the Scarps trace the base of the Scarps along the lateral shear margin of the first stage of streaming of the Champlain lobe. The base of the Scarps is everywhere close to but slightly higher than the Champlain Sea marine limit as marked by the orange line.
The Late T6/Early T7 and Late T7 ice margins are accurately and carefully drawn based on VCGI mapping, but the T6 margin on the above map is drawn approximately and schematically. Not shown is the T8 margin, because, as already indicated, this margin is now believed to be restricted to the Missisquoi Basin, far to the north of this map area.
Scarps document the Lateral Shear Margins of the first phase of a long streaming convex Champlain lobe in late T7 time, along the eastern margin of the Trough, accounting for the “readvance” evidence reported by Connally and Wright. This readvance evidence is here interpreted as associated with the lateral shear margin of the streaming Champlain lobe. Thus, this finding dispelled key evidence suggesting a readvance of a long convex lobe in T8 time. The T8 time ice margin is now believed to have been restricted to the Missisquoi Basin.
Scarps have the following characteristics:
- The topographic benches associated with Scarps generally have a veneer of fine-grained lacustrine sediment cover overlying Ribbed Lacustrine benches, but in many cases the evidence indicating that these formed as Ribbed Lacustrine deposits with underlying stagnant ice sand and gravel is not evident.
- Further, Scarps tend to be associated with till characterized by an abundance of rounded, pebble size stones. This till is believed to have formed by the shearing of fluvial gravel material into till along the streaming margin. Erratics on the land surface in many places at Scarps include rounded stones, and in some places till exposures show a characteristic till with many rounded pebbles, representing the shearing of fluvial material into the till along the Scarp.
- Scarps tend to be associated with shallow bedrock, and in some cases are marked by bedrock cliffs, clearly indicating an erosive regime associated with Scarp formation.
- In plan view, as shown on the above map, Scarps delineate the margin of the first
- Phase of streaming of the Champlain lobe, with remarkable definition, along the Trough margin in close correspondence with physiography.
- The northern-most Scarps in the Shelburne-Burlington area, immediately south of the mouth of the Winooski Basin,are interpreted as marking the Onset Zone for the streaming Champlain lobe to the south. This Zone is thought of as marking a neck-like narrowing of the terrain, analogous to a dam-like restriction of the ice sheet, whereby the dammed ice was forced to accelerate through the Onset Zone.
- The association of the thalweg of the “Deep Lake” portion of the Champlain Basin floor is likewise believed to be related to the Onset Zone. This narrow, long “Deep Lake” tract is believed to have been associated with the Onset Zone and formed by this ice streaming, but possibly as well was formed by multiple glaciations as discussed below in regard to Paul Bierman’s work and research in the western Ontario Basin which suggests that such narrow basins may represent the cumulative result of multiple Pleistocene glaciations. Thus, this first phase of Champlain lobe streaming as here marked by Scarps may have been favored by a pre-existing Onset Zone.
- As described above, a close examination of a Scarp in the Onset Zone in the Shelburne vicinity shows a series of parallel, groove-like curvilinears in an indentation in the terrain underlain by shale between two topographic protuberances formed by dolostone and quartzite. The curvilinears represent erosion of the softer shales in the indentation, showing the recessional ice sheet surface lowering associated with the Fort Ann to Champlain Sea level transition, associated with the triggering of the second phase of accelerated streaming.
The red dots markings at Scarps on the above map show the locations of Scarps, and give a sense of their abundance and distribution, basically at the western margin of the Middlebury Bench, along the Trough margin. (Maps presented below more clearly depict the physiography of the Middlebury Bench and Trough.) The Scarps on the above maps are linear features as traced by red lines, which are not readily discernible at this scale. The red dots on the above map were added to make the distribution of Scarps more apparent. Most Scarps are less than 1 mile (1.6 km) in length, but several have been traced for lengths of 3 – 5 miles (4.8 – 8 km). As designated on this map, the red lines and dots mark the base of the Scarps, which indicates the base of the lateral shear margin. Scarp faces tend to be 50-75 feet high, with slope inclinations varying from gentle rises to cliffs, rising from Scarp bases to a Ribbed Lacustrine type of bench which formed along the sheer margin. Exposures along Scarps commonly show shallow to exposed bedrock, which is consistent with the interpretation of these as having formed by erosion along a lateral shear margin. Again, exposures commonly show a distinctive till, marked by numerous rounded pebbles, suggestive of shearing incorporation of basal gravels into a shear type till. The Scarps on the above map give a general sense of the associated lateral shear margin location, but the actual associated Champlain lobe ice margin is at the top of the bench, where evidence supports the presence of adjoining slower moving ice, again as reported in the literature for shear margins.
Further, a Transverse Morainic Ridge near Addison, delineated by faintly visible turquoise colored circular patterns on the above map, marking tops of nobs on this Ridge, and the Mega-Scale Lineations near Vergennes by dotted black lines, likewise add to the streaming evidence.
The above map is of interest in that it shows the mapping data which served as the basis for the ice streaming evidence in the southern and central Basin. Obviously, this map is difficult to read. The following map gives a clearer sense of the footprint of the late T7 streaming lobe, again confined to the Trough, as depicted by the blue shading.
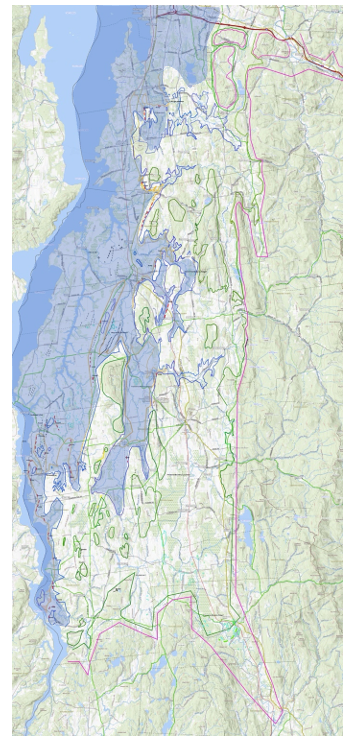
The following is a more pictorial map which was developed in order to more easily see the physiographic elements associated with the above described streaming:
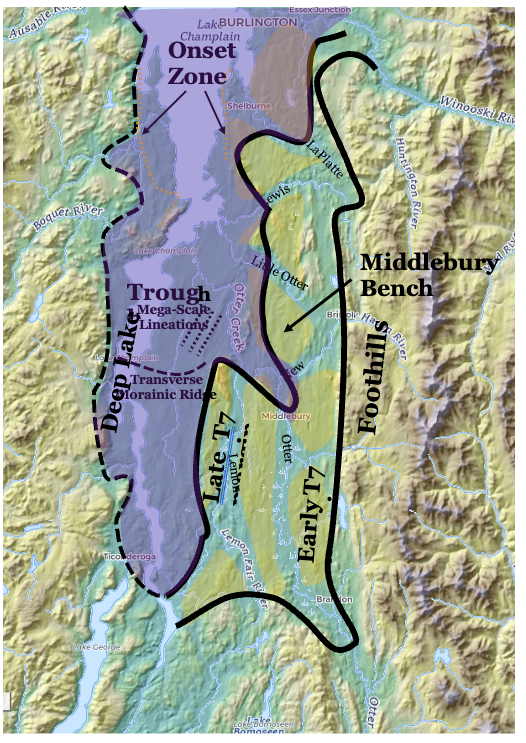
The base map for this regional perspective is a LiDAR based, shaded relief physi0graphic map. The pale olive-green areas demarcate portions of the Middlebury Bench, with intervening re-entrant basins. This Bench again is a slightly elevated portion of the Champlain Basin floor, which lies west of the Green Mountain Foothills and east of the Trough, a lower portion of the Floor. The early and later T7 margins are drawn schematically. The Early T7 margin represents the base of the step-down sequence of ice margins from T3 to T6 times, and marks the ice margin position associated with the Coveville to Fort Ann transition, triggering calving recession of the narrow ice masses in the re-entrant basins in the Bench, beginning in early T7 time, when the Champlain lobe still covered the Bench, thus serving as buttressing support for the lobe. The purple shaded area represents the active ice portion of the main mass of the Champlain lobe in Late T7 time, when the active ice Champlain lobe cleared the Bench, losing the buttressing support provided by the Bench, which triggered streaming as marked by Scarps, which are not shown on this map. The location of the Onset Zone is also marked.
The streaming Trough lobe was also calving, again as marked by specific calving related deposits, as described previously. The Transverse Morainic Ridge marks a grounding line for the Trough lobe calving, depicted by the dashed arcuate line, and the Mega-Scale Lineations mark streaming of this lobe as marked by the dotted lines.
The position of this late T7 streaming lobe in New York is uncertain, but is shown approximately as extending close to and along the Lake Fort Ann (Akawasasne) strandline. Whereas, as discussed above, the Champlain lobe became progressively destabilized with calving of multiple ice streams in the Middlebury Bench in Early T7 time, it is believed that the Lobe streaming began in later T7 time, with a calving frontal tip with the Transverse Morainic Ridge marking a grounding line of a temporary halt in the recession.
Of course, the focus here is on Vermont. Whether or not evidence fitting with the interpretations given here for Vermont may exist on the New York side of the Basin is unknown. Fundamentally, as can be seen, the terrain on the New York side of the Basin differs significantly from Vermont, in that Middlebury Bench and Trough type terrain, while present, is not so pronounced in New York. In addition, of course, as previously noted, the “Deep Lake” near the New York/Vermont border may have further served to cause differences in the deglacial histories between the two regions.
The Addendum study recognized and underscored the importance of Glacial Dynamics, meaning the physical interaction between the ice sheet, physiography, and meltwater, including standing water bodies, running water along the margin, and as well meltwater beneath the ice sheet at its base, both in dispersed form and in subglacial tunnels. The lowering of water levels from Coveville to Fort Ann levels in late T6 and early T7 time, which was both sudden and substantial, was an especially significant Dynamic, triggering the beginning of calving, for which the evidence, as discussed in my original, pre-Addendum report, is substantial. This evidence includes Headless delta, Ribbed Lacustrine, and Thickened bouldery lacustrine deposits in the heads of the re-entrant basins, as for example in the LaPLatte Basin near South Hinesburg and the Little Otter and New Haven basins near Bristol. Other important Glacial Dynamic changes likewise took place in late T6 and early T7 time, including the warming of the ice in the Champlain lobe from a “Cold” to “Warm” condition, the increasing production of meltwater along the margin and beneath the ice sheet, the progressive development of coalescing proglacial water bodies in a more or less narrow open water “Disaggregated” corridor along the eastern margin, the head of which rapidly progressed northward, in the process destabilizing the eastern margin of the Champlain lobe, transforming this margin from a lateral to a frontal margin. Also, the geologic substrate in the Trough is a relatively soft shale, which likely as well contributed to the streaming.
The map below was drawn to give a sense of estimated Champlain lobe ice flow directions in T7 time, as marked schematically by arrows:
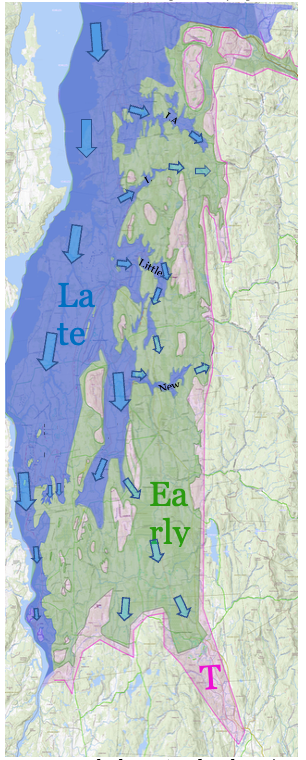
The green shading represents the late T6 and early T7 ice mass, and the blue shading the later T7 streaming ice mass.
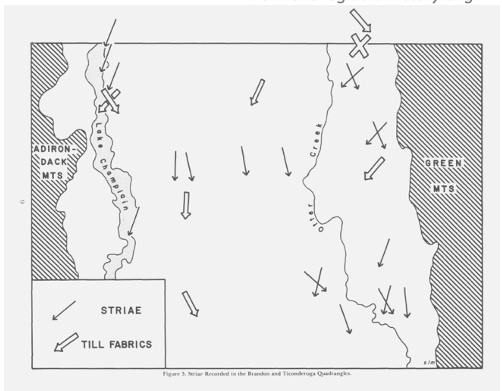
It is interesting that the configuration of the later T7 ice stream suggests predominantly southerly flow of the Champlain lobe, then mostly confined to the Trough. Whereas this VCGI study generally did not examine directional evidence such as from striations and till fabric, previous reports support such flow:
1 Stewart and MacClintock present striation and till fabric measurements in their State map, a portion of which is shown here:
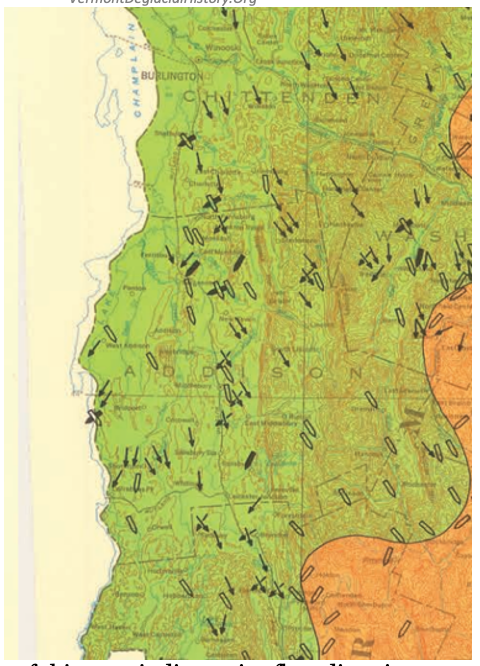
A close examination of this map indicates ice flow directions as expected and consistent with the deglacial history described here.
2 Wright in his Charlotte report stated, regarding striations (pp 9-10): “On outcrops where they have been preserved (most commonly on the sandstone members of the Monkton Formation), the common direction of glacial striations in Charlotte is approximately north–south (350 to 170). Elsewhere in the Champlain valley these N–S striations clearly cross-cut the NW–SE striations on outcrops where both sets of striations are preserved. The change in ice sheet flow direction most likely occurred when the ice sheet thinned sufficiently that its flow direction was constrained by topography, the north-south Champlain valley bounded to the west by the Adirondack Mountains and the east by the Green Mountains. Wright’s comments fit with the suggested streaming as discussed here.
3 Connally in his Brandon -Ticonderoga report shows striation directions (Figure 3), likewise consistent with streaming as suggested above:
4 Also, in a related vein, interestingly, Wright (2017) 1 Also, in a related vein, interestingly, Wright (2017) proposed ice streaming in the Champlain Basin in both Vermont and New York, based on his analysis of striations which indicate ice flow across the region at an earlier time, with later shift in ice flow directions so as to conform with the regional shape of the Basin. In my opinion, whereas striations provide interesting supporting information about flow directions showing that as deglaciation progressed and the ice sheet thinned, the flow tended to conform with physiography, in accordance with the Batth Tub Model, by itself such information does not establish ice streaming of the Champlain lobe. As discussed below, ice streaming is a distinct type of Glacial Dynamic which requires more specific study and documentation, such as given here. The same applies to the formation of till, as to when in glacial history till as ground moraine is formed, with the possibility as seems likely that different types of till are produced at different times by different Glacial Dynamics.