Warning: The following description of different calving ice margin features was written as part of my original report which was “completed” in January 2026. I subsequently added an Addendum, dated August 2026 in which I changed the historical interpretation significantly. However, while fundamental nature of calving ice margins given below has not changed, significant new information about destabilized ice margins and ice streaming features has been added in the Addendum.
a. Introduction – Previous Literature
This study did not begin with the expectation or intent of finding calving ice margins. In general, calving ice margins per se have not been mapped previously in Vermont, but previously published reports in the Champlain Basin both explicitly suggest the presence of calving and provide information compatible with calving. Evidence for calving in this basin was found in this present study, as discussed in the following, showing that calving of this Basin’s ice margin occurred at a late glacial time at certain specific locations and times, and played an important role in the lobe’s deglacial history.
As well, evidence in the Memphremagog Basin, specifically bouldery lacustrine silt-clay deposits, is suggestive of possible calving in that Basin. No such evidence was found in the Connecticut Basin. Further study of these basins in regard to calving is needed, although calving in the Connecticut Basin is unlikely owing to the en masse stagnation of the ice sheet in this Basin for much of its recessional history, the absence of reverse gradient conditions, and the relatively shallow depths of Lake Hitchcock.
The following is a review of previous reports which bear on calving of ice margins in Vermont. It is it is fair to say that it has been generally and widely presumed that calving took place in the Champlain Basin, simply as a consequence of the presence of major proglacial water bodies in the Champlain Basin associated with ice margin recession, which likely were relatively deep, sufficient to support calving.
The classic reference on proglacial water body history in the Champlain Basin is by Chapman, who stated: “as the ice front receded a body of water expanded northward in the valley so that the nose of the lobe was continually bathed in water.” This reflects the fact that the recession of the lobe in this basin was mostly down the regional physiographic gradient, in what today is referred to as a “reverse gradient” setting. Whereas Chapman’s work focused on the delineation of the strandlines of these proglacial water bodies, and not on associated ice margins per se, this simple statement has major implications. If the ice margin was “continuously bathed in water,” as Chapman noted, important questions are raised:
- Where were the progressive ice margin positions in relation to the proglacial lake sequence?
- How are these ice margins marked?
- What were the prevailing “Styles,” meaning the environmental conditions, at these ice margins?
- How did the ice sheet interact with the standing water, or in other words what were the associated “Glacial Dynamics,” including calving?
Chapman did not specifically address these issues but inferred ice margin positions for the receding ice margins for early and late Coveville, Fort Ann, and Champlain Sea times, based on his paradigm-ic conception about ice sheet recession, showing the progressive northward recession of ice margin positions in a schematic way, as shown by his illustrations below:
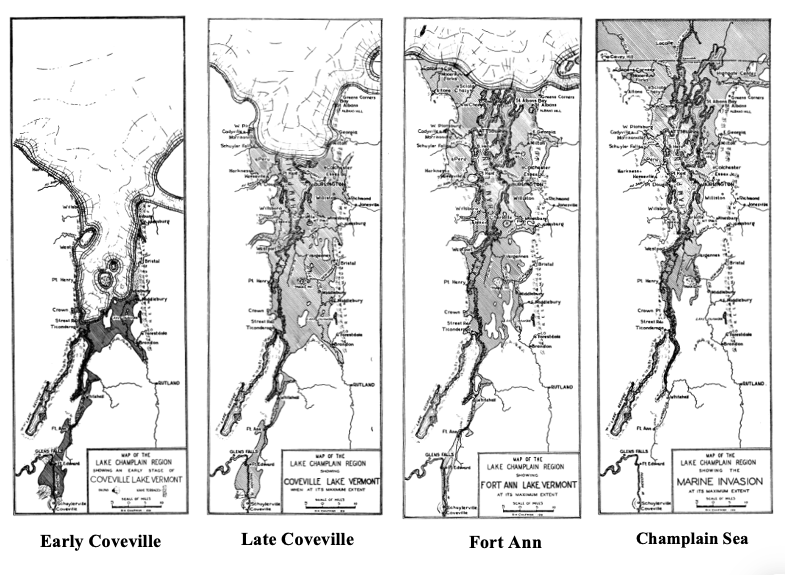
Without wanting to detract in any way from what was a major advance in our understanding of late glacial and especially proglacial Lake Vermont and Champlain Sea history it needs to be recognized that Chapman’s model was based primarily on strandlines, with little actual, documented basis for his positions of the associated receding ice margins. For example:
- His early Coveville ice margin position is schematic, based on his conceptual understanding that the early position of the ice margin was somewhere north of the Hudson/Champlain divide, but not on actual, specific ice margin features.
- His late Coveville ice margin position is based on his understanding of the northernmost Coveville strandline features, but again not based on actual documented ice margin features.
- Likewise, his Fort Ann ice margin is based on his view that the ice sheet remained in Vermont so as to block the Champlain Sea, not on specific ice margin features. In fact, the evidence presented here indicates that in Fort Ann time, this water body extended progressively northward in Fort Ann time along a narrow, more or less open water corridor into Quebec while the frontal tip remained far to the south, as a long convex Champlain lobe.
- And his Champlain Sea time shows the ice margin to the north beyond Vermont, which is based on his view that the Champlain Basin had become open and ice free at this time in order for the incursion of the Champlain Sea, his mental paradigm leading him to believe that therefore the ice margin must have been far removed to the north. However, again the opening of the basin for the incursion of the Champlain Sea likewise is instead here believed to have involved a corridor and more convex lobe.
As can be seen, Chapman’s illustrations depict a flattening of the receding lobe. Although not explicitly stated, this likely expresses his concept of calving of the lobe tip associated with recession. As described below, the evidence indicates that the recession involved calving, but as well ice streaming, with a more complex recessional history and recessional pattern than depicted by Chapman.
In essence, Chapman’s illustrations and accompanying discussion reflect and build a conceptual model, basically expressing Chapman’s mental picture depicting his understanding or concept of the progressive ice margin recession in the Champlain Basin. As noted elsewhere herein, this mental model represents a paradigm, and as such poses a “Paradigm Trap.”
The next major advance in our understanding of deglacial history and information relating to the calving of the receding ice margin after Chapman, albeit again not actual recessional ice margin positions, came from Stewart and MacClintock(1969). Of course, as already discussed previously, these authors had a very different paradigm model in mind about the nature of glaciation and its associated history, one based substantially on stratigraphic ice movement direction differences, not on the identification, correlation, and delineation of deglacial ice margin positions, including calving positions.
One consequence of their model was that they tended to regard vertical stratigraphic differences as indicative of changing ice sheet movement directions through time, again related to their paradigm about glacial history. For example, on page 111 of their report they refer to an exposure in the valley of Lewis Creek where varved lacustrine deposits are overlain by 20 feet(6 m) of glacial till, and another exposure along Little Otter Creek near New Haven where two layers of till are separated by 2 feet (0.6 m) of varved clay. They cite these observations as part of the evidence they use to build a model of glacial history related to three separate glaciations. However, as discussed below, Lewis Creek and Little Otter Creek near New Haven were important locations near Middlebury where the evidence indicates a calving ice margin, possibly explaining such stratigraphic differences in a very different, alternative paradigm way, by a mechanism related to local ice margin oscillations in a calving setting.
To their great credit, Stewart and MacClintock(1969) identified and mapped the presence of boulders and more generally stones of varying sizes and amounts in proglacial lacustrine and marine silt-clay deposits on the Champlain Basin floor. Such deposits have long been interpreted as indicating a calving ice margin, thought to represent iceberg droppings into proglacial lake or marine bottom sediment. S & M (pp. 160-166) specifically recognized and suggested the presence of calving ice margins in the Champlain Basin based on the bouldery nature of such deposits, although again they did not identify and delineate such margins at any specific locations or times. They refer to a” surprisingly large” abundance of stones in such sediments, so as to “resemble a till plain.” They refer to their State surficial geology map which shows the distribution of both bouldery and non-bouldery lacustrine and marine silt-clay deposits. 1 Based on comments by Connally(1970).who mapped the Brandon and Ticonderoga quadrangles, apparently as part of team the then concluding State surficial geologic mapping program, it appears that the bouldery nature of ponded water sediments was determined based on the observations of exposures, and the on the counting of boulders along the margins of farm fields. According to Stewart and MacClintock’s text and as shown on their map, the bouldery silt-clay deposits extend northward over a large area on the Champlain Basin floor, from the southern portion of the basin northward to the Canadian border, which implied to them that calving persisted as the ice sheet receded northward to and beyond the border.
Significantly, Stewart and MacClintock’s State surficial geology map indicates (though they did not so note or discuss in their report) that in the southern portion of the Champlain Basin, their bouldery silt-clay deposits tend to project southward, prong-like, on the basin floor. This prong is close to and predominantly below the Champlain Sea marine limit as depicted on Chapman’s maps, and likely represents mostly marine deposits. As discussed below this prong, along with other evidence, was initially interpreted here in this present report, as discussed in the deglacial history section below, as indicating the presence of ice far to the south in the Basin in Champlain Sea time, marking a long convex lobe at a late glacial time. Also as discussed below, discussions with David Franzi led to reexamination of this interpretation by a further, more detailed study focused specifically on this issue, showing that this interpretation is incorrect, as discussed in an Addendum to this report.
Part of the field work associated with the development of Stewart and MacClintock’s report and map was done by assistants, whose findings are available online as Vermont Geological Survey open-file reports. One of these is by Parker Calkin(1960s?) 2 Calkin, P.E.(undated) Surficial geology of the Middlebury 15’ quadrangle; VGS open file report VGS-1, 22 pages. This report is undated but believed to be in the 1960s. It is noted that Calkin was a friend and colleague. He became well-known for his research in Vermont, Alaska, and Antarctica. A glacier in Antarctica is named in his honor. He served as a professor at the State University of New York from 1965-1999. He died in 2017. His passing was of course a loss for his family and friends, but as well represents the loss of an opportunity for his personal input here, which no doubt could have been illuminating and helpful. who mapped the surficial geology of the Middlebury area. As mentioned above, and as discussed below, the “Middlebury Bench” area was especially important for the development of calving ice margins. Calkin’s report indicates:
- P 8: On the east side of Chipman Hill in Middlebury are ” kame gravels with sandwiched till lenses.” (This specific area and deposit are discussed further below in the section on VCGI findings, as part of the evidence identifying and delineating a calving ice margin.)
- P 13: He identified and studied boulder-rich lacustrine clays, stating: “More than half of the vertical cuts in the deposits show that the boulder clays are varved.” This statement was made to lend support to his view that calving in the Middlebury area was significant, and that such bouldery silt-clay deposits were in fact lacustrine, and not till. Calkin suggests two alternative modes of formation of the boulder-rich clays: 1) ice rafting, 2) overriding of lake clays by ice, as documented in places by varved lake clays overlain by till. 3 Calkin apparently regarded the presence of till overlying other surficial material in an exposure conceptually as an indication of an oscillation or readvance of the ice margin. It is noted here that till interbedded with lacustrine silt-clay is consistent with calving ice margins, and not necessarily an implication of a “readvance.” His overriding alternative presumably is meant to suggest a readvance, though he does not specifically so state. Importantly, he regards ice rafting as the dominant mode of formation, and not a readvance.
- Page 19: “The concept of an oscillating ice front may … account for the interbedding of tills and lacustrine deposits.” Calkin does not elaborate on the meaning and significance of this observation, but presumably by “oscillation” he meant a more local and momentary as opposed to larger and longer term “readvance” of the ice margin.
- P 21: “No moraines are evident in the Middlebury Quadrangle. Interbedded tills and lacustrine deposits suggest that there was probably an active and oscillating ice front in the Lowland area …” Again, this statement is taken as representing his opinion about ice margin conditions, which is entirely consistent with the findings here, as discussed below, that ice margins that developed in the Middlebury area and elsewhere nearby were active ice, calving, oscillatory, and destabilized in nature.
In general, as reported in modern literature, ice margin oscillations and calving both tend to be part of the same Glacial Dynamic 4 For example: 1) Benn, D.I., et al, 2007, Calving laws, sliding laws, and the stability of tidewater glaciers; Annals of Glaciology, V 46, pp 123-130; 2) Nick, F.M., et al., 2009, Large scale changes in Greenland outlet glacier dynamics triggered at the terminus., Nature Geoscience, V2, # 2, pp 110-114.; 3) Enderlin, E.M, et al, 2013, High sensitivity of tidewater outlet glacier dynamics to shape; The Cryosphere, V 7, #3, pp 1007-1015. and therefore stratigraphic and structural variations may be expected with calving. As just noted, Calkin believed that the evidence he found in the Middlebury area supported calving related oscillations and not an ice margin readvance. His report gives specific reference to numerous locations which document his findings and interpretations. Some of these have been independently field checked and verified as part of the present study, but most of his exposures are now slumped. As discussed below, VCGI mapping provides substantial evidence of calving in the “Middlebury Bench” in a manner consistent with Calkin’s report.
Continuing with the review of previous research in Vermont in chronologic order, in the late 1960s and early 1970s Wagner (i.e., me) mapped the area from the Quebec border southward to the Middlebury area (as published in various reports, but with the recessional ice margin evidence largely unpublished). This mapping showed textural, structural, and stratigraphic variations within glacial till and lacustrine deposits but these were interpreted simply as “normal” variations within such deposits. The presence of clasts within lacustrine deposits was recognized and noted, but a distinction between bouldery and non-bouldery deposits was not made. As noted above, my attempts to identify, delineate, and correlate specific ice margins of any kind, whether “normal” or calving, were unsuccessful. However, in the Missisquoi Basin, both silt-clay and till deposits were identified as a veneer on portions of Champlain Sea deltas, which was interpreted as clear and irrefutable evidence indicating a readvance of the ice margin. As noted above, mapping by Cannon (1964) as part of Stewart and MacClintock’s statewide mapping program also reported similar evidence in this area. Again, as discussed below, this evidence points to a readvance in the Missisquoi Basin after the Champlain Sea incursion. In this present report, this readvance in Champlain Sea time was correlated with the aforementioned tongue-like projection of bouldery marine silt and clay deposits, representing a long, convex late glacial Champlain lobe. Again, this interpretation was disproven by the subsequent Addendum study.
Connally (1970) 5 Connally, G. G.(1970), Surficial Geology of the Brandon-Ticonderoga 15 minute Quadrangles, Vermont; Vermont Geological Survey, Studies in Vermont Geology No 2, 32 p. mapped the Brandon-Ticonderoga Quadrangles, in the southern Champlain Basin in the vicinity of the aforementioned tongue-like projection of bouldery Champlain Sea marine silt-clay deposits mapped by Stewart and MacClintock. 6Whereas Connally refers to the bouldery silts and clays as being “lacustrine,” most of these deposits southwest of the Middlebury area lie below the Champlain Sea limit and thus likely are marine, with the limit of the bouldery silt-clays very closely corresponding with the Champlain Sea strandline. In fact, it is likely that it was Connally’s work as part of the S & M team that led to this portion of the map. Connally describes his identification of a different type of till in ground moraine on the Basin floor in this area, generally in the “lake shore province,” more specifically in the “Otter Creek province.” He describes glacial till in this area as being stony to bouldery with a sandy-loam matrix, as contrasted with till elsewhere which tends to have a clay-loam matrix. This till generally corresponds with the marine deposits. He identifies a locality near Bridport where he interprets the till as indicating that the ice sheet overrode “lacustrine” 7 Reference to this being “lacustrine” appears to be a generalization in as much as the Stewart and MacClintock map indicates that these silt and clay deposits are below the marine limit. sediment and redeposited the material in a “more or less undigested form.” And he reports two lines of evidence indicative to him of a readvance of the ice sheet:
- A pit exposure near West Bridport which he interprets as indicting that, “bouldery lacustrine clays have been badly contorted, suggesting overriding and incorporation at the base of a glacier.” His Plates 5 and 6 are photographs said to depict till overlying gravel which he interprets as outwash or lacustrine gravel, portions of which are incorporated as shear planes in the overlying till.
- “Ice- rafted boulders present in the lake clay,” generally southwest of Middlebury.
In essence, Connally is interpreting the evidence as indicating a readvance, which approximately corresponds with the marine bouldery silt-clay soils shown as the prong-like projection on Stewart and MacClintock’s map. Again, it is believed that Connally’s mapping was part of the Stewart and MacClintock Statewide mapping team, with his work responsible for this prong-like projection on the State map. As noted above, Connally describes a method of counting of boulders along tree lines as providing information for delineating bouldery-ness. In a later report, Connally and Cadwell 8 Connally, G.G. and Cadwell, D.H., 2002, Glacial Lak Albany in the Champlain Valley, in the field guide for the 71st Annual Reunion, Northeastern Friends of the Pleistocene guidebook, pp B81 – B817. further discuss this readvance evidence, making clear that in their opinion it represented a significant advance of the Champlain lobe following a prior recession. Whereas Connally’s evidence for such a readvance as a major historical event has been questioned by subsequent researchers, the photographs given in Connally’s report are impressive, clearly indicating significant shearing type Glacial Dynamics.
In this present, pre-Addendum report, Connally’s evidence for a readvance was correlated with the readvance evidence in the Missisquoi Basin, as part of the now disproven long lobe interpretation in Champlain Sea time.
Springston and DeSimone (2007) 9 Springston, G. and DeSimone, D.(2007) Surficial Geologic Map of the Town of Williston; Vermont Geological Survey Open File Report VG07-5. mapped the surficial geology of the Town of Williston, which is on the northern margin of the “Middlebury Bench.” This mapping was previously referred to as part of the discussion of Ice Tongue Grooves. So far as is known, no report accompanying this map is available. This map includes an area of stratified fluvial sand and gravel along Sucker Brook which is described as follows:
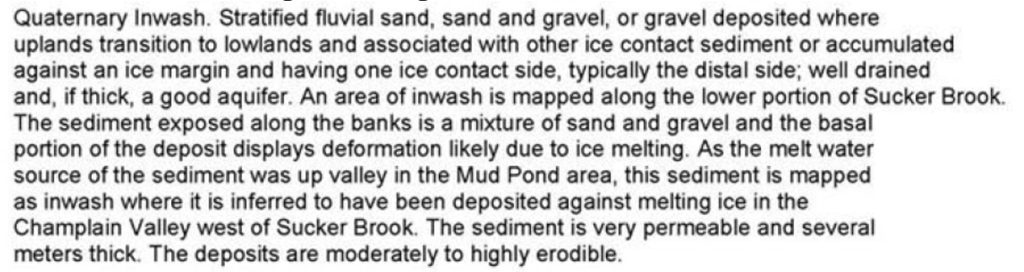
As discussed below, this deposit and an associated deposit further north on Sucker Brook at a higher elevation are here interpreted as kame delta deposits associated with the Coveville and Fort Ann levels related to the calving ice margin in the “Middlebury Bench” area, and the drainage of Lake Mansfield prior to the opening of the Winooski Basin for the invasion of Coveville and Fort Ann waters into the Winooski Basin. While the authors did not suggest calving, this description is included here as part of this review of previous work which is here regarded as supporting ice margin presence in close correspondence with standing waters, consistent with the calving story. Sucker Brook lies along the eastern margin of a small physiographic re-entrant which the evidence below indicates was occupied by a calving ice margin as a small appendage of the Winooski ice tongue. Springston and DeSimone’s mapping fits with and supports this interpretation.
Springston and Wright et al and Wright(2009 10Springston, G. and Wright, S., 2009, Open File Report VG09-6-Surficial Geologic Map of Charlotte, Vermont; VT Geol. Sur.. , 2010 11 Springston, G.. 2010, et al, 2010, Geology and Hydrogeology of Charlotte, Vermont, Vermont Geological Survey, Department of Environmental Conservation, 21 p. This report includes a separate Open File Report VG09-6: Surficial Geologic Map of Charlotte, Vermont, by Springston, G. and Wright, S. pp 16-19, and a separate repot Wright, S. F., Surficial geologic map of northern Charlotte, VT: Report submitted under contract to the VT Geol Sur, VT Dept Env Cons, 11 p. studied the nearby Charlotte area, which is close to and slightly north of Middlebury. The authors do not explicitly discuss calving but provide information which is here taken as related to calving. They recognized two different types of till, including a “readvance till” and a lodgment till. On p. 2 of the associated Wright report:
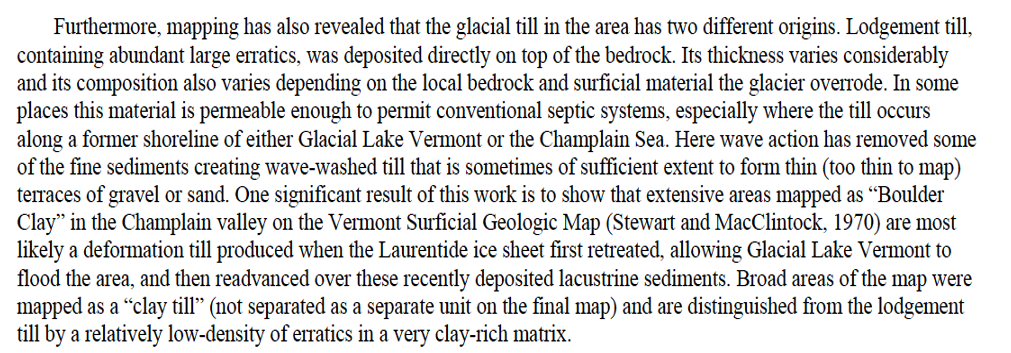
On page 6 of the Wright report:
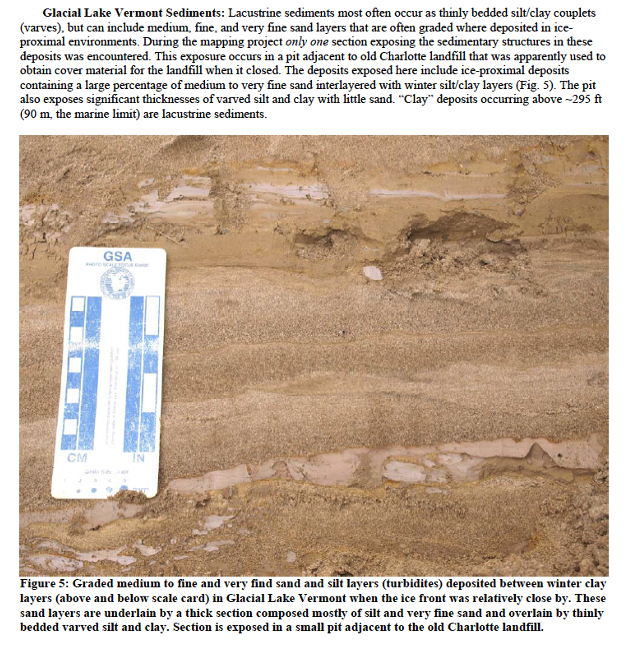
This note is presented here in regard to the reference to the proximity of the ice margin when these deposits formed.
On page 10 of the Wright report, the author depicts the photo below:
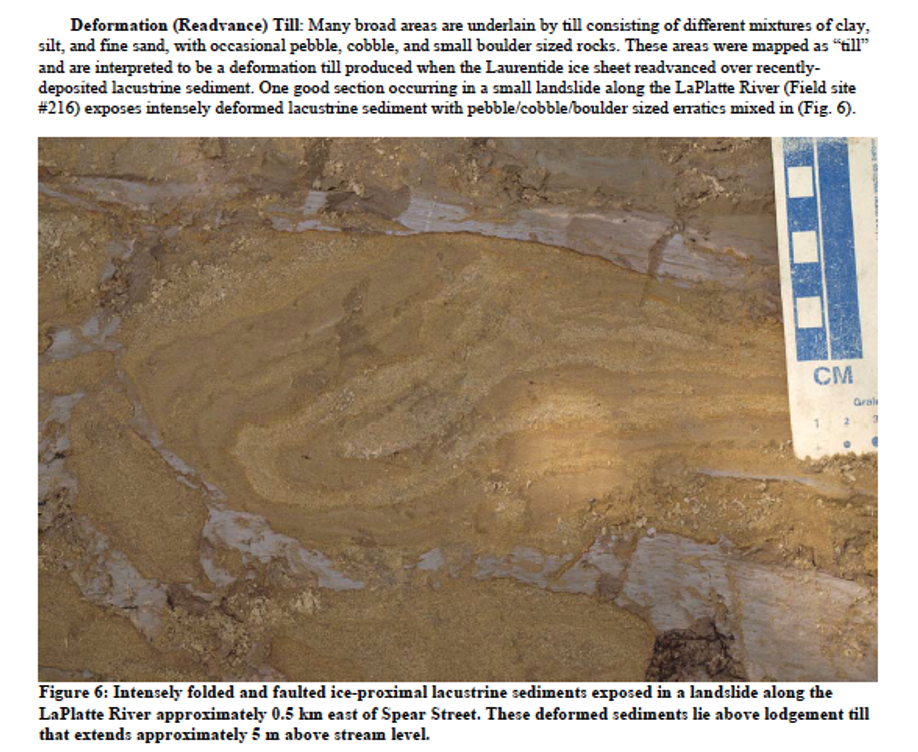
Wright makes the following statement:
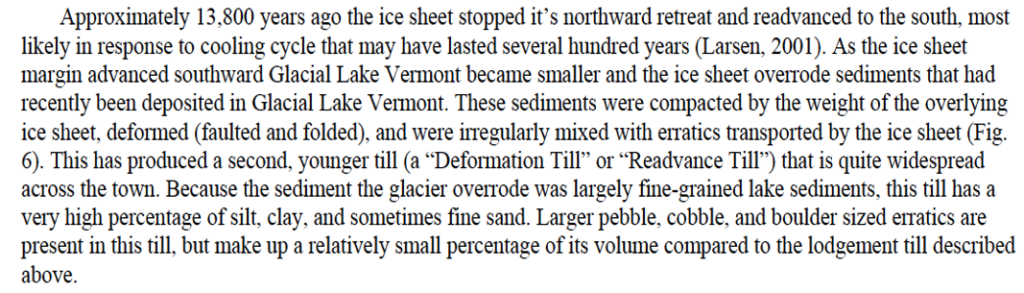
As discussed further below, Wright’s interpretation is believed to be generally correct, but fits as well with both ice margin oscillations and a readvance, though here believed to have occurred in Champlain Sea and not Lake Vermont time as part of the aforementioned long convex Champlain lobe. The type of evidence given by Wright, makes it difficult to distinguish between an ice margin readvance versus ice margin oscillations. However, the evidence presented here in this report from VCGI mapping indicates a correlation of the features described by Wright in the Charlotte area, including specifically along the LaPlatte River, with the evidence presented by Connally in the Bridport area and the evidence presented in the Missisquoi Basin by Cannon and Wagner, greatly strengthens Wright’s interpretation. It is believed that the ice margin readvance was oscillatory in nature during the ice margin recession and/or readvance. Further, Wright correlates this readvance with evidence reported by him and his colleagues in the Winooski Basin, which in turn may be correlated with a readvance associated with the White Mountain Moraine System (WMMS) in New Hampshire. However, the Winooski and WMMS readvances are here believed to have occurred at a previous time, before the readvance associated with the Champlain Sea time features.
On page 11 of the Wright report it is stated that the Champlain Sea limit in the Charlotte area is at an elevation of approximately 295 feet(90 m) which is close to the elevation of his deformation exposure on the LaPlatte near Spear Street, and that, based on soil cores obtained from the Winooski area, the approximate 100 meter drop of water levels from Lake Vermont to Champlain Sea was sudden. The significance of both of these observations relative to the issues of interest here raises the thought that the magnitude and suddenness of the change from Lake Vermont to the Champlain Sea may have been a significant trigger for further ice margin destabilization by calving as a “Glacial Dynamic.”
On page 17 of the Springston and Wright report:
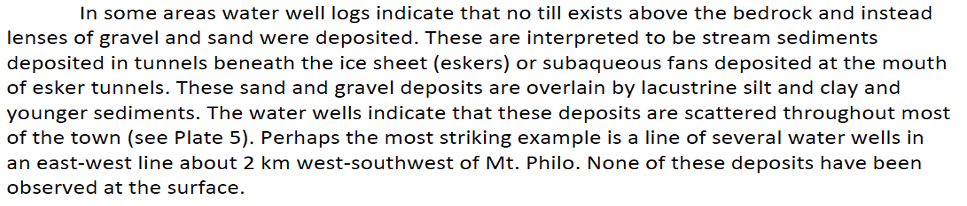
And on pages 10 – 20 of the Springston and Wright report:

In my opinion, the information cited above by Springston and Wright is consistent with and lends support to a calving ice margin with oscillations, but as with the Connally report the evidence does not preclude a readvance. The evidence described by Wight at the old Charlotte landfill and his readvance locality are both in close proximity to each other along the LaPlatte River, at an elevation close to the Champlain Sea level. These locations are close to a deposit interpreted by Stewart and MacClintock as kame terrace. An old, now mostly slumped gravel pit (at the LaBerge farm) in this “kame terrace” is presumed to have included evidence which led S & M to the kame terrace interpretation. Recent examination of remnant exposures at this pit, which is now mostly slumped, show a fine-grained silt-clay veneer and pockets of coarse gravel, possibly suggestive of or consistent with the close presence of ice.
In the deglacial history discussion below, the Wright “readvance” evidence is interpreted as marking the ice presence in Champlain Sea time, correlated with the Connally Bridport readvance evidence and with the Missisquoi Champlain Sea readvance evidence, again together indicating a long convex Champlain lobe in Champlain Sea and a late T8 time. The follow-up Addendum study disproves this interpretation and instead indicates that the Wright evidence along the LaPlatte and the Connally Bridport evidence instead formed along a lateral shear margin of the Champlain lobe as a streaming ice mass which likely was associated with calving in T7 and Fort Ann, not Champlain Sea, time.
Van Hoesen(2016) 12 Van Hoesen, J.G., 2016, Final Report Summarizing the Surficial Geology and Hydrogeology of Monkton, Vermont; Vermont Geological Survey Open File Report 2016-2, 36 p. studied the Monkton area which is southeast of Charlotte and northeast of Middlebury, in the “Middlebury Bench” area. Lacustrine deposits are described (page 21) as “well-sorted, well-stratified silt-clay deposits commonly forming distinctive topography in the valley bottoms.” (Underscore added to this quote.) Van Hoesen’s “distinctive topography” is regarded as significant. The author also notes that well logs indicate that sand and gravel deposits occur in some places below the lacustrine deposits. The meaning or significance of this “distinctive topography,” and the presence or absence of boulders in lacustrine deposits is not discussed, but is consistent with a calving ice margin, with such basal gravel deposits being commonly reported in the literature related to meltwater basal tunnel drainage at such margins.
In my mapping in the 1960s and 1970s I identified the same deposits with distinctive topography described by VanHoesen, and recognized the stagnant ice nature of the topography, but at that time I did not understand the origin and significance of such deposits. The evidence presented below indicates that these deposits were formed in conjunction with destabilization of the ice margin associated with the sudden and substantial lowering of proglacial water body levels, in this case Coveville to Fort Ann, with rapid recession of the ice margin allowing for the incursion of standing water where remnant stagnant ice masses still remained, by which these deposits formed with a stagnant ice core beneath a silt-clay veneer, with kamic stagnant ice topography. As discussed further below such deposits, termed “Ribbed Lacustrine” provide evidence in support of and indicative of calving ice margins.
The map below shows multiple ice margin positions extending across the Champlain Basin between Vermont and New York:
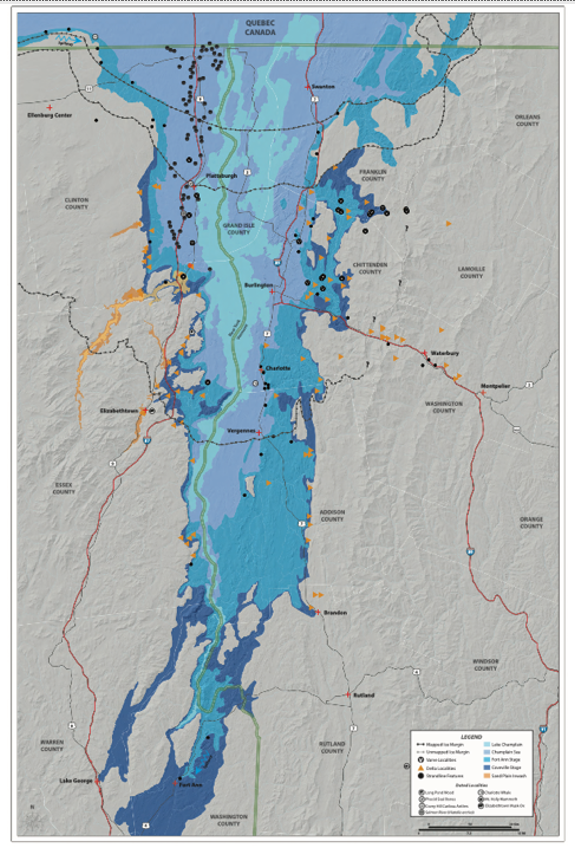
According to Franzi (2024, personal communication), who was one of the report co-authors, he believes that Champlain lobe ice margins in New York, which extend eastward across the basin floor, as for example shown on this map, likely were calving, based on the substantial water depth of Lake Vermont, which supports flattened margins as depicted on the Ode map. But Franzi indicates that the positions of calving ice margins as they cross the Basin floor from New York into Vermont, including positions in Vermont, have not been documented and were drawn schematically, as flattened lobe margins so as to suggest calving. In my opinion flattened ice margins such as depicted on the Ode map reflect a paradigmic calving model, again similar to Chapman’s interpretation which may or may not be correct and needs to be examined. Also, the Ode to Chapman map represents typical, conventional thinking about ice margins, as represented by simple lines on a map, suggesting margins cutting across terrain. This likewise represents a paradigm about the nature of ice margins as sharp lines on a map independent of the terrain. The evidence in this present report indicates such margins were much more complex, as for example as hybrid margins with both active ice and stagnant ice components, and were much more irregular, closely following terrain irregularities.
To summarize, the literature as reviewed in the preceding indicates that calving likely occurred and was associated with the ice margin oscillations, which are difficult to differentiate from readvance evidence. But, again, to date calving margins per se have been inferred but not actually mapped. As is well known, concern about global warming has spurred considerable present-day interest in ice shelves. Recent glaciology literature focuses on calving ice margins and their nature in regard to the global warming concern related to ice sheet melting and possible collapse. For example, in 2024 a research submarine explored conditions beneath the Antarctic’s Dotson Ice Shelf, penetrating about 17 kilometers beneath the ice shelf, showing a variety of never before seen ice margin features and conditions. 13 https://en.as.com/latest_news/advanced-submarine-makes-disturbing-discovery-in-unchartered-waters-then-suddenly-vanishes-n/https://jasondeegan.com/the-ran-submarine-lost-17km-deep-in-antarctic-ice-reveals-the-hidden-side-of-the-south-pole/ These included evidence of accelerated melting at the ice/land/water interface, including subglacial tunnels and widened vertical fractures(crevasses) in the bottom of the ice shelf, and a wide array of sedimentary deposits formed by flowing water at the ice/ponded water interface, as for example “fluvial” dune-like features. Unfortunately, contact with the sub was lost and the mission ended prematurely. Obviously, the sub-glacial calving environment is complex and as yet little understood. This environment is so difficult to study that present day glaciology literature tends to utilize mathematical modeling as a way of better understanding the mechanics of calving ice shelves. But modeling is limited by our imperfect and incomplete understanding, which is dangerous territory for modeling. In contrast, studies of past glaciation, such as in this case for Vermont, allow the examination of ice margin features across a much broader area, and at a fraction of the cost. Of course, both approaches together obviously provide the best information about calving margins.
Calving ice margins are extraordinarily complex and still not well understood. A complete and detailed review of recent glaciology literature on calving, which deals with both the disequilibrium physical dynamics of ice and water along ice sheet margins and as well different types of features found along such margins faced with such dynamics, is beyond the scope here.
In general, calving ice margins obviously and by definition form in close association with proglacial standing water bodies and tend to be oscillatory in nature, with temporal recessions and advances of the grounding line. As a consequence, features formed at calving ice margins show this close glacial and proglacial environmental setting relationship. Many reports indicate an interbedded mix of till, standing water deposits, and fluvial materials originating at meltwater outflows from the ice sheet, which is made more complex by oscillations of the margin, with a variety of geomorphic forms with diverse internal stratigraphic and structural complexities.
Some examples of the literature give a sense of calving ice margin features and evidence:
- As noted above, one of the earliest features reported in the older and now classical literature as being indicative of calving ice margins is ice rafted boulders in lacustrine sediments, such as described above for the “bouldery lacustrine (and marine)” deposits. Such deposits have long and routinely been interpreted as iceberg drop deposits. Thus, extensive and substantial bouldery lacustrine deposits likely indicate the presence of a calving ice margins. Other related features include grooves and mounds caused by iceberg ploughing along shallowing water margins.
- De Geer moraines, which are multiple moraine-like ridges, have similarly been long and classically recognized in conjunction with late Pleistocene coastal ice margins. Different theories have been advanced for their formation, as for example plowing of basin floor sediment by the ice sheet at the grounding line, or upward injection of sediment into basal crevasses.
- Powell 14 Powell, R.D., 1990, Glacimarine processes at grounding-line fans and their growth to ice contact deltas; Geol.Soc. London, Special Publications; pp. 53 – 69. identified alluvial fans and deltas as grounding line deposits formed by meltwater outflows at the base of the ice sheet at the mouths of calving ice margin tunnels. This is reminiscent of the descriptions given above from Vermont literature of gravel deposits beneath lacustrine deposits, and may as well be related to “Headless Delta” deposits as described below.
- Davies 15 https://www.antarcticglaciers.org/antarctica-2/west-antarctic-ice-sheet-2/marine-ice-sheets/https://www.antarcticglaciers.org/glacier-processes/grounding-lines/ described wedge-shaped deposits at grounding lines, and refers to reverse slope settings, meaning terrain beneath the ice sloping downward in the upgradient direction of the ice sheet, as was the case for the Champlain Basin. As Davies states: “The Marine Ice Sheet Instability hypothesis is that atmospheric and oceanic warming could result in increased melting and recession at the grounding line on a reverse slope gradient. This would result in the glacier becoming grounded in deeper water and a greater ice thickness. This is because the grounding line in this region has a reverse-bed gradient, becoming deeper inland. Stable grounding lines cannot be located on upward-sloping portions of seafloor. Ice thickness at the grounding line is a key factor in controlling flux across the grounding line, so thicker ice grounded in deeper water would result in floatation, basal melting, increased iceberg production, and further retreat within a positive feedback loop. This would result in a rapid melting …. Triggering rapid sea level rise…. Exacerbated by the removal of fringing ice shelves… buttressing ice shelves around ice streams tends to result in glacier acceleration, thinning, and grounding line migration.”
- Sutherland et al(2019) 16 Sutherland, J.L., et al 2019, Ice-contact proglacial lakes associated with the last glacial maximum across the southern Alps, New Zealand; Quaternary Science Reviews V 213, pp 67-92. Kai-Frederik Lenz et al,2024 17 https://www.sciencedirect.com/science/article/pii/S0025322724000331#bb0110 Lajeunesse et al,2024 18 https://search.app/jodn1KZComwfm79F6 and Batchelor and Dowdeswell(2024) 19 Batchelor, C.L. and Dowdeswell, J.A. 2024, Ice-sheet grounding zone wedges on high latitude continental margins; Marine Geology, V 363, pp 65-92. likewise describe deposits associated with calving ice margins and grounding lines, including “grounding zone wedges.”
- Orłowska 20 https://www.intechopen.com/online-first/1177395 refers to crevasse fill form involving upward injection of till into basal crevasses as ridges associated with surging ice streams.
- Linear features, termed “Mega-scale Lineations”(MSGLs) associated with ice streams at calving margins, have been identified, as for example by: Clark(1993) 21 Clark, C.D.,(1993) Megsa-scale glacial lineations and cross-cutting ice-flow landforms; Earth Surface Processes and Landforms; V 18, pp 1-29. Stokes and Clark(2001) 22 Stokes and Clark(2001) First formal definition and mapping of MSGLs; Earth Surface Processes and Landforms, V 18, #1, pp 1-29. King et al (2009) (23 King et al, 2009, Radar detection of active MSGLs under Antarctic Ice Streams; Nature Geoscience, V 2, pp 585-588, and Spagnolo et al(2004). 24 Spagnolo, et al, 2014, Global dataset analysis of MSGLs; Earth Surface Processes and Landforms, V 39, No 11, pp 1432-1448. Such features may correspond with “Ice Marginal Lines,” as identified by VCGI mapping and discussed subsequently below.
- Hudson et al, 2020 25 Hudson, T.S. Brisbourne, A.M., White, R.S., Kendall, J.M., Arthern, R. and Smith, A.M., 2020, Breaking the ice: Identifying Hydraulically Forced Crevassing, Geophysical Research Letters, Volume 47, Issue 21; https://agupubs.onlinelibrary.wiley.com/doi/full/10.1029/2020GL090597?utm_source=chatgpt.com, 9 p. suggest that: “Hydraulically forced crevassing is thought to reduce the stability of ice shelves and ice sheets, affecting structural integrity and providing pathways for surface meltwater to the bed. It can cause ice shelves to collapse…” Other reports likewise refer to “hydrofracture” as a mechanism causing crevasses to deepen and widen, in some cases to the base of the ice sheet, which then can lead to ice sheet destabilization and calving. This process is influenced or controlled by proglacial water levels which are hydrostatically related to the levels of free water within crevasses in the ice sheet margin. It is here believed that a) the water depths versus ice thickness of the ice sheet on the “Middlebury Bench,” at the time of the Coveville to Fort Ann transition relative to buoyancy, and b) the elevation of the Fort Ann level versus the elevation of the Bench, may have reached a critical point where hydrofracturing may have resulted in the full crevasse penetration of the ice sheet margin, resulting in the development of a destabilized calving ice shelf, with fractures at a receding grounding line or zone. Such events involved substantial water level changes and have been reported in the literature as having taken place suddenly.
b. Champlain Basin Micro-Physiography – the “Middlebury Bench,” “Basin Trough,” and “Deep Lake”
It is believed, based on the evidence, that calving of the Champlain lobe was closely related to the Basin physiography, including micro-physiographic details, and thus an understanding of this physiography is helpful as part of the deglacial history story, as discussed in the following. As stated previously in regard to physiography:
“As an important aside about physiography, as I was finishing the writing of this report I came to understand that physiography, including both at the macro and micro level, was critically important in regard to the ice sheet’s Glacial Dynamics, meaning the influence of major and micro physiography on the physics and behavior of the receding ice sheet and as well on the nature and configuration of its margins, including the development of proglacial water bodies along these margins. Glacial Dynamics are touched on in the following as part of the deglacial history story but my sense is that this is a larger story of crucial importance to modern day concerns about global warming, which is a subject deserving much more discussion, but to do so here and now would require a separate and substantial book in and of itself.”
This quote is restated here to underscore the importance of Glacial Dynamics, which is reflected by the following discussion about calving in the context of physiography. Likewise, this is an important part of the Addendum discussion which revised my understanding of calving, leading to the development of a very different story about Champlain lobe destabilization and streaming as part of its deglacial history, including calving. Whereas presenting the details of this Glacial Dynamic story here, as the importance of this subject deserves, would become overwhelmingly detailed, the following gives an overview of important Basin micro-physiography.
The Champlain Basin floor is low and relatively flat, but carefully examined can be seen to be uneven with significant physiographic differences which related to calving, especially in the Middlebury area. This physiography is depicted schematically on the map below which shows the Champlain Basin from the Burlington area southward to the Brandon area, including the Middlebury area:
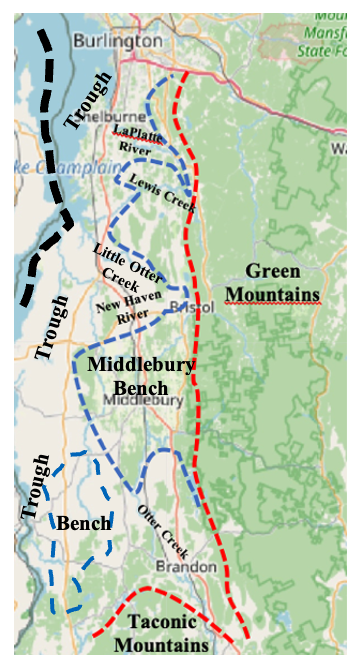
The red dashed lines mark the eastern and southern boundary of the basin floor, along the rise in the physiography associated with the foothills of the Green and Taconic Mountains. To the west and north of this line, very approximately, is the basin floor. The blue dashed line marks an approximate physiographic division of the basin floor into a relatively high portion here designated as the “Middelbury Bench,” with rolling, low knobby topography with elevations generally near 400-500 feet(122-152 m), as distinguished from the lower “Trough” portion, generally below these elevations. These are “local, ” not isostatically corrected elevations.
This physiographic division is very evident and familiar to local residents. For example, driving southward on Route 7 from Burlington to Middlebury the roadway is mostly on the Bench, and the lower Trough can be seen to the west at many locations, with a very distinctive and substantial drop-off. As will be shown below, the rise between the Bench and the Trough was a very important control on the receding Champlain lobe margin.
As can be seen, the Middlebury Bench itself is not physiographically uniform but is dissected by lower “re-entrant” basins associated with the drainage basins for Otter Creek, New Haven River, Little Otter Creek, Lewis Creek, and the LaPlatte River. These re-entrant basins are part of the caving story, with downgradient recessional calving along the frontal tips of narrow ice masses occupying the floors of the re-entrant basins while the Bench was still ice covered, providing buttressing support for the Champlain lobe. Recession of these calving tips and the larger Bench ice mass led to the loss of this buttressing support, resulting in ice streaming of the entire lobe.
More substantial, local upland nobs occur at the mouths of these re-entrant basins, including for example Snake Mountain, Buck Mountain, Shellhouse Mountain, Pease Mountain, and Mount Philo, none of which are identified on this map owing to scale limitations. These uplands became nunataks as the ice sheet level lowered and likewise became islands in Lake Vermont and the Champlain Sea when the margin receded. Physiographically, these nobs served as funnel-like openings of the re-entrants for ice stream pathways, as part of an “Onset Zone” for ice streaming, as discussed in the Addendum.
As can be seen, most of the re-entrant basins tend to extend westerly from the foothills, but the lower floor of the basin in the southern portion is bifurcated, around the nose of the Taconics, with one part associated with the main Basin floor extending southward into New York, and the other part associated with Otter Creek, as a substantial re-entrant basin. This directional difference with most re-entrants draining in a more westerly direction was important for the Champlain lobe recession, and the associated development of proglacial standing water bodies such as Lake Vermont. The orientation of these two bifurcated portions of the basin was relatively favorable for ice flow from the main body of the Laurentide ice sheet, with the frontal tip occupying these basins. This is in contrast to other re-entrant basins with a more east- west orientation, which required a deviation in ice flow direction from the parent ice sheet, leading to the eastern margin of the Champlain lobe. Importantly, the evidence reported here indicates that this eastern margin initially functioned as the “lateral” margin of the lobe, meaning in a Glacial Dynamic sense, but that as part of destabilizing events this margin transformed toward a frontal margin.
The “Trough” itself likewise is not flat and uniform, but can be physiographically divided into two portions. Whereas much of the floor of the Basin Trough is relatively flat, with topography ranging in elevation between about 100 to 300-400 feet (30 to 91-122 m), the floor of Lake Champlain itself includes a substantially deeper Basin floor, referred to colloquially by local residents as the so-called “Deep Lake,” with lake depths in excess of 300 feet (91 m) below the present day Lake Champlain level, which is at an elevation of about 100 feet (30 m) above sea level. As shown on the above map, the thalweg of this “Deep Lake” extends northward (from near Ticonderoga), generally along the New York and Vermont border, to the vicinity of the Champlain Islands (South Hero, Grand Isle, North Hero, and Isle LaMotte). The Deep Lake portion of the basin was inferred by me in the pre-Addendum report to have been associated with an initial phase of calving, mostly on the New York side of the Basin, at an early recessional time ( late T6 and Coveville time), but this interpretation was disproven by the Addendum study.
Further, as discussed below but not evident on the above map, the Trough is much wider in the northern part of the Basin, narrowing down substantially by the Middlebury Bench and corresponding uplands in New York. This narrowing is identified in the Addendum study as part of an Onset Zone for ice streaming. In general, as discussed below, the evidence indicates that as recession of the Champlain lobe proceeded this Trough physiography became very important for both calving and streaming.
c. Calving Ice Margin Feature Types
Three different types of deposits believed to be related to calving are recognized and mapped in the re-entrant basins of the Middlebury Bench. By way of background, as discussed in a subsequent section of this report, deglacial history is regarded as havig been a step-down type of recession of the ice margin, as is typical for reverse gradient settings such as in Vermont, marked by a close association between the ice margin and ponded water bodies in local drainage basins. As the ice margin receded new, lower spillways were opened resulting in the progressive coalescence and enlargement of these water bodies with time. In late T6 and early T7 time Coveville Lake Vermont developed in a narrow, more or less open water corridor along the ice margin as the first regional water body in the Champlain Basin, with its water level controlled by a spillway in the Glenns Falls area of New York.
Coveville is marked by numerous, substantial kame deltas formed along this ice margin. For example, a Coveville kame delta near Benson Landing marks the southern arm of Coveville Lake Vermont in the floor of the main Champlain Basin in Vermont. The Coveville strandline is traced northward around the nose of the Taconics to additional kame deltas at Proctor, near Rutland,at the mouth of the Vermont Valley, and thence northward at Brandon, Pittsford, East Middlebury, Bristol, and South Hinesburg, basically along the receding eastern margin of the Champlain lobe, along the foothills break with the eastern margin of the Middlebury Bench. The evidence indicates that Coveville developed and expanded progressively northward in a narrow, more or less open water corridor to the Burlington area, along a “Disaggregated” type of ice margin. This pattern accentuated the convexity of the Champlain lobe.
In T7 time, a new lower outlet for Lake Vermont opened as an “externality,” meaning not controlled by the ice sheet. This resulted in the lowering of Lake Vermont from the Coveville to the Fort Ann level. This lowering was sudden and substantial, resulting in the destabilization of the Champlain lobe as a major Glacial Dynamic. Evidence in the Addendum study indicates that this destabilization affected the entire Champlain lobe in Vermont as marked by features termed “Streaks.” Previous mapping prior to the Addendum identified evidence suggesting that this destabilization, again associated with the development of an open water corridor along the eastern margin of the Champlain lobe, likely was associated with the transformation of the eastern margin of the lobe from a lateral toward a frontal margin. Part of this interpretation comes from Ice Tongue Grooves, and as well is marked by changes in ice movement directions as marked by striations and other evidence. The evidence as discussed here indicates that this destabilization triggered calving, which began at the frontal tips of the ice masses occupying the long and narrow re-entrant basins of the Middlebury Bench, while the intervening areas of the Bench were still ice covered. These long and narrow ice masses resembled and functioned like ice streams, delivering sediment to the calving frontal tips, but it is not established that these masses represented true ice streaming.
In later T7 and Fort Ann time, recession of the frontal tips of these narrow ice masses reached the western margin of the Middlebury Bench. In the pre-Addendum study, it was thought that lowering of Fort Ann to the Champlain Sea occurred at this time, in conjunction with the readvance evidence reported by Connally in the Bridport area, by Wright in the Charlotte area, and by Wagner and Cannon in the Missisquoi area. This interpretation thus suggested a long convex Champlain lobe at a T8 late glacial and Champlain Sea time. The Addendum study indicated that whereas the Middlebury Bench prior to this time had provided buttressing support for the Champlain lobe, this was lost by further recession when the Middlebury Bench became ice free with the ice margin along the eastern margin of the Trough, still in late Fort Ann time, resulting in further destabilization associated with ice streaming leading to rapid recession of the lobe in T7 and Fort Ann time, again as discussed in the Addendum report. This Addendum thus disproved the long lobe theory.
This brief deglacial overview helps to set the stage for the following presentation of different types of calving ice margin features identified and mapped in this study.
Mapping in the Middlebury Bench has identified multiple deposits of bouldery silt and clay lacustrine material on the floors of the re-entrant basins, associated with remarkably flat terrain. Well logs indicate that these deposits are formed by unusually thick, bouldery lacustrine sediment. These flat deposits were first recognized by my mapping in the 1960s and 1970s, but the significance and meaning of these areas was not then understood. These deposits are here interpreted as formed by sediment supplied by, at, and near the receding calving margins of narrow ice masses in these re-entrant basins, while at the same time the higher terrain in the Middlebury Bench was still ice covered. Again, whereas these narrow masses resemble and are suggestive of “ice streams,” but whether or not they represent true ice streaming is uncertain. In any case, the thickened and bouldery character of these flat deposits is attributed to the delivery of more substantial material at the calving fronts of these “ice streams.” Further, such flat areas occur at multiple locations in individual re-entrant basins, suggesting that these deposits formed progressively along the receding calving ice margin tips, perhaps at or near receding grounding lines.
By way of illustrating such deposits, as is typical for all re-entrant basins, the following screen shot is from the VCGI Project Sheet map for the Hinesburg area in the LaPlatte re-entrant. This and neighboring areas are discussed in more detail for Locale W1 in Appendix B:
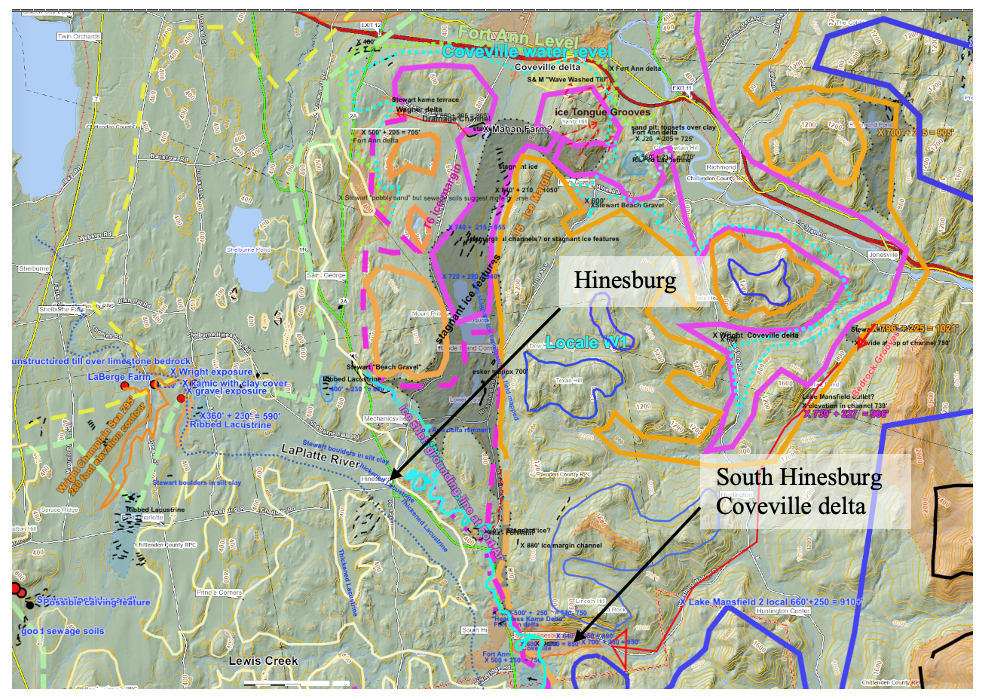
For locational reference, the village of Hinesburg is located in the north-central portion of the map. The LaPlatte River is marked by the dotted thin blue line. The yellow lines were added to indicate the 400 foot (122 m) contour to give a sense of the LaPlatte re-entrant basin shape, which is irregular but generally long and narrow as is typical for re-entrant basins, with low interfluves in this case connecting with the neighboring Lewis Creek re-entrant basin. The bright neon blue line traces a portion of the 500 foot (152 m) contour, which is close to the Fort Ann level. The T4, T5, and T6 ice margins are marked by the heavy blue, orange, and violet colored lines, respectively. A major, multi-tiered Gilbert type delta at South Hinesburg marks two upper local proglacial lakes and a more substantial third, Coveville level; a sprawling delta immediately to the west marks the Fort Ann level. Other features on this map are described in Locale W1.
Again, as just stated in the preceding, the sudden and substantial lowering of Lake Vermont from the Coveville to the Fort Ann level in late T6 and early T7 time resulted in destabilization that triggered calving, in this case of the LaPlatte re-entrant ice mass, with ice margin and calving features identified and mapped in the LaPlatte Basin, and other Middlebury Bench re-entrant basins.
Many locations along the LaPlatte Basin in this area are associated with multiple local, separate, Thickened, Bouldery, Lacustrine deposits and associated unusual flat-bottomed Basin floors, as marked on the above map. These deposits mark the progressive westward recession of the calving frontal tip of the narrow LaPlatte re-entrant ice mass. A similar, generally down-basin recession of the frontal tips of ice masses in all other re-entrant basins was identified by VCGI mapping. Again, lowering of Lake Vermont from the Coveville to Fort Ann level resulted in instability and triggered calving of the frontal tips of re-entrant basin ice masses, with ensueing recession in a downgradient direction in T7 and Fort Ann time.
2. Ribbed Lacustrine Deposits
Also in Middlbury Bench re-entrant basins are other deposits which I likewise recognized and mapped in the late 1960s and early 1970s, but again at that time did not understand. Many more such deposits have been identified on LiDAR imagery as part of this VCGI mapping. These deposits possess strongly kamic bench-like topography with more or less parallel topographic grooves, or swales, but with a surface veneer of bouldery lacustrine silt-clay soils – hence the name “Ribbed Lacustrine Deposits,” overlying sand and gravel formed by stagnant ice.
The following screen shot is enlarged from the above VCGI map Project Sheet for the Hinesburg area in the LaPlatte re-entrant to show a representative example of a significant Ribbed Lacustrine deposit:
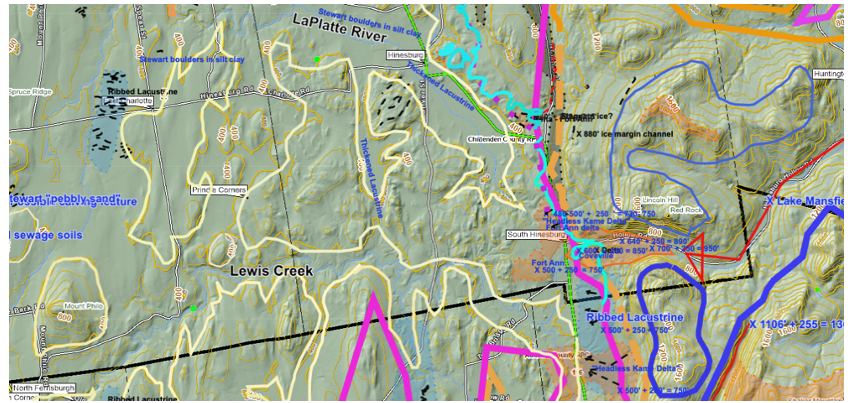
This deposit was initially identified in my mapping in the 1970s. It is a large deposit, spanning several hundred acres, on the margin of the LaPlatte re-entrant basin floor. The owner of the property reported test pits penetrating through about 15 feet (5 m) of an upper layer of fine grained silt-clay sediment into sand and gravel, which likely is the core stagnant ice deposit which gives the deposit its ribbed and kamic topography.
It is believed that these Ribbed Lacustrine deposits:
- formed along the ice margin, which was destabilized by the sudden, substantial lowering of Lake Vermont from the Coveville to the Fort Ann level.
- by stagnant ice which became submerged in ponded water while melting ice remained,
- with drainage resulting in the formation of the ribbed topography grooves,
- associated with, but not actually marking, the calving margin per se.
As noted above Van Hoesen 26Van Hoesen, J., 2016, Final Report Summarizing the Surficial Geology and Hydrogeology of Monkton, Vermont; Vermont Geological Survey Open File Report 2016-2, 36 p. studied the surficial geology of the Monkton area, showing that surficial deposits on the lowland floors with his “Distinctive Topography,” basically the areas here mapped as “Ribbed Lacustrine Deposits,” are predominantly lacustrine silt-clay, but that well logs indicate the presence of a sand and gravel deposit at depth. His isopach map shows substantial thickness on the order of 100+ feet(30 m) of surficial material on the basin floor, again in the area corresponding with the Ribbed Lacustrine feature. Topography in the area of the Ribbed Lacustrine deposits is described by Van Hoesen as: a) “hummocky,” b) having “distinctive topography in valley bottoms,” and c) “characteristic dissected lobate topography associated with lake clay deposits.”
This is the same deposit recognized in my mapping in the 1970s, is in the Monkton area northwest of Bristol (not shown on the above map), basically on the divide between the Little Otter Creek, Lewis, and LaPlatte re-entrant basins. Such deposits in divide areas show the correlative formation of these deposits in neighboring re-entrant basins.
Many such deposits were tentatively identified on LiDAR at many locations in the re-entrant basins within the Middlebury Bench, and as well long the eastern margin of the Trough. Also, such deposits have been identified elsewhere, as for example a major deposit in the Black Creek Basin which is a tributary to the Missisquoi Basin. This deposit likewise was initially recognized by my mapping in the 1970s. Present mapping shows a substantial deposit in the headwaters area of the Black Creek basin, at the divide with the Lamoille Basin. Recession of a narrow ice mass in the Black Creek Basin is marked by multiple calving deposits including Headlss Deltas, suggesting formation associated with the lowering of Lake Vermont from the Coveville to the Fort Ann levels, with this deposit marking the recession of the ice margin in T7 and Fort Ann time. This northward progression in Fort Ann time is consistent with other evidence found in the VCGI mapping, as reported for Locales identified in the Appendix.
Returning to the LaPlatte Basin, further to the west and downgradient from the Hinesburg area in the LaPlatte Basin is another, in this case very important Ribbed Lacustrine deposit, as shown on an enlargement of a portion of the above map:
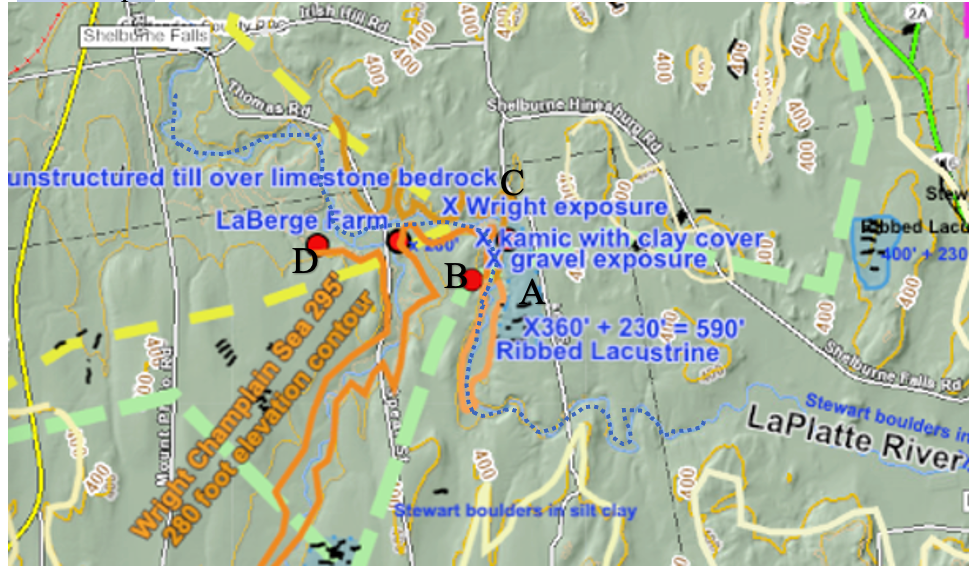
The location of this deposit is marked as position A. This Ribbed Lacustrine deposit was identified by LiDAR imagery and confirmed by field mapping, with a surface veneer of lacustrine silt and clay soil materials, and an exposure of buried stagnant ice sand and gravel. Also, a landowner at this location reported a water well log of silt and clay over a gravel deposit. The deposit forms a distinctive topographic bench along the LaPlatte.
This deposit is significant for several reasons:
- Its surface elevation is close to, slightly lower than the elevation of the features near South Hinesburg, but still within the Lake Fort Ann level, and therefore formed in Fort Ann time.
- Its location is downgradient from several Thickened Bouldery Lacustrine deposits on the LaPlatte basin floor, and therefore likely marks the recession of the LaPLatte calving ice margin at a slightly later T7 time.
Thus, this deposit is interpreted as indicating the progressive recession of the calving ice margin in T7 and Fort Ann time in the LaPlatte Basin.
In addition, this location is in close proximity to other important features:
- Two locations identified by Wright, in his mapping of the Town of Charlotte, as described above, including the “Old Charlotte Town Dump” at “B,” and the exposure along the LaPlatte where he suggested a readvance at “C.”
- The level of the Champlain Sea as shown by the orange colored line on the above map.
- The LaBerge farm (“D”) where Stewart and MacClintock identified a kame trace, but which my mapping in the 1970s identified as a Champlain Sea delta.
- A change in the course of the LaPlatte River, as traced by the dotted blue line, thought before the Addendum study to mark a deviation of the ancestral LaPlatte drainage along the ice margin, with a deviation associated with the lowering of the Champlain lobe associated with the Fort Ann to Champlain Sea transition. The heavy light green line marks the ice margin at a later T7 time, slightly later than the T7 margin at South Hinesburg.
Based on these observations, the heavy light green line on the above map represents an ice margin position associated with the Ribbed Lacustrine deposit, interpreted at later T7 and Fort Ann time, representing recession of the calving margin from the headwater area near South Hinesburg. In this report, which again was completed in January 2026, these observations were part of the evidence used for identifying the close presence of the ice margin at this location, marking the ice margin position at the transition from Fort Ann to Champlain Sea time which was sudden and substantial. It was the suggestion of a long convex lobe at such a late time that led to the Addendum investigation which ultimately disproved this interpretation. However, for sake of simplicity this Addendum interpretation is presented in a separate section below.
3. Headless Shoaling Kame Deltas
Multiple shoaling type deltaic deposits are mapped on VCGI at the Fort Ann level in the LaPlatte, New Haven, and Otter Creek re-entrants, where they occur in close association with Ribbed Lacustrine deposits, Thickened, Bouldery Lacustrine deposits, and stagnant ice deposits, along the margins of the re-entrant basins at the Fort Ann level. LiDAR imagery indicates that the sediment in many of these deposits originated from drainage related to stagnant ice deposits, fringing the re-entrants, again suggestive of remnant meltwater drainage associated with the Coveville to Fry Ann lowering. These are unlike conventional deltaic deposits, which narrow in an upgradient direction into the mouths of the associated present-day drainage basins. LiDAR imagery suggests drainage from stagnant ice masses along the re-entrant perimeter, some of which are now buried beneath lacustrine deposits as Ribbed Lacustrine features, toward and into the shoaling deltaic deposits on the re-entrant floor. These deposits are referred to as “Headless Deltas,” which are part of the calving ice margin story.
The following is an enlarged portion of the above map in the South Hinesburg vicinity:
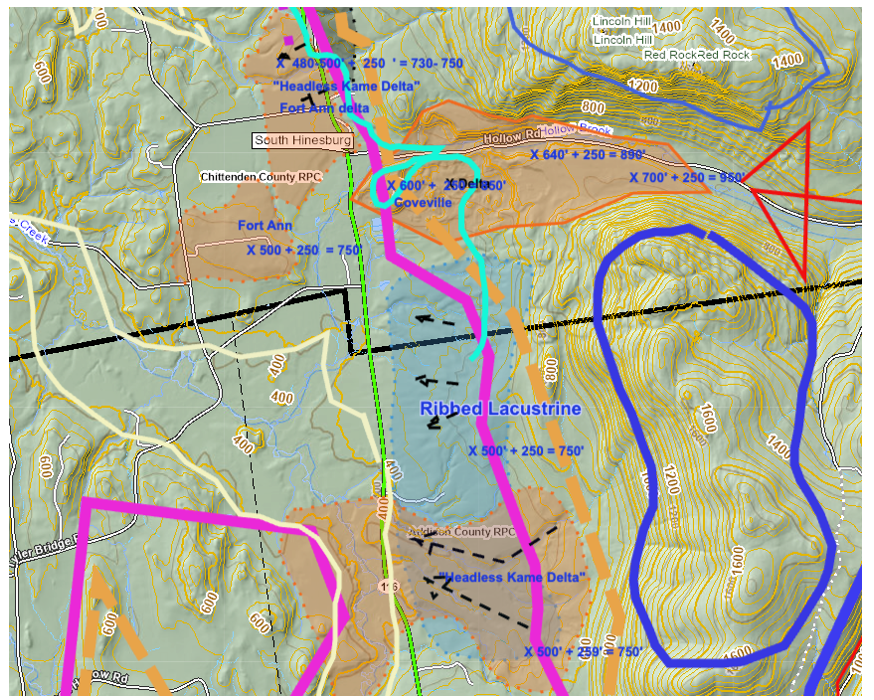
This map shows the major Coveville delta, and a lower Fort Ann delta at South Hinesburg. Also shown is the aforementioned Ribbed Lacustrine deposit, to the north and south of which are “Headless Kame Delta” deposits. These are at the base of the T4 -T6 level and time step-down margins, with the surface of the delta graded to the Fort Ann level. The Headless Delta deposit is believed to have formed from drainage associated with masses of stagnant ice left behind at the T6 level and time, as indicated by LiDAR detected drainage lines. Unlike conventional deltas deposits which tend to narrow upgradient into apexes associated with present day drainage systems, this deposit is not associated with any significant present-day drainage which could explain the deposit in a more traditional way. Many such deposits are mapped in this and other re-entrant sub-basins in the Middlebury Bench.
“Ribbed Lacustrine,” “Headless Delta,” and “Thickened Bouldery Lacustrine” deposits are not actually calving ice margin features per se in that that they did not form at the calving margin or the grounding line, but instead formed in close association with calving margins. Again, they represent transitional features associated with the sudden lowering of water levels, in this case from the Coveville to Fort Ann levels, as an“externality” independent of the ice sheet control which resulted in destabilization as a Glacial Dynamic.
The preceding discussion presents information from the LaPlatte Basin in regard to evidence for calving, but similar evidence has been found elsewhere in other re-entrant basins in the Middlebury Bench. Both a published report by Calkin and VCGI mapping have identified features which are suggestive of and compatible with calving along the Little Otter Creek and New Haven River re-entrant basins. A large and prominent Gilbert-type delta at the Coveville level at Bristol formed from outwash extending southward from a T4-T6 stepdown margin at Starksboro(S) to the north(at the head of the LaPlatte Basin). Immediately west of Bristol is a shoaling deltaic deposit at the Fort Ann level which represents the opening of the New Haven and Little Otter Creek re-entrant basin in late T6 time, when Lake Vermont lowered from the Coveville to the Fort Ann level, and when calving of the New Haven-Little Otter Creek sub-lobe ice stream began. Calving is indicated by a) nearby Headless Deltas, b) Ribbed Lacustrine deposits near East Monkton and Monkton Ridge, and c) Thickened Bouldery Lacustrine deposits on the floor of the re-entrant New Haven and Little Otter Creek basin floors.. Nearby to the north, on the divide between the LaPlatte and New Haven re-entrants is a Headless Kame Delta and Ribbed Lacustrine deposit at the Fort Ann level along this ice margin between these re-entrant basins.
As can be seen on the above Middlebury Bench physiographic map, the trace of Otter Creek extends southward from the Vergennes area, continuing southward past the village of Middlebury, toward and into the mouth of the Vermont Valley. Again, similar deposits in this basin fit with the above description for calving. For example, per the following map, Headless Deltas and other evidence at DeLong Hill and West Salisbury, both of which are at the Fort Ann level, indicate calving of an ice lobe in the Otter Creek re-entrant basin.
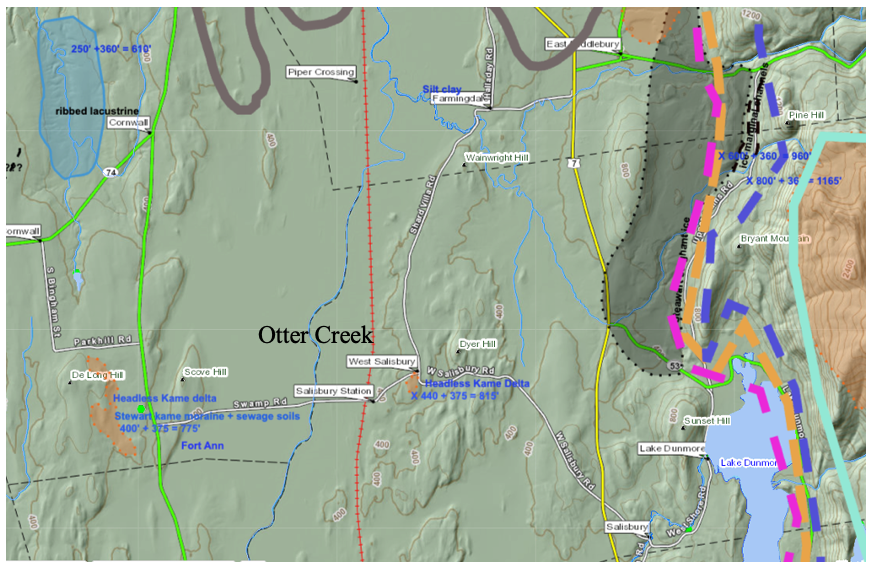
The deposit along DeLong Hill is identified on the State surficial map as “kame moraine” Similarly to the east, at West Salisbury, is a deposit identified on the State map as “Lake Sand.” Both the Delong Hill and West Salisbury deposits are at the Fort Ann level, and are here interpreted as “Headless Kame Deltas,” signifying that their formation does not correspond with any present-day drainage, but likely were related to and associated with the Otter Creek ice stream at the grounding line of the calving ice margin. These deposits likewise are indicated on the soil sewage favorability tab on VCGI as more granular soils. LiDAR imagery does not show kamic topography but instead suggests low, relatively subtle topographic rises. These rises are marked by mining excavations, confirming the granular nature of the soils. In addition, LiDAR imagery shows curvilinear features which do not appear to be associated with human activity such as agricultural drainage controls. These approximately follow the topography and may be grounding line marks. Although not mapped as such, Salisbury Swamp between these two Headless Deltas may be floored by thickened lacustrine deposits.
Also, in the Middlebury(M) area at Chipman Hill is a stagnant ice deposit with stratigraphic variations identified by Calkin, and a possible landslide scar induced by the same margin, which may likewise relate to the calving margin of this ice stream. On the east flank of Chipman Hill, on the eastern margin of Middlebury Village, is unusual scalloping of the terrain, possibly slump features, close to the Fort Ann level, as shown on the VCGI screen shot below:
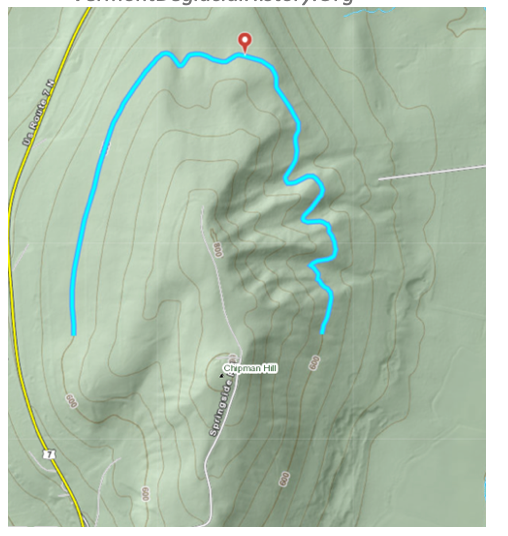
The contour for the 600 foot(183 m)(local) elevation, which is close to the Fort Ann level, is partially highlighted. The explanation for the scalloping is uncertain but may represent terrain instability failures caused by erosion at the base of the hillside at the Fort Ann level, as described in the glaciology literature for present day grounding lines. Interestingly, if the scalloping was indeed caused by slumping, then it is notable that no corresponding debris pile at the base of the hillside is evident, which may be attributable to the presence of ice at the time of slope failure. Instead, at the base of the eastern slope of Chipman Hill, just below the 600 foot(183 m) contour are stagnant ice deposits, as reported by Calkin, with “till sandwich deposits.”
Footnotes: