Warning and Prefatorial Note: The following deglacial history was written as part of my original report which was completed in January 2026. This version of deglacial history was subsequently revised by an Addendum dated September 2026. The Addendum only changed the interpretation of the last T7 and T8 chapters of deglacial history and thus most of the following in this January 2026 version remains valid.
As discussed below, the January 2026 report, found that the recession of the Champlain lobe involved a step-down recession of its margins, beginning in Late T3 time, in close association with local proglacial water bodies that progressively coalesced and enlarged, leading to a long convex ice mass in conformance with physiography, fronted first by regional Coveville Lake Vermont in late T6 time, followed by Fort Ann Lake Vermont in T7 time, with a readvance in T8 time associated with the Champlain Sea, all with the Champlain lobe frontal tip standing far to the south in the Basin.
My finding that the Champlain lobe was long and convex in T7 and T8 times was not an easy or comfortable interpretation. This reflected an evolution in my thinking, showing the power of paradigms. We all of us in the glacial history story-building business are faced at the most basic, fundamental level of logical thinking with the need to rely on our mental preconceptions about the nature of ice sheets. When I first examined the deglacial history of the Champlain lobe, I in fact drew the T8 margin in the Missisquoi Basin, representing a readvance in Champlain Sea time, with the T8 margin extending westward across the basin as a flattened margin because I took for granted that a) the margin likely was flattened by calving, and b) such a position far to the north in the basin was necessary in order for the Champlain Sea to enter the basin. This was the same paradigm-ic thinking that conditioned Chapman’s thinking in his seminal report on proglacial water body history, and likewise has been the thinking ever since. But, until now, the actual position of the ice margin as it crossed the basin has not actually been documented but instead has been surmised.
At that early time, prior to concluding my January 2026 report, I recognized features in the southern part of the Champlain Basin which suggested a different alternative view of a much longer, more convex late glacial lobe in the basin. For example, multiple linears at low elevations on the basin floor are particularly eye-catching. At that time I wondered if perhaps these might have formed along an ice margin, but if so the low elevations of these features in the context of the Bath Tub Model would suggest a late glacial time. Again, my paradigmic mental model led me to reject this possibility. (In the second, amended version of this report these features came to be identified as Mega-Scale lineations for a streaming Champlain lobe, in a very different paradigmic model.)
However, as my study progressed, again still in my original January 2026 report version, I began to find multiple lines of evidence in support of a more substantial convex late glacial lobe. This evidence is presented below and is not repeated here, but in time this mounting evidence led to the interpretation of a long convex lobe in T7 and T8 times, with a readvance in Champlain Sea time.
To step back and briefly summarize the then emerging deglacial history model, the pre-Addendum findings showed that the Champlain lobe recession, beginning at the start of the Lobate Phase in late T3 time, progressed as a step-down recession of the ice margin fronted by local proglacial lake, which progressively coalesced and grew larger through time as the recession continued. The Champlain lobe at these early times was predominantly Cold active ice, with an outer fringe of polythermal Warm over Cold over Warm ice as marked by Ice Marginal Channels, capable of restraining and diverting meltwater, as marked by Bedrock grooves, with Drainage Lines leading to the local proglacial water bodies marking kame delta deposits at progressively lower levels through time. In T6 time the Champlain lobe stood as a long convex ice mass extending southward in the Champlain Basin, fronted by Coveville Lake Vermont as a regional water body, marked by kame deltas in the main basin floor at Benson Landing, extending northward at Castleton, wrapping around the nose of the Taconics into the mouth of the Vermont Valley at Proctor (near Rutland), thence continuing northward with kame deltas along the foothills at Brandon, Pittsford, East Middlebury, Bristol, and South Hinesburg. These kame deltas document the presence of regional Lake Vermont in a narrow, more or less open water corridor along a “Disaggregated” ice margin, essentially an ice margin labyrinth with ice blocks penetrated by standing water.
The evidence indicates that these deltaic deposits and the associated Disaggregated ice margin were diachronic, with progressive northward recession of the head of the Coveville corridor, becoming progressively younger northward in late T6 and Coveville time. For example, the Bristol Coveville delta was formed from outwash from a T6 ice margin near Bristol, followed by the formation of the Coveville delta further north near South Hinesburg, which required an ice dam across the mouth of the Winooski Basin, as marked by a major stagnant ice deposit near Williston at the T6 level and time. This ice dam subsequently opened in early T7 time when Coveville lowered to the Fort Ann level. This lowering was sudden and substantial resulting in destabilization of the Champlain lob, again as marked by multiple features. The opening of the Winooski Basin entailed a complex history as described below and is not repeated here.
Similarly, the evidence indicates that Fort Ann Lake Vermont likewise occupied a narrow corridor along a receding diachronic Disaggregated ice margin, with the head of the corridor progressing northward in T7 time. For example, on north side of the Winooski basin in the Essex area are eskers at the T7 level and time with drainage graded into deltaic deposits at the Fort Ann level. Likewise, other evidencedocuments the progressive northward recession of the head of the Fort Ann corridor, to and beyond the Quebec border, leading ultimately to the opening of the basin for the sudden and substantial lowering of Fort Ann and the incursion of the Champlain Sea into the Basin.
Still further, the evidence as discussed below in this pre-Addendum study indicated a readvance in T8 time associated with the Champlain Sea in the Missisquoi Basin, which along with other multiple lines of evidence led to a correlation with readvance evidence reported by others further south in the Charlotte and Bridport areas. Thus, was born the concept of a long convex active ice lobe at a late T8 and Champlain Sea time.
The shape of the Champlain lobe as a long convex ice mass was fundamentally attributable to the power of standing meltwater to rapidly penetrate the lateral margin of the Champlain lobe as a regional water body. And further the sudden and substantial lowering of these water levels at multiple times resulted in destabilization, reflecting a Glacial Dynamic, aided by other conditions such as the Warming of the Champlain lobe and the presence of basal meltwater, again as discussed in detail below. As a consequence, the eastern lobe margin transformed from a lateral type margin toward a frontal type margin, associated with the Corridor. The development of this Corridor was fundamental to the recessional history of the lobe, resulting in its convexity, entailing both northward recession of the lobe tip, and as well westward recession of the eastern margin. This convexity also meant that the readvance in T8 and Champlain Sea time did not require a long readvance distance, but in fact likely was a significant but still relatively minor “oscillation.”
Discussions with David Franzi and Etienne Brouard in January 2026about my “completed” report both supported and raised questions about these findings:
- Brouard indicated that he believes that the concept of the opening of the Champlain Basin for the incursion of the Champlain Sea by a long narrow corridor between the ice sheet and the terrain may be supported by evidence in Quebec.
- However, based on evidence in New York and as well theoretical information suggesting such a long convex lobe was not sustainable, Franzi questioned the validity of a long convex Champlain lobe in Champlain Sea time, with a late glacial readvance. This prompted me to suggest in response, again as discussed in the January 2026 report, that the Champlain lobe may have been an unstable, remnant ice mass, with “schizophrenic” differences between Vermont and New York owing to difference in physiography.
Thanks to these discussions, I decided to revisit this issue by a closer study of LiDAR evidence for the Champlain lobe in Vermont, followed by focused field examination. This resulted in significant new information, as presented in the revised September 2026 version of this report, given in the next section below, documenting that the Champlain lobe stood as a long convex ice mass in T7 time, which was destabilized in multiple ways in T7 time by Glacial Dynamics, resulting in an early phase of ice streaming and associated calving, followed by a second accelerated phase of streaming, possibly representing the “collapse(?)” of the Champlain lobe, followed by a readvance in T8 time which was restricted to the Missisquoi Basin.
Rather than revise my report I decided to keep the January 2026 findings as a matter of record. Much of this January 2026 version remains valid. The observations which led to my initial finding of a long convex lobe with a late glacial readvance are intriguing arguments which in my opinion merit being preserved. Thus, I added a September 2026 Addendum presenting the revised findings for late glacial T7 and T8 times, but as well kept the original January 2026 version as presented in the following.
As stated in the Introduction above, this is a report on Vermont’s Deglacial History, Styles, and Glacial Dynamics, with the history based on the assumption that the Bath Tub Model is a valid and reliable basis for correlating ice margin features having similar elevations. Application of this methodology leads to the identification of specific associated ice margin elevation levels, positions, and times, all in a relative chronology ranging from T1 to T8, as summarized and presented in tabular, map, and narrative formats as discussed below. More detailed information in support of the findings is given for specific “Locales” in Appendix B, which also includes a map showing all Locale locations.
The history presented here is based on my previous unpublished field mapping, reference to previously published reports, and information developed by usage of the online services of the Vermont Center for Geographic Information (VCGI) to identify, map, and correlate ice margin features. This service provides users with access to a wide array of information, such as LiDAR imagery, and published information regarding Vermont geology, soils, and other relevant information. VCGI is accessible and viewable online at the following link:
In addition, at various points and times I also used follow-up, focused field study to evaluate LiDAR findings.
VCGI allows users to compile information on a “Project Sheet,” which in essence represents an online “field map.” My Project Sheet included markings of ice margin features as described above along with miscellaneous notes and observations. The Project Sheet can be viewed at a range of scales, with the ability to zoom in for extremely detailed, close-up views. Elevations of features on the Project Sheet for ice margin features and levels are taken from VCGI-provided USGS topographic maps. Elevations recorded on VCGI maps are “Local” levels. These are adjusted to make corrections for isostatic rebound using the Quebec border as the reference point to provide corrected elevations showing the topography as it existed prior to rebound, which was then used for correlating and differentiating features formed at the same times and levels. 1 Adjusted levels are marked on VCGI by giving the local, present day elevation, plus an additional elevation to correct for isostatic differences, again using the distance to the Quebec border as the reference for a correction factor at a slope of 5 feet per mile along a north-south transect. As discussed above, future revisions of the isostatic correction factor may be warranted, but this is not believed likely to change the findings in a major way.
The VCGI Project Sheet developed from research reported here is intended to be viewable by usage of an online link, which can be made available. However, as is the nature of all such technology, VCGI is based on a geographic information system that is becoming outdated, with new versions presently in development. Unfortunately, the next new version, scheduled for Spring 2028, will be incompatible with the present version, such that when VCGI converts its system, the older version, including the Project Sheet used for the study reported here, will no longer be available.
In early January 2026, just as I was completing this study, the VCGI system calamitously crashed, resulting in the loss of my Project Sheet. Fortunately, the VCGI Project Sheet can be preserved in different ways. I did so immediately prior to the crash by usage of an extremely tedious method of stitching together many screen shots, which generates a pdf file, which can be shared but is no longer accessible online at VCGI and can not be modified or updated on VCGI. My preserved VCGI Project Sheet, as of 1/1/2026, is available as a digital file created by GIMP, which I can use to produce a JPEG, pdf, or other file format. Of course, any new added information or changes made to the Project Sheet after this date are not included.
My mapping, which began three plus years ago, used the Project Sheet as an ongoing “field” map on which all pertinent information was added, with various pertinent notes and markings. As noted elsewhere, thanks to numerous, ongoing epiphanies, I returned to this Project Sheet frequently on an ongoing basis, resulting in many modifications and versions, with copious notes added as the mapping progressed. The final Project Sheet is a very large file size (nearly 500 mb), which can be made available upon request.
The following is the Project Sheet just prior to the VCGI system crash which destroyed the parent online file at VCGI:
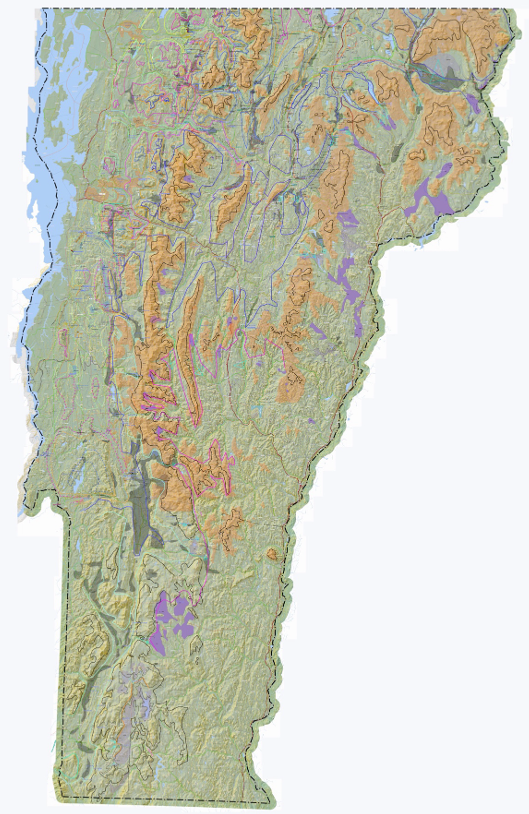
This map in its full form contains an enormous amount of information, representing all the data from my VCGI mapping and as well notes added based on both my previous mapping in the 1960s and 1970s, and as well more recent spot field checking. The mapping of ice margin features and associated proglacial water bodies on VCGI generated considerable detail on the VCGI Project Sheet. Unfortunately, scale limitations make this screen shot of the 12/31/25 version difficult to read. However, as already noted, detailed local information from VCGI mapping is given for numerous Locales in the Appendix B where important information taken from the Project Sheet is presented, and this Project Sheet as of 1/1/2026 can be made available.
The Project Sheet was used as the base map for delineating ice margins on maps for the eight time intervals designated T1– T8 as presented in the following. VCGI information is restricted to Vermont with only a slight overlap into neighboring areas of New Hampshire, New York, and Quebec. In order to facilitate the exploration of the correlation of Vermont ice margins with neighboring regions as reported in the literature a second set of maps was developed, using regional topographic maps which include elevation contour information which is useful for extrapolation of the T1 -T8 ice margins.
The following table summarizes the elevation levels and times used for mapping of ice margins:
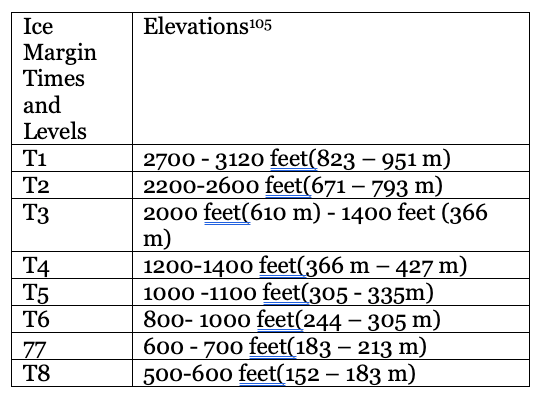
Isostatically adjusted ice margin elevations using the Canadian border as the reference, with local elevations of features to the south of the border decreased by an amount determined by an isostatic slope of 5 feet per mile for the distance measured along a north-south transect to the Canadian border.
These eight T times, levels, and positions of ice margins were determined by application of the “Bath Tub Model.” The mapping of ice margin features on VCGI has repeatedly shown that in general the lowering and recession of the ice margin was progressive and incremental, as repeatedly stated for emphasis in this report, took place in a reverse gradient setting, “like multiple rings in a slowly draining “Bath Tub. ” As noted in many places in this report, this simple statement has profound significance. Recession was in fact progressive and incremental, but whereas the deglaciation, as just stated may be likened to a slowly draining “Bath Tub”, certain “rings” are more prominent and substantial, suggesting perhaps pauses or stillstands in the lowering of the ice sheet. These are at the above T levels and times. However, it is likely that the ice margin recession was mostly steady, progressive and continuous, such that T times, levels, and margins are merely time markers, generally having no particular climatic historical significance. It is suspected that these “stillstands” represent pauses associated with or caused by hypsometrically induced or other statewide Glacial Dynamics.
The T3/T4 and T8 ice margins, levels, and times represent readvances. T3/T4 time features are correlated with the White Mountain Morainic System in New Hampshire, which reportedly represents a readvance dated as about 13,800 – 14,000 years BP. T3/T4 time features also are correlated with previously published readvance evidence in the Winooski Basin, and with features in the Vermont Valley where soil boring and well logs support, or at least are consistent with, a readvance. The T8 readvance is based on evidence previously reported by Cannon (1964) and Wagner (1972) in the Missisquoi Basin, and is believed to postdate the incursion of the Champlain Sea into Vermont which is dated at about 13,000 years BP. Thus, the deglacial history represented by the T levels, times, and ice margin positi0ns reported here is book-ended by readvances, and likely occurred rapidly over a relatively brief span of time, late in the last Laurentide glaciation history.