In response to my Epiphany #6, both Franzi and Brouard each provided me with recent comprehensive overviews of their current understanding of the deglacial histories of Quebec and northeastern New York, specifically:
a) Cormier, Lajeunesse, Brouard, and Bernier, 2025, Revisiting Retreat Patterns of the Laurentide Ice Sheet Margin during the Late Pleistocene in Southern Québec using LiDAR imagery; Geoscience Canada, 52(2), 119.
b) Franzi, Grasing, McLean, Barclay, and Briner, 2023, Bridging the gap: glacial geomorphic mapping in the Adirondack Upland, New York, Quaternary Science Reviews, 314, 108198.
I have reviewed these documents and offer the following as to how this information comports with my understanding of Vermont deglacial history, first for Quebec, followed by New York. It is interesting that both the Cormier et al and Franzi et al findings are based on regional studies, largely with the benefit of LiDAR imagery and supported by focused field mapping. My methodology has been similar. Whereas I have drawn on my field mapping in Vermont in the 1960s and 1970s, for which I still have both notes and memories, the bulk of my findings are from remote mapping using LiDAR imagery and from published maps and reports by others.
In general, in my opinion my Vermont mapping and deglacial history interpretation generally fits well with the findings reported by both Cormier et al for Quebec and Franzi et al for New York. Considering that my Vermont work was done independently prior to my seeing their findings, this is both remarkable and for me personally reassuring. Differences are noted which are believed to reflect physiography and other environmental conditions unique to these different areas. However, significant unanswered issues remain. It is hoped that this Second Addendum may help by focusing on these gaps.
Cormier et al state: “Our new mapping allows the identification of five major marginal systems.” The definition or meaning of the term “marginal system” is not given but is presumed to be essentially similar to an ice margin position, but marked by multiple, diverse glacial, ponded, and drainage features which are all roughly the same age and closely associated spatially. The term “marginal system,” as used in papers like Cormier et al, is broader and more integrative than “moraine” positions, typically referring to:
- A zone of ice-margin stability or oscillation, not just a single line
- Composed of multiple coeval or near-coeval landforms, which may include:
- Moraines (till ridges)
- Ice-contact deposits (kames, eskers)
- Meltwater channels
- Outwash plains
- Glaciolacustrine (ponded water) features
- Reflecting a complex margin environment, where ice, meltwater, and sedimentation interacted over some span of time (not an instant).
Cormier et al present a map showing Quebec deglacial history elements. This map does not specifically depict and identify their five marginal systems but based on a review of their illustration, these five systems are presumed to include, in order of decreasing age:
- An ice marginal system of Cold Ice in the uplands generally south and southeast of the Memphremagog Readvance
- The Memphremagog Readvance
- A sector of recessional, step-down ice margins
- The Beauce Readvance
- The Drummondville Readvance, which is said to consist of a series of morainic complexes reworked by coastal processes in the Champlain Sea. This last note is taken to indicate that the Drummondville Readvance occurred in Champlain Sea time into the Champlain Sea, though the language in this regard is ambiguous.
As discussed in my full January 2026 report, multiple recessional moraines previously have been identified in the Quebec Piedmont, as for example by Parent et Ouchietti et al, such as the Sutton, Dixville, and Frontier moraines. These are not specifically identified or delineated per se on the Cormier et al map, but are here presumed to be included within the five marginal systems. Other notable aspects include a distinction between Cold versus, by inference, Warm ice, with the former generally in the higher and earlier Appalachian terrain Systems. Also, Ice flow directions are given, generally showing southeastward ice movement but northeasterly ice movement in conjunction with the Beauce and Drummondville Readvances. These later directions would seem to be related to ice streaming at a late glacial time for the Champlain lobe and the ice mass in the St Lawrence basin, more or less as suggested by the arrows on my above regional map.
In general, my sense is that the approach taken by Cormier et al, in their presentation of “Systems” with an emphasis on Readvances reflects first the fact that LiDAR imagery provides an enormous amount of information pertaining to deglacial history, but more importantly reflects the nature of the recession of the Laurentide ice sheet in Quebec which involved considerable interaction between the ice sheet and both standing and running water. Similarly, in Vermont thanks to LiDAR, I have been confronted by an almost overwhelming amount of information. Because I have chosen to present details about this information in my original January 2026 report, as a way to provide supporting documentation for my findings, my report has grown to become overwhelmingly long. It seems to me that a Systems approach represents a helpful way to present such information in a more condensed form.
But more fundamentally, the Systems approach utilized by Cormier et al I suspect reflects the nature of the ice margin recession in Quebec which was similar to that in Vermont. I believe this recession involved the progressive and incremental step-down of ice margins which generally were oscillatory in nature. Ice margin features reflect this progressive step-down and generally represent “stillstands” only in the sense that time was required for the formation of such features. I liken this to a slowly draining, irregularly shaped bathtub. Again, I believe that the Cormier et al Systems approach also reflects the fact that the record, again thanks largely to LiDAR, provides enormous detail not just about ice margins per se, but as well associated meltwater fluvial and ponded water drainage information which bears on and adds substantially to the deglacial history record.
In a sense, LiDAR has so dramatically added to the deglacial history record as to make the traditional way of studying and especially reporting this history difficult if not impossible. Looked at more comprehensively, deglacial history no longer can be represented simply by multiple ice margin lines on a map.
Further, Cormier et al’s Presentation shows that deglaciation in Quebec was interrupted by important readvances. These readvances are especially important, not just because they may (or may not) represent climatic variations, but in a sense provide significant time markers in the deglacial history which in a way re-started the clock in the sense that each readvance marks a critical time in deglacial history when the stepdown pattern was begun anew. Thus, whereas we are faced with a myriad of recessional ice margins, again in overwhelming detail, readvances which were fewer in number provide important and helpful markers which simplify the telling of the deglacial history.
I believe the record presented by Cormier et al and in my report are similar in nature. However, the details differ in important ways. This difference in part has to do with regional differences in physiography, which results in unique deglacial “Styles,” and “Glacial Dynamics. ” My sense is that the basic deglacial history told by Cormier et al for Quebec represents the same or similar progression of events as found in Vermont, but again the Styles and Glacial Dynamics of the two regions were very different. For example, the Vermont record provides information about the destabilization of the Champlain lobe and its “collapse” by a calving ice stream. This collapse is an extremely important and significant element, not just in terms of deglacial history, but, as previously noted, as well for the Glacial Dynamic information provided about the conditions associated with and resulting from ice lobe collapses, which is a major concern for our present day global warming. The Vermont record is thus important and perhaps unique in that regard. In fact, this record may as well differ in New York even though the Champlain lobe history was shared across the same Basin; the evidence in Vermont indicates that the deglacial history record tends not to be bilaterally symmetrical within individual drainage basins. This has to do with the a) the adventitious nature of ice sheets which take advantage of and mark local physiographic conditions, b) the tendency for “Styles” and “Glacial Dynamics” to vary spatially, even within the same basin in close proximity, and c) the fact that in the earlier part of the history the dominant ice flow direction was southeasterly across the grain of the physiography which was bedrock controlled with a structural grain askew to the ice flow such that New York Champlain lobe features formed at an early time were in the lee of ice sheet flow in contrast to Vermont where the ice sheet abutted directly against uplands.
On the other hand, whereas the Vermont story is important it is not and cannot be the full story in regard to the larger deglacial history of the Champlain lobe as an appendage of the Laurentide ice sheet, which as well was affected by neighboring regions. Thus, the deglacial history story of Vermont, Quebec, and New York deserves and needs to be told together.
The following gives an overview of my findings for Vermont deglacial history, and where appropriate draws comparison with findings as presented by the Cormier et al Presentation. This is followed in a subsequent section with comments pertaining to the Franzi et al report for New York. Of course, this summary can not possibly present all the details, for which my January report and subsequent Addendum #6 serve as a more complete reference source.
I have identified eight times spanning the deglacial history of Vermont, which correspond with progressively lower levels and generally recessional ice margins positions, per the following:
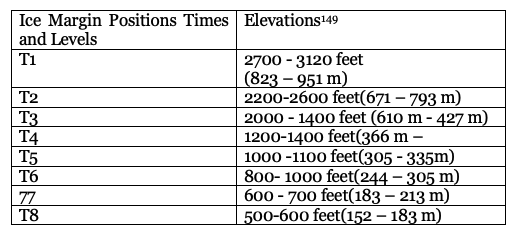
As explained in my report, these elevations are at the Vermont/Quebec border and for features mapped to the south elevations are adjusted upward for isostatic rebound at a slope of 5 feet per mile with distance northward to the border. An exception to this is for the Upper Connecticut Basin where isobases are oriented NE/SW such that for comparing elevations with features in Quebec this adjustment is made according to this direction.
The following is a review of salient elements of my findings for the above times, with comments regarding the comparison with Quebec. Whereas the intent is to present the important historical elements, again it is not possible to present all aspects in detail. Thus, the following serves a general overview:
- T1 and T2 times are unique to Vermont, representing the fact that the ice sheet in the Connecticut Basin of Vermont at these times was nourished primarily by flow from the Champlain Basin, with minor input from the Memphremagog Basin until T4 time. The headwaters of the Connecticut Basin as a pathway were too high and constricted for significant southward supply. T1 and T2 times are marked by tracts of “Scabby Terrain” which have not been recognized previously but in my opinion are well documented by strong evidence. Briefly, these tracts represent “Disconnections” of the ice sheet, a term and concept found in glaciology literature for conditions where and when the ice flow from the parent ice sheet was interrupted, in this case with ice levels of the Champlain lobe falling below cols where ice supply to the Connecticut Basin was previously occurring. T1 and T2 times, levels, and positions are in the southern and central Connecticut Basins. These margins are unique to Vermont and I would not expect correlative positions, features, or events in Quebec (or New York).
- The early part of my findings for Vermont deglacial history represent a time which I refer to as the “Nunatak Phase” which generally comports with a range of elevations in T3 time. This Phase is primarily marked by Ice Marginal Channels. Whereas I have not attempted to correlate Ice Marginal Channels in the Nunatak Phase at individual levels, the progressive growth and development of Nunataks is shown by growing “islands” in the ice sheet at different times. Ice Marginal Channels in the Nunatak Phase are very numerous, numbering in the hundreds. These are mapped from elevations of about 2000 feet (610 meters) down to about 1400 feet (427 m), with reference to the Quebec border. In general, it appears that the Vermont Nunatak Phase corresponds with deglacial features and history in Quebec as presented by Cormier et al, generally before the Memphremagog Readvance.
- The Lobate Phase in Vermont began when, as the term suggests, discrete and distinct lobes of ice first appeared in Vermont major basins such as the Memphremagog, Missisquoi, Winooski, Lamoille, and Otter Creek basins. In general, the Lobate Phase in southern Vermont is marked by T3 time features, when at the same time the ice sheet in northern Vermont was still in the Nunatak phase, reflecting the earlier recession in the southern part of Vermont, progressing northward through time, as would be expected.
- The Lobate Phase ice marginal features identified in my mapping are specifically and comprehensively reviewed in my January 2026 report. This Phase is marked by a wide variety of diverse features, including for example stagnant ice margin deposits, Ice Marginal Channels, and other associated fluvial and ponded water features, but not discrete and distinct ridge-like moraines. Fluvial and ponding features serve as important time links across and between basins, by which it has been possible to confirm or support correlation of features across the State over large distances, not just by elevation in the “Bath Tub model” but as well by such links. In addition, certain features are so distinct as to represent “Signature” markers that make it possible to correlate ice margins across wide areas of Vermont. For example, Ice Marginal Channels at the late T3 and T4 level are very distinct, numerous, and widespread Signature markers. I believe these correlate with Cormier et al’s Memphremagog Readvance, the White Mountain Morainic System in New Hampshire as reported by Thompson et al, Stewart and MacClintock’s major “moraines” near St Johnsbury, and Benningon, and Rutland in the Vermont Valley in southwestern Vermont, De Simone and La Fleur’s ice margin positions 1 and 12 in east central New York, and other locations. I have even gone so far as to consider the possibility that Vermont T3/T4 time might correlate with the Valley Heads moraines in the New York Finger Lakes region, but while I see similarities, such a correlation is a step too far. A second Signature type feature is provided by Scarps at the Late T7 level and time. As discussed below, these are numerous and widespread in the Champlain Basin, and once recognized are easily identified on LiDAR, marking the Lateral Shear Margin of the streaming and calving Champlain lobe ice stream in Late T7 time.
- In general, my deglacial history marker catalog in the Lobate Phase appears to be similar to the features presented in the Quebec (and the New York) report, albeit with some differences. For example, in my April 2026 Addendum study I identified features associated with ice streaming and calving, including lateral shear margins, frontal grounding line markers, and basal streaming flow indicators. Whereas some of these types of features have been found in Quebec, whether or not they collectively dovetail with Vermont features to tell the full Glacial Dynamic story is uncertain. Based on my understanding of Quebec history I would expect that ice streaming and calving would be an important part of this record, particularly with regard to the Glacial Dynamics between the Ontario Basin, the St. Lawrence lowland, and the Champlain Basin.
- As just stated in the above, late T3 and T4 time is well and widely marked across the State of Vermont. For example, in the Memphremagog Basin this margin is marked by numerous and substantial Ice Marginal Channels, stagnant ice deposits, and other features. These features are interpreted as a “Hybrid” type margin, with Ice Marginal Channels representing the active ice component of the margin and associated stagnant ice deposits representing a stagnant ice component. Owing to the insulating property of sediment cover on stagnant ice deposits, these margins were longer lasting, with the active ice margin receding while the stagnant margin remained. Drainage from the stagnant ice margins extended downgradient to the position of the next lower and younger active ice margin. All Vermont margins are believed to have been hybrid types. This interpretation illustrates the ice marginal “system” type thinking similar to that described by Cormier et al in Quebec. The distinction between active and stagnant margins is important in order to understand deglacial history.
- Ice Margin Channels are very numerous in Vermont. I understand they are also common in Quebec, although the Cormier et al presentation does not deal specifically with such features. They are especially numerous in the Memphremagog Basin but are also found in the Champlain Basin. They are interpreted as having formed along active ice margins. They are absent in the Lower and Middle Connecticut Basin owing to “Disconnections, ”related to en masse stagnation as discussed below. And they are associated with “Cold ice,” but in a unique and important way as discussed in the next item below. Ice Marginal Channels are absent in later deglacial times when the ice sheet is believed to have been fully “Warmed” to its base.
- I have pondered and studied Ice Marginal Channels at great length, and have concluded that these features, most notably at the T4 and bottom of the T3 level, position, and time, were formed: 1) at the base of active ice, 2) where and when the basal ice at the ice margin became polythermaly warmed, 3) along an outer fringe portion of the ice sheet margin, 4) with Warm ice over Cold ice over Warm basal ice, essentially an inverted, multilayered polythermal condition, 5) such that hydrostatically confined meltwater at the base of the marginal fringe of the ice sheet became trapped by irregularities in the bedrock controlled terrain (essentially as confined ponded water in fractures at the base of the ice sheet), 6) whereby Ice Marginal Channels formed by erosion along the margin of Cold basal ice, 7) specifically at subglacial “dams,” in a manner analogous to surface water spillways at basin divides but in this case for water beneath the ice sheet base and its crevasses, and 8) further and finally, that this basal ice outer fringe of the ice sheet had become warmed by the readvance of the ice sheet in late T3 and T4 time, across terrain that had been warmed by and during the preceding ice margin recession. I believe that ice margins generally were oscillatory in nature, which helps to account for the formation of a multitude of Ice Marginal Channels at higher levels. However my findings and interpretations suggest that the Ice Marginal Channels at the late T3 and T4 level, time, and position represent markers of a significant readvance, which again correlates with Cormier et al’s “Memphremagog Readvance” in Quebec, readvance evidence across Vermont, and the readvance associated with the White Mountain Morainic System.
- The T4 margin level and time Ice Marginal Channels and stagnant ice deposits are identified as a “Hybrid Margin, ” with Ice margin Channels representing the active ice margin at T4 time at an elevation of about 1400 feet (427 m) and associated numerous and substantial stagnant ice deposits representing the stagnant ice margin at T4 time at an elevation of about 1200 feet (366 m). Drainage evidence indicates that recession of the active ice margin took place with drainage extending downgradient from the stagnant ice deposits to the next lower active ice margin at the T5 level and time, where this drainage was diverted by the active ice margin with T4 stagnant ice margins being persistent and longer lasting than its active ice partner owing to the insulating sediment cover associated with stagnant ice. Again, I believe all ice margins were hybrid types marking the recession of the ice sheet which was progressive, which I liken to a progressively slowly draining bath tub.
- Whereas my mapping in Vermont is based mostly on LiDAR imagery and other surficial geologic map information which generally does not provide information about subsurface stratigraphy or structure which would reveal readvance evidence, I have identified two readvances, the earliest of which as described above at Late T3 and T4 time again may correlate with the “Memphremagog Readvance” in Quebec, as described by Cormier et al. Their “Memphremagog Readvance” margin is depicted as extending into Vermont, but the basis for the delineation of the ice margin for this readvance in Vermont is not given. If, as I assume, the position of this readvance in Vermont is less certain, I would propose to correlate the Memphremagog Readvance in Vermont with my T4 ice margin and the lower part of my T3 ice margin.
- In the Memphremagog Basin, again the lower T3 and T4 margin is marked by numerous Ice Marginal Channels and substantial associated stagnant ice deposits at divides, with neighboring basins, and by over- deepened basins, very much like the Valley Heads System of moraines and basins in the Finger Lakes region of New York. The T4 spillover across basin divides from the Memphremagog Basin into the Connecticut Basin extended downgradient to the Bradford, Vermont vicinity, where the ice mass marks a distinct lobe in the Upper Connecticut Basin, with drainage features into Lake Hitchcock. This lobe then stagnated en mass, representing the third such en masse stagnation event in the Connecticut Basin, when the ice supply from the Memphremagog and Lamoille Basins ceased as the ice sheet retreated and lowered.
- The lower T3 and T4 ice margin in the Upper Connecticut Basin also extended into New Hampshire where it is correlated with and marked by the White Mountain Morainic System (WMMS), as reported by Thompson et al. These investigators identified the WMMS as marking a readvance which they date as 14.0- 13.8 KA BP. Thompson et al’s report of the WMMS indicate that it represents a step-down sequence of deposits across a substantial range of elevations, which correlate well with the lower T3 and T4 levels and times. Thompson et al trace their margin across the State of New Hampshire, adding to the regional perspective.
- The T3 and T4 margins have been identified widely elsewhere in Vermont together in close association, again as a hybrid combination of Ice Marginal Channels and substantial stagnant ice deposits. For example, Stewart and MacClintock identified three major “moraines” in Vermont, specifically in the St Johnsbury, the Rutland, and the Bennington areas, as mentioned above. In my opinion, the St Johnsbury feature is Scabby Terrain related to the Disconnection and associated en masse stagnation of the receding T3/T4 spillover from the Memphremagog Basin. With regard to the Bennington and Rutland features, I map these as massive stagnant ice deposits, not as “moraines,” but this is only a semantic argument. These features are in the Vermont Valley, the floor of which is marked by a nearly continuous succession of stagnant ice deposits indicating that T3 and T4 times are closely related as step-down features. Interestingly, I have identified boring and well log evidence in published reports that comports with and supports a readvance of the T3 and T4 margins in southwestern Vermont in the Bennington and Rutland areas.
- Whereas I believe the Systems identified by Courmier et al generally are correlative with Vermont deglacial history as described by my report, certain details deserve mention:
- The T3 margin in northern Vermont is at an elevation which corresponds with the Frontier Moraine in Quebec, when elevations are adjusted for rebound in accordance with isobase orientations as reported by Parent et Ouchietti. Whereas the distance between these two locations is substantial, such a correlation, while uncertain, makes sense in physiographic and isostasy terms.
- The T4 active and stagnant hybrid ice margin features in the Memphremagog Basin can be traced across the Basin toward the Quebec border to a position very close to the Dixville moraine in Quebec, with the upper Ice Marginal Channels portion of this hybrid margin correlating very well on the basis of position, elevation, and alignment.
- Whereas the Memphremagog Basin shows an interesting step-down sequence from T4 to T6 time, leading to proglacial Lake Memphremagog which had a substantial effect of the ice margin (a “Disaggregated” type margin with multiple large blocks of ice which today are occupied by unusually deep kettle hole type lakes and ponds), this basin became ice free after T6 time. However, an ice lobe in the Champlain Basin remained through later times, owing to the lower elevation of the Champlain basin floor with a more open and direct connection to the parent ice sheet. T6-T8 times in the Champlain and Memphremagog Basins are discussed in detail in my report.
- The T6 margin in the Missisquoi Basin is correlated with the Sutton moraine in Quebec. This is based on positions, elevations, alignment, and what makes physiographic sense. My mapping shows that at this T6 time multiple small, narrow tributary ice lobes extended southward into Vermont from Quebec via small drainage basins, showing a close correspondence with physiography. The T6 ice margin in the main Champlain Basin is mapped as extending southward in the Champlain Basin to the mouth of the Vermont Valley, the flank of the northern nose of the Taconics, and southward in the main Basin floor to the Benson Landing vicinity. Late T6 time was also associated with Coveville Lake Vermont which extended along a narrow “Disaggregated” ice margin corridor along the Champlain lobe margin. As discussed by Chapman (1937) , Wagner (1972) and others, Coveville Lake Vermont only extended northward in the Champlain Basin on the Vermont side to the vicinity of Burlington. Thus, Coveville features are not expected and do not provide a marker in northern Vermont and Quebec.
- T7 time is represented by features showing that calving began in early T7 time when Lake Vermont lowered from the Coveville to the Fort Ann level. (The terms Akawasasne as proposed by Franzi and Candona from Quebec for Fort Ann Lake Vermont are recognized and used interchangeably.) Ice margins in Vermont are identified at “Early T7 time,” “Late T7 time,” “Very Late T7 time,” and “Very Very Late T7 time,” which is an awkward phraseology in which I became trapped and would revise if I were to rewrite my report. However, the point is that the evidence in Vermont indicates rapid recession of the ice margin in Vermont in T7 time, from an early long convex lobe, to a position north of Vermont, in Quebec in Very Very Late T7 time, by a complex array of multiple calving Champlain lobe ice streams, which in time consolidated into a single ice stream in the Trough portion of the Basin floor. Owing to the Glacial Dynamic conditions, including the loss of physiographic buttressing support, this last ice stream rapidly receded from Vermont in an uncertain length of time but which was substantially less than about 800 -1000 years, essentially a “collapse” of the Champlain lobe.
- The position of the ice margin in Very Very Late T7 time in Quebec and thus, of course, is not part of the Vermont record, but is inferred. This margin corresponds with the final ice margin position in Quebec in Lake Candona time immediately prior to the opening for the incursion of the Champlain Sea. As noted above, my sense is that Parent et Ouchietti’s delineation of the ice margin position in late Candona time is only by inference and is not well documented. I was hoping that recent Quebec research might shed light on this ice margin position but do not see this margin in the Cormier et al presentation. It would be helpful to have a documentation of the Candona strandline and its relationship to the ice margin and the position of the ice dam at the time of its collapse leading to the incursion of the Champlain Sea, which was an important time and Glacial Dynamic.
- T8 time in Vermont is interpreted by me as representing a readvance. As noted above, this readvance is well and substantially documented in the Missisquoi Basin by the reports of Cannon (1964) and myself (Wagner , 1972), with both till and ponded water sediments overlying Champlain Sea deltaic topset deposits. Thus, this readvance postdates the early incursion of the Champlain Sea. The margin of this T8 readvance was originally correlated by me with “readvance” evidence reported by Wright in the Charlotte area and by Connally in the Bridport area. Such a correlation in T8 time resulted in an interpretation of a long convex lobe in the Champlain Basin in T8 and Champlain Sea time. As stated above, thanks to questioning by Dave Franzi, I undertook a focused LiDAR and field study of this issue in the spring of 2026, as added to my report as an April 2026 Addendum. This provided remarkable evidence which showed that the Bridport and Charlotte “readvances” were instead associated with lateral shear margins of the rapidly receding Champlain lobe ice stream in Fort Ann (Akawasasne and Candona) time. As stated in my Amended report of April 2026 I now find that the T8 readvance was restricted to the Missisquoi Basin.
- My review of the Cormier, et al Presentation raises the question of the possible correlation of the T8 readvance with the Beauce readvance or Drummondville readvance. The association of the Drummondville readvance with the Champlain Sea, as stated by the authors, suggests that this may correlate with my T8 Vermont ice margins. If so, the possibliity is raised that the Beauce readvance may correlate with the T7 ice margin, but other alternative interpretations are possible. If so, by comparison with my Vermont findings, the Beauce readvance might be associated with Candona strandline features, which is not discussed in the Cormier, et al Presentation.
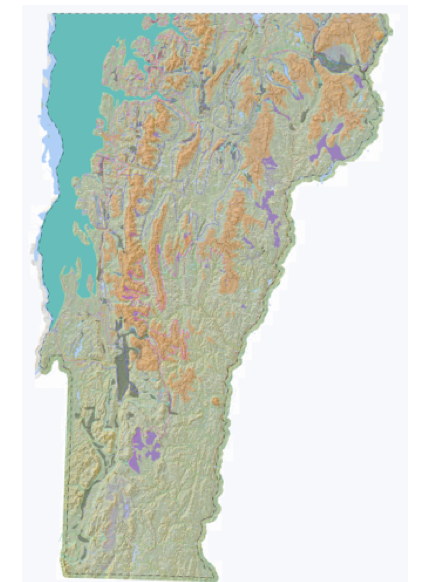
The following maps illustrate the ice sheet coverage and associated ice margin position in Vermont at different T times, including some but not all nunataks:
a. T3 time
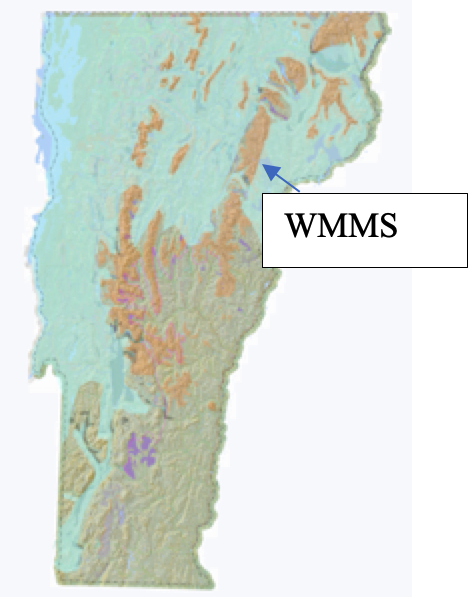
T3 time represents a broad range of elevations transitioning from the Nunatak Phase to the early development of ice lobes confined to major basins in Late T3 time. Much of T3 time is marked by Ice Marginal Channels in the Nunatak Phase,in the Memphremagog Basin at high elevations from about 2000 feet down to about 1400 feet These features are regarded as markers of Active cold ice , perhaps with oscillations that served to warm the outer fringe of the ice sheet.
Also in the Memphremagog Basin, Late T3 Ice Marginal Channels, again marking the active ice margin, are closely related to T4 stagnant ice deposits, marking the associated stagnant ice margin, as a hybrid type ice margin,
In Late T3 and T4 time the ice sheet in the Memphremagog Basin advanced across divides into the Upper Connecticut Basin as marked by features showing ice lobe extending to a lobe tip near Bradford, Vermont, with its margin marked in New Hampshire by the White Mountain Morainic System. Thus, by correlation T3 and T4 time represent a readvance.
In southwestern Vermont the T3 margin is marked by Stewart and MacClintock’s “moraine” in the Vermont Valley at Bennington and by a sublobe on the main Basin floor near Benson Landing.
b. T4 Time
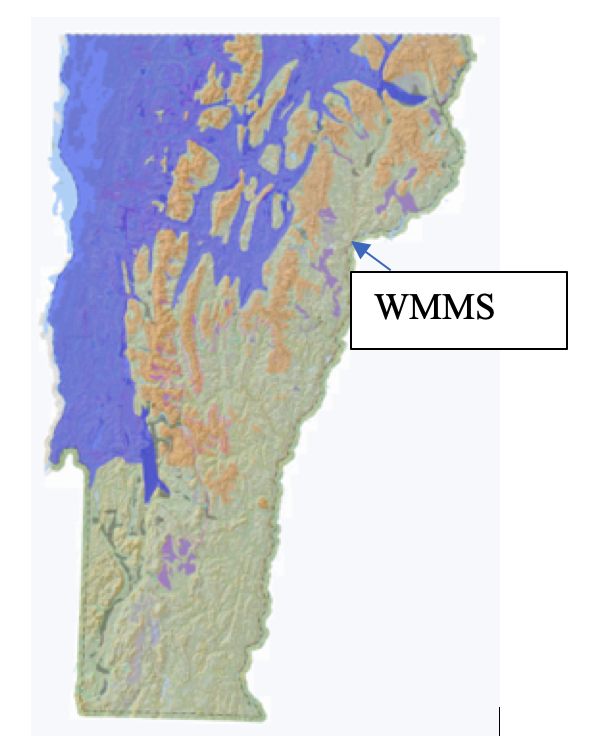
As just stated, in the Memphremagog Basin late T3 time Ice Marginal Channels are closely related to T4 stagnant ice deposits, as a hybrid margin. Lowering of the ice sheet in T4 time resulted in a stagnant ice margin at divides between the Memphremagog Basin and neighboring Lamoille and Connecticut Basins, with en masse stagnation of the former ice lobe in the Upper Connecticut Basin. This lobe, which is not shown on the above map, is marked by Stewart and MacClintock’s St Johnsbury moraine which is here interpreted as Scabby Terrain.
T4 time was closely associated with Lake Winooski in the upland interior of Vermont in the Lamoille and Winooski Basins. In southwestern Vermont the T4 margin stood near Rutland, at the mouth of the Vermont Valley. The T4 margin wrapped around the nose of the Taconics , with the frontal tip of the ice margin in the main floor of the Champlain Basin standing near Benson Landing.
c. T5 time – the margin is not marked on a State-wide map for presentation here but was intermediate between T4 and T6 times.
d. T6 time
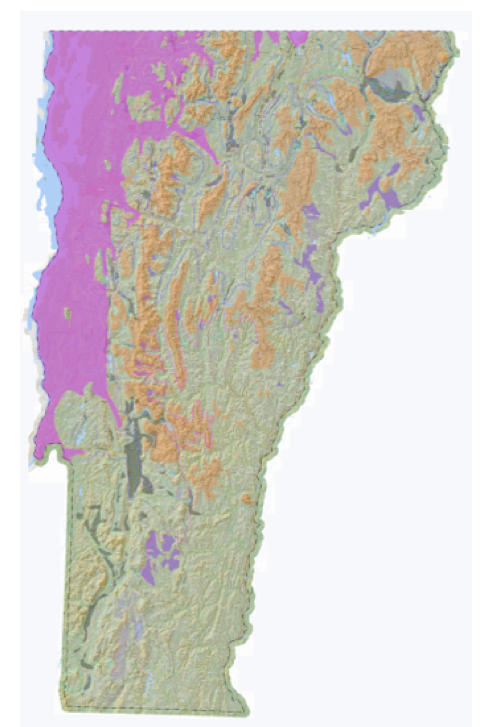
T6 time was part of the stepdown sequence between T4 and T7 times. Late T6 time was associated with Coveville Lake Vermont in a narrow, more or less open water corridor along a “Disconnected” type margin in the Vermont Valley, just north of Rutland, extending around the north of the Taconics, into the main Basin floor near Benson Landing.
e. Late T7 time
The above map depicts the ice margin and ice sheet footprint at Late T7 time. As noted, T 7 time was marked by rapid recession of the ice margin from “Early” to “Very Very Late T7 time” with the latter standing in Quebec when Vermont was ice free. As noted above, my April 2026 Addendum, based on my reexamination of LiDAR and associated field work found features which I have termed “Scarps” and which represent remarkable new evidence representing Lateral Shear Margins, which along with Mega Scale Lineations and Transverse Morainic Ridges document the “collapse” of the Champlain lobe in Vermont in T7 time. The above map represents Late T7 time when the Champlain lobe was largely confined to the Trough portion of the Basin floor.
Late 7 time is discussed elsewhere in regard to the evidence documenting a collapse in late T7 time.
f. T8 time
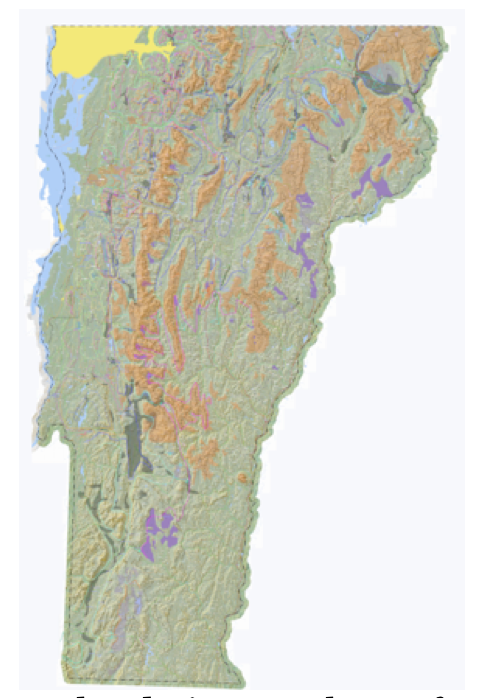
The yellow color designates the T8 footprint, again confined to the floor and north flank of the Missisquoi Basin, as marked by readvance features, and bouldery, fresh-looking ground moraine. The T8 margin clearly postdates the initial Champlain Sea incursion. As noted in my report, Cronin et al have dated this incursion as about 13 KA BP. Thus, the entire Lobate Phase deglacial history of Vermont from T4-T8 time took place in about 800 – 1000 years, between about 14-13.8 and 13 KA BP. Of course, this indicates that the recession of the Champlain lobe in T7 and especially late T7 time took place in an even shorter amount of time, which is astounding, prompting my usage of the term “collapse.” Further, as noted in my original January report: a) recession in T8 time may be marked by Ice Tongue Grooves at the mouth of the Missisquoi Basin which are graded to Champlain Sea features below the marine limit, possibly one of Chapman’s stades, perhaps representing a T9 position, and b) in the northwestern corner of Vermont are linears, possibly suggestive of the ice margin or streaming, which in the case of the former might represent a final T10 ice margin position.
J. New York
As for New York, before delving into the Franzi et al report, I would note that Appendix C of my January 2026 report includes specific details pertaining to the correlation of my T time margins with features in neighboring areas, including Quebec, New York , and New Hampshire. This information is too detailed for inclusion here, but for New York reference is made to a map published by DeSimone and La Fleur from east-central New York State:
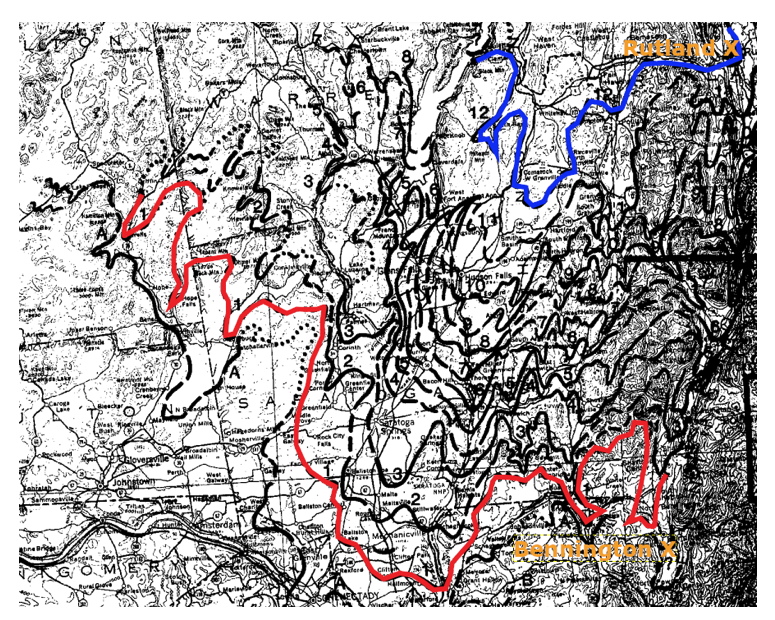
As discussed, the ice margins on this map extend into the Vermont Valley in the Rutland and Bennington areas, showing a remarkable correlation of D & L’s positions 1 (red line) and 12 (blue line) with the Rutland and Bennington moraines of Stewart and MacClintock and my T3 and T4 ice margin positions, respectively. Further, like DeSimone and LaFleurs’ map which shows multiple stepdown positions between their ice margin positions 1 and 12, the floor of the Vermont Valley between Bennington and Rutland is marked by a nearly continuous succession of stagnant ice deposits marking a step-down type recession over a distance of about 60 miles( 90 km). As noted above, my findings for Vermont suggest that late T3 and T4 times were associated and marked by features associated with a significant readvance which I correlate with the White Mountain Morainic System and may as well correlate with Cormier et al’s Memphremaog Readvance. T3/T4 times also are marked by substantial Ice Marginal Channels as part of the aforementioned Signature pattern that is helpful for mapping the late T3 and T4 margins across the State of Vermont. As noted, whereas I have found evidence supporting a readvance of the ice sheet in late T3 and T4 times in the Vermont Valley, DeSimone and LaFleur specifically state that they found no such evidence for their mapping in New York.
Also in Appendix C of my January 2026 report is a discussion of ice margins in New York as provided by maps previously given to me by Franzi. This includes the Ellenburg Depot and Cadyville moraines of Denny, and a map by Franzi et al (2015) showing 15 ice margin positions. I examined these maps as discussed in Appendix C, leading me to relate these to a range of positions from T3 in the south to late T6 and T7 in the north near Covey Hill. However, as noted, I regard this analysis as quite crude and uncertain. As stated:
“The best evidence for correlating ice margins extending across the Champlain Basin between Vermont and New York is when Lake Vermont lowered from the Coveville to Fort Ann levels. In New York, this time is approximately marked by Franzi et al’s ice margin position 15 near Covey Hill, associated with the breakout of Lake Iroquois to Fort Ann.”
In general, this remains an important observation, but whereas I still see the correlation of the ice margin position at Covey Hill with Fort Ann, in light of the rapid recession of the Champlain lobe ice stream in T7 time, from “Early T7 to Very Very Late T7 time,” the specific timing details for this correlation are uncertain. Whereas I attribute the development of calving as being triggered by the lowering of Lake Vermont from Coveville to Fort Ann levels, it is possible that the breakout at Covey Hill may also have been a contributing factor, as also may have been the draining of Lake Mansfield, a large proglacial water body in the upland interior of Vermont, a successor to Lake Winooski as described by Wright et al.
Like Cormier et al for Quebec, Franzi et al present their findings in a map form, and similarly their map identifies many different types of ice margin, directional, and strandline features which relate to my findings for Vermont. In general, the Franzi et al map depicts a more or less continuous ice margin extending southward from Covey Hill in the Champlain Basin. The southern part of the ice margin is very closely associated with the Akawasasne strandline, which suggests a time correlation, but whether or not evidence documenting this correlation exists is not discussed. I take this ice margin as correlating with my T7 margin. As such, I see this Franzi et al ice margin as agreeing with and supporting my delineation of the Champlain lobe ice margin in Fort Ann time as a long convex lobe in T7 time, and as such likely represents “Late T7 time.” This New York margin near Covey Hill represents an ice dam for Lake Iroquois in the Ontario basin, with drainage into Lake Fort Ann again in Late T7 time.
Finally, I would note in regard to Franzi et al’s New York Presentation that:
- As previously stated, the T3 and T4 margin in Vermont was associated with a readvance, and marked by a “Signature” pattern including Ice Marginal Channels. This is important element, but it is unclear if this margin and a readvance is supported in New York other than perhaps by DeSimone and La Fleur’s positions 1 and 12.
- Recession of the Champlain lobe in T7 time in Vermont took place by calving of an ice stream as marked by specific ice margin features such as but not limited to Scarps, with a readvance into the Missisquoi Basin in T8 time, but again it is unclear if the presently available information in New York supports or refutes such an interpretation.
- Likewise, the same can be said for the T8 readvance identified in the Missisquoi Basin in Vermont. It would seem, but is not certain, that the T8 readvance extended into New York.
Whereas I would hope and expect that similar features might exist in both Vermont New York, as previously stated, deglacial history was affected by, for example, differences in physiography. The New York side of the Champlain Basin is not a bi-symmetric mirror image of the Vermont side in that, for example the “Deep Lake” portion of the Basin floor is mostly in New York and New York lacks the Middlebury Bench type terrain, which my findings indicate played a major role in the development of a calving ice stream. As already noted, I have briefly searched for Scarp-type features along the Akawasasne strandline in New York on LiDAR imagery without success, but further study of this is warranted. Also, the New York side of the basin was on the lee side of the predominant ice flow direction, whereas the ice sheet directly abutted against upland areas in Vermont. The full telling of this story awaits input from Franzi and others.