By way of background perspective, the deglacial record in the LaPlatte Basin is important as it provides substantial evidence about the development and recession of a calving ice stream in the Basin. I take this as a model for all re-entrant basins, where similar ice streaming evidence has been found. It also includes evidence reported by Wright interpreted by him as marking a significant readvance. In contrast, Calkin, who mapped glacial deposits in the Middlebury area, including large portions of Little Otter Creek and New Haven River, both re-entrant basins, also recognized features suggestive of a readvance and debated alternative interpretations but concluded these more likely were related to oscillations associated with calving. Further south in the Bridport area, Stewart and MacClintock mapped bouldery silt-clay deposits which their Statewide map shows as extending northward on the floor of the Basin to the Quebec border. They interpreted these deposits as evidence of calving, beginning in the Bridport area and thence proceeding northward, leading to the demise of the Champlain lobe in Vermont. Importantly, I recognized that their bouldery silt-clay deposits near West Bridport occur in a prong-like projection on the Champlain Basin floor in remarkable conformance with the Champlain Sea footprint. Further, also in the West Bridport area, Connally likewise found evidence which he interpreted as his “Bridport Readvance.”
Putting all this evidence together, as noted elsewhere, in my “original report” dated January 2026, I recognized that both Wright’s and Connally’s readvance evidence is in close proximity Champlain Sea features, leading me to correlate these readvance locales with readvance evidence reported by Cannon and myself far to the north in the Missisquoi Basin, in Champlain Sea and my T8 time. Given that the evidence suggested to me that these three readvances locales were closely related to Champlain Sea deposits and time and thus the lowering of the Fort Ann to the Champlain Sea level likely triggered a third calving event which as well was associated with a readvance, though the Missisquoi evidence indicates a readvance after the initial incursion of the Sea. This interpretation and correlation suggested a long convex ice lobe with a readvance at a late glacial time. Whereas this might suggest a significant readvance over a long distance in the Basin, which seemed to me to be unlikely, this issue was resolved by my recognition that the recession of the Champlain lobe was as a long convex ice mass, associated with the development of a long narrow “Disaggregated” eastern ice margin of the Champlain lobe with a more or less open water corridor, and not a flattened lobe as conventionally thought. This configuration meant that a readvance in T8 and Champlain Sea time did not in fact require a substantial readvance distance.
However, as noted elsewhere herein, subsequent personal communications with David Franzi led to doubt about such a long lobe at a late glacial time, prompting this Addendum re-examinati0n.
To give a larger overview introductory perspective, setting the stage for features identified on LiDAR in the LaPlatte Basin and elsewhere and further studied in the field as part of this Addendum study, the screen shot below is taken from my VCGI map at a regional scale showing a substantial portion of the LaPlatte Basin:
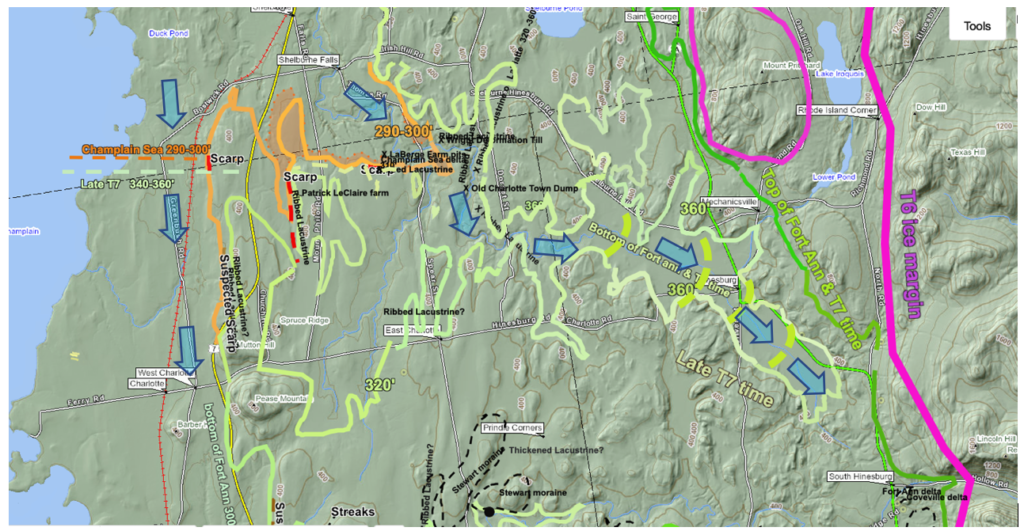
The LaPlatte River on this map extends downgradient in a northwestward direction from the South Hinesburg area to Lake Champlain near Shelburne, with its headwaters just off the map to the southeast near the village of Starksboro. In my previous report, prior to this amendment, based on my study of LiDAR imagery and information from my field work in the 1960s, I identified multiple ice margins in the LaPlatte Basin. These included the T6 margin as marked by the maroon-colored lines, and the T7 margin by the dark green line.
As a side bar, as previously noted, again in my January 2026 report, ice margins in this area tell a complex history:
In my early mapping in the Memphremagog Basin I recognized that ice margins were “hybrid,” with both active and stagnant ice margin components, for example with the T4 stagnant ice margin persisting while the active ice margin receded to a new, lower, T5 level. This led to the concept of a “Style described as, “Everything, Everywhere, All at Once, and Continuing.” As also described previously, Hybrid ice margins were identified in the Champlain Basin, as for example with the T4-T6 step-down ice margin sequence in the vicinity of the LaPlatte Basin and the mouth of the Winooski Basin immediately to the north, with a) the active ice margins associated with Bedrock Grooves on the western flank of the Green Mountains, including at Gillette Pond as an outlet channel for Wright et al’s Lake Mansfield, which drained via Hollow Brook to the Coveville level of a major multi-tiered delta complex at South Hinesburg, and b) stagnant ice margins positions also at T4-T6 time along the foothills. These ice margins in the LaPlatte and nearby areas tell the story about ice recession of both active and stagnant ice margins and as well the presence of local proglacial lakes along the ice margins which progressively lowered and coalesced. This coalescence was significant, with Coveville Lake Vermont developing in late T6 time as a regional water body, along a narrow, more or less open water “Disaggregated ice margin corridor. Changes in the levels of large proglacial water bodies, especially when substantial and sudden, as when the Coveville level lowered to the Fort Ann level, owing to changes in the outlets as an externality, dramatically altered the Champlain lobe. This was an important “Glacial Dynamic interpreted in this Addendum as leading to the collapse of the Champlain lobe. This story has relevance not just to deglacial history but as well to present day concerns about global warming. This lowering in T7 time destabilized the Champlain lobe and initiated calving in the multiple re-entrant tributary basins in the Middlebury Bench, such as the LaPlatte, Otter Creek, and other Basins.
The evidence for calving in the LaPlatte includes Ribbed Lacustrine deposits, Headless Deltas, and Thickened Bouldery Lacustrine deposits. These deposits were mapped, again in my previous report, at the head of the LaPlatte Basin and as well along its sidewalls to the northwest, indicating progressive down-basin, diachronic recession of the LaPlatte ice stream tip in T7 time.
As just stated, these hybrid ice margins were diachronic. For example, the T6 stagnant ice margin stood at the head of the LaPlatte Basin at the Starksboro vicinity (immediately south of the above map area) marked by a major stagnant ice deposit, with an outwash plain leading southward to a major delta at Bristol at the Coveville level. This was followed, still in T6 and Coveville time by ice margin recession to allow for the development of the South Hinesburg Coveville delta, with the late T6 stagnant ice margin marked by a major deposit at the mouth of the Winooski associated with the ice dam for Lake Mansfield in the interior uplands. This deposit persisted with drainage features extending southward into the LaPlatte Basin at the Fort Ann level as marked by Headless Deltas, which in turn were associated with the beginning of calving of the LaPlatte ice stream in early T7 time, and the draining of Lake Mansfield. The recession of the T7 calving margin in the LaPlatte, as just described, thus was diachronic and involved both the active and stagnant ice margins separately as hybrid margins.
Again, whereas the initiation of calving in early T7 time and the lowering of Lake Vermont from the Coveville to the Fort Ann level at the head of the LaPlatte Basin is marked by a major Ribbed Lacustrine deposit and multiple Headless deltas at the Fort Ann level, additional Ribbed Lacustrine and Headless Delta deposits were mapped on VCGI further westward and downgradient on the LaPlatte basin walls, and Thickened Bouldery Lacustrine deposits on the LaPlatte Basin floor, marking the recession of the head of the calving ice stream westward down the basin to a position at the mouth of the LaPlatte along the western margin of the Middlebury Bench, all in late T7 time. To minimize clutter these deposits are not shown on the above map. As a consequence of this temporal and spatial complexity it is challenging to both represent and tell this deglacial history on simple maps for the LaPlatte and other basins.
As can be seen on the above map:
- The T6 (maroon) ice margin extended along the foothills near South Hinesburg, as part of a sublobe in the LaPlatte, which again extended southward to the Starksboro vicinity (off the map to the south) at the head of the LaPlatte Basin, where the margin is marked by a substantial stagnant ice complex, with an outwash plain graded to the major Coveville delta at Bristol. Lake Coveville at this time occupied the narrow, more or less open water corridor associated with the “Disaggregated” T6 margin. As just stated, the T6 margin was diachronic. Further recession in T6 time led to the incursion of Coveville waters into the South Hinesburg vicinity. The major delta at South Hinesburg is multi-leveled with two upper levels marking local step-down proglacial lakes, the third level marking Coveville and the fourth Fort Ann Lake Vermont. The lowering of Lake Vermont to the Fort Ann level at early T7 time initiated calving with the development of the LaPlatte ice stream in the South Hinesburg vicinity as marked by Headless delta deposits at the T6 level, with drainage graded downward to the Fort Ann level.
- The early T7 (dark green) margin on the above map indicates the ice sheet at that time in the LaPlatte Basin occupying a relatively broad area across the Middlebury Bench. In general, the Middlebury Bench is low, rolling, uneven terrain on the Basin floor west of the Green Mountain foothills, and east of the lower “Trough” portion. Many bedrock outcroppings show that this terrain is bedrock controlled, generally with thin, patchy till cover which is thicker in lower portions of the Bench. This contrasts with the re-entrant basins, such as the LaPlatte, in which Ribbed Lacustrine, Headless Delta, and Thickened Bouldery Lacustrine soils and as well scattered stagnant ice deposits are found. These deposits formed in association with the calving LaPlatte ice stream in the Bench, similar to other re-entarnt Basins, with the intervening terrain between the re-entrant basin ice streams serving as buttressing support for the Champlain lobe.
- A late T7 margin (as newly mapped in this Addendum) marked by the light yellow green margin on the above map, indicates a distinct lobe in the LaPlatte Basin, with schematic successive lobe tip positions marked schematically by the dashed green arcuate lobe tip lines showing progressive calving recession down the LaPlatte in T7 time. This recession is again marked by Ribbed Lacustrine and Headless delta deposits along the LaPlatte basin side walls, and by Thickened Bouldery Lacustrine deposits on the Basin floor, but as stated to minimize clutter these individual deposits are not shown. As just indicated, this margin was not delineated in my previous VCGI mapping. The blue arrows are intended to schematically indicate the ice stream in the LaPlatte and again the multiple dashed yellow green arcuate lines schematically suggest the progressive recession of the ice stream lobe tip, leading to the Champlain lobe becoming restricted to the Trough. This recession from the Middlebury Bench was important as a Glacial Dynamic in that the Champlain lobe was then free of the Bench and no longer was buttressed by the Bench terrain, leading to more rapid ice streaming and recession, here interpreted as a “collapse” of the lobe in Vermont.
The following is a second screen shot map from my VCGI mapping at a larger scale on which details in the lower LaPlatte basin in the Middlebury Bench along the eastern edge of the “Trough” are depicted:
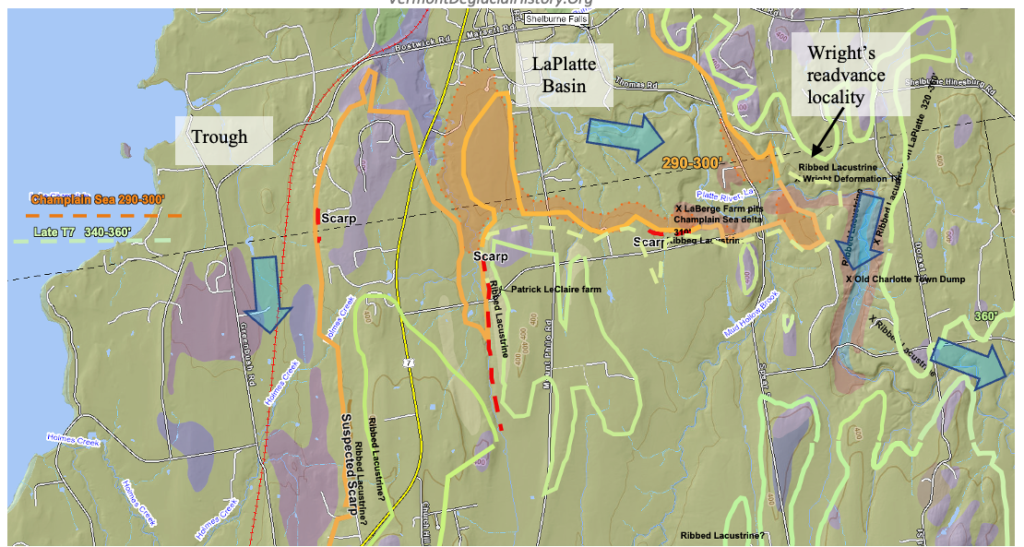
This screen shot is with the VCGI tab for Stewart and MacClintock’s surficial geology map turned on, with the purple shading indicating bedrock-controlled uplands, thin ground moraine and/or silt-clay ponded sediment cover as the olive shading, and the pale red shading as S & Ms’ stagnant ice kame terrace deposits (at the LaBerge Farm and along the LaPlatte just to the east). My VCGI mapping shows a) the Champlain Sea marine limit by the orange line, b) the LaPlatte Champlain Sea delta by the ochre shading, which was associated with T8 time, and c) the late T7 margin as marked by the pale yellow green line. Also shown on this map is the location of Wright’s readvance position, a nearby exposure at the LaBerge farm in the Champlain Sea deltaic deposit, and another location at a Scarp at the LeClaire farm. Still another Scarp is located further to the west, as discussed below. Scarps, as identified and mapped in this Addendum study, are marked by red dashed lines.
In my previous January 2026 report I identified a significant Ribbed Lacustrine deposit near the Town of Charlotte Old Town Dump, which is also marked on the map. This deposit has characteristic ribbing of such deposits, with an upper layer of silt and clay, but a buried stagnant ice core of sand and gravel as identified in a well log and an exposure on the LaPlatte. Stewart and MacClintock mapped this deposit as a kame terrace. In my pre-Addendum interpretation, this deposit was mapped by me at the T7 level and was thought to represent the end of Fort Ann time, closely associated with and followed by the lowering to the Champlain Sea, triggering a third calving event. The pattern of the LaPlatte makes a sudden, sharp turn to the west near this deposit, which was thought to indicate drainage control along the receding ice margin. Immediately to the west on the above map is the Champlain Sea delta (ochre color), as mapped by me in my 1972 report.
At the LaBerge farm, just a short distance to the west of Wright’s readvance locality, is an old mostly slumped pit in the Champlain Sea deltaic deposit. Stewart and MacClintock mapped this as part of their kame terrace. This pit was revisited in 2025, prior to this Addendum, and found to be deltaic, but with coarse pockets of gravel suggestive of the possible close proximity of an ice margin. Further, the upper stratum is a laminated silt-clay layer, which is similar to the veneer on Champlain Sea deltas in the Missisquoi Basin where an upper silt-clay layer was also identified by Cannon (1964) and Wagner (1972), with interbedded till representing a readvance in that basin in my T8 time. Thus, I interpreted the LaPlatte evidence, including Wright’s readvance evidence, as indicating a T8 margin in Champlain Sea time. As stated above, this interpretation, along with readvance evidence at West Bridport, also in Champlain Sea time, was one of the stepping stones leading to the concept of a long convex Champlain lobe with a readvance in T8 time.
Regarding Wright’s readvance evidence, his description suggests that this deposit is in materials resembling deltaic deposits, at an elevation close to the Champlain Sea level. Thus, in my previous report I interpreted this readvance as correlating with the readvance evidence in the Missisquoi and West Bridport areas, again in T8 time and Champlain Sea time, with this margin drawn as a heavy yellow line on my previous VCGI maps.
Again, as part of the Addendum mapping, I identified and mapped the late T7 margin from the LaPlatte Basin southward to the Orwell area marking the southern tip of the Champlain lobe. This identification and mapping of the late T7 margin proved to be fortuitously fortunate, because closer examination in the Addendum study of this late T7 margin on LiDAR led to the discovery of Scarps, which came to be understood, as indicated in the preceding discussion above, as marking the lateral shear margin of calving ice streams, and other calving features.
Whereas the presence of a calving late T7 margin recession as just described in the upper LaPlatte Basin, was recognized and delineated in 2025, this present 2026 examination of VCGI and the discovery of Scarps suggests that the late T7 ice margin likely extended as a lateral shear margin eastward along the dashed light yellow green line into the mouth of the LaPlatte basin in the Bench and as well southward along sloping western flank of the Trough. The sloping Trough flank is an obvious physiographic feature which fits conceptually with the eastern margin of the Champlain lobe as a shear margin. This shear margin is marked by many Scarps (presently 44 Scarps and counting) throughout the Addendum map area, which formed in late T7 and Lake Fort Ann time. The evidence indicates that the T7 lobe in the LaPlatte Basin was an ice stream extending up basin with a receding calving lobe tip, and that this recession led to an ice margin position along the eastern margin of the Trough, marking the lobe margin in later T7 time of a Trough lobe, with a south flowing ice stream. As noted above, the Trough ice stream likely lacked buttressing support of the Bench terrain which may have accelerated flow of the Trough ice stream. Again, blue colored arrows have been added to the above map to indicate the main Basin Trough ice stream versus the upper LaPlatte ice stream.
Several Scarps are identified on LiDAR imagery on the above map. The Scarp at the mouth of the LaPlatte Basin on the Patrick LeClaire farm along the frontal slope of the “Trough” has been examined in the field. The following map is a close-up from VCGI of this Scarp with LiDAR imagery turned on:
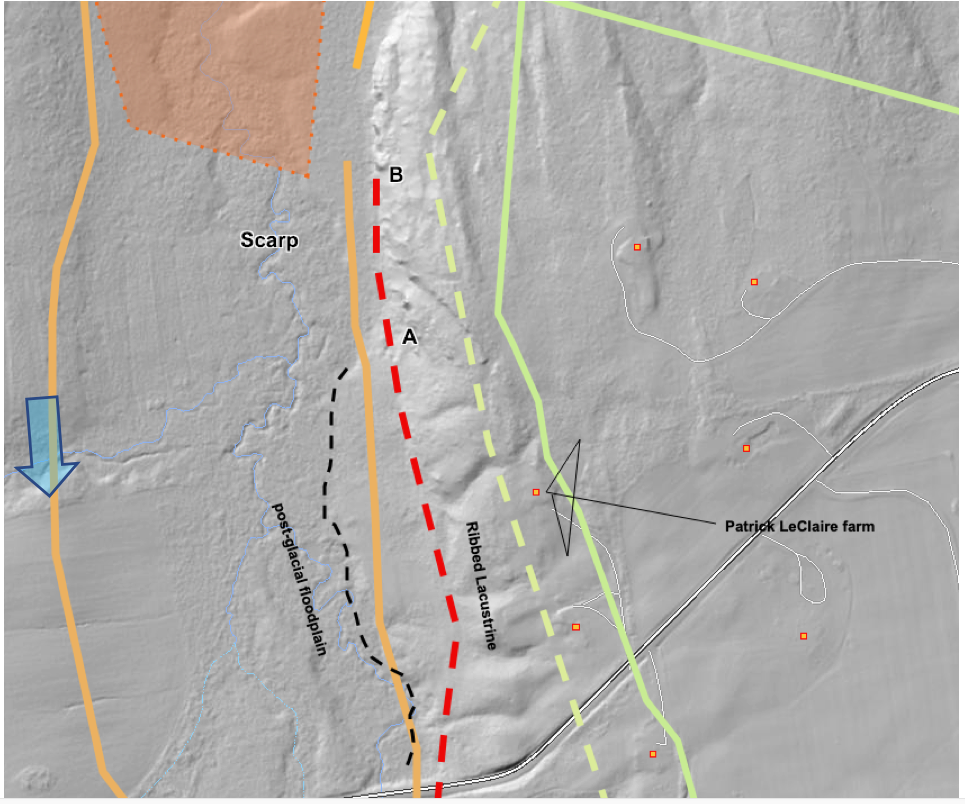
This is associated with and on a suspected Ribbed Lacustrine deposit, with the ribbing strongly evident, and with the Scarp marking the western margin of the deposit. According to the landowner the surface soils in the vicinity are entirely silt-clay. However, excavations for a new septic system showed that these silt-clay soils in the vicinity of the farmhouse are about 4-5 feet (1.2 -1.5 m) thick, beneath which excavations showed a sandy or perhaps sand and gravel type soil. This finding is consistent with and supports the interpretation that this is a Ribbed Lacustrine deposit, in this area marking the late T7 margin. Whereas LiDAR imagery gives a sense of a possible Ribbed Lacustrine deposit with slight kamic topography, in the field the terrain is non-descript, relatively flat, and gently sloping to the west, perhaps slightly rolling or undulatory but with no suggestion of kamic topography. The Ribbed Lacustrine deposit, like many of the locations identified elsewhere with Scarps, is a definite, pronounced bench, the Scarp being on the frontal edge of the bench. Again, the terrain is slightly undulatory, with drainage-like depressions associated with the Ribbing, but these are not marked by soil differences, being part of the silt-clay cover. It is possible that the terrain is very slightly constructional with kamic “dimples” but this would not ordinarily be recognized as associated with stagnant ice.
The frontal face of the Ribbed Lacustrine deposit, immediately west of the farmhouse, corresponds with the Scarp identified on LiDAR imagery. The terrain on the Scarp slopes steeply downward to the west, generally with no topographic evidence suggestive of ice presence. The base of the Scarp, which corresponds with the red dashed line on the above map, likewise corresponds with the juncture between the Ribbed Lacustrine frontal slope and the floor of the small basin occupied by the north-flowing LaPlatte tributary. The terrain west of this break in slope is relatively flat. Postglacial erosion associated with this small tributary has incised a shallow flood plain in the basin floor as can be seen on the LiDAR imagery, with the incision slightly lower and west of the Scarp base. To the north, the base of the Scarp, specifically along the red-dashed line from A to B, is a 30-40-foot-high bedrock cliff face (Monkton Quartzite), at the foot of which is a large mass of boulders and cliff talus. In one location is a small linear ridge, about 100-150 feet (30 – 46 m) long, and perhaps 5-10 feet (1.5 – 3 m) high and 30-50 feet (9 – 15 m) wide, but whether this ridge may be a Lateral Shear Moraine is uncertain. No exposures of subsurface soils were found anywhere along the Scarp base but the ridge appears to be composed of till.
Based on this field study, in conjunction with the literature regarding shear zones, it is believed that this Scarp formed along a Lateral Shear Zone associated with the main Champlain Basin Trough ice stream. Whereas the evidence as summarized above indicates the presence of a calving ice stream extending eastward, up the LaPLatte Basin, as noted previously, the absence of Scarps upstream along the LaPlatte ice stream is taken as indicating less vigorous streaming related to the orientation of the LaPlatte as compared to the main basin Trough.
Wright’s exposure, first examined in 2025, was again revisited in 2026 as part of the field work associated with this Addendum. The exposure is located on a steep embankment on the north side of the LaPlatte River. Whereas his readvance exposure is about 10 meters above the River, there are numerous smaller exposures along the sloping terrain, at different elevations. These exposures show the surficial geologic stratigraphy in this area. The lowest exposures show a distinctive, very compact and dense glacial till which is heavily laden with a colorful variety of rounded pebble size stones, and as well larger, rounded boulders, This till is very similar to the till identified by Wright as a “Lodgement Till.”
Wright, in his report for the Town of Charlotte describes two types of till, one being a “Deformation till” and the other a “Lodgement till.” The following are Wright’s Figures 7 and 8 depicting his “Lodgement Till:”
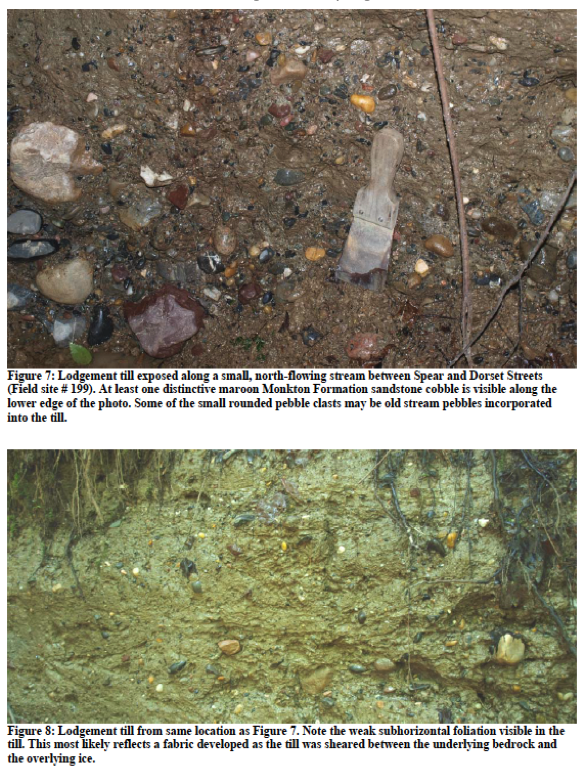
It is noted that in my experience and opinion this till differs from typical Vermont glacial till by the presence of many smaller sized, rounded pebbles. In my experience in mapping Vermont deglacial geology in the 1960s and 1970s this type of till is very unusual. Vermont glacial till typically consists of clasts which are widely varying in size, with angular shapes. Wright in his captions suggests that these pebbles may have been incorporated by the ice as it advanced over previous, older stream gravels.
In the text of his report, Wright describes the “lodgement till “ he observed in the Charlotte area as follows:
Lodgement till is a dense, unlayered diamict with grain sizes ranging from clay to boulders.Pebble, cobble, boulder density is high compared to the deformation till described above and this till frequently contains quite large (several meter diameter) erratics (Fig. 7). A weak subhorizontal foliation (fabric) is sometimes present and visible in rare fresh exposures (Fig. 8). Clasts within this till are sometimes angular, but frequently abrasion against adjacent clasts while the till was deformed (sheared) beneath the ice sheet and/or abrasion against bedrock has produced faceted and semi-rounded clasts. Lodgement till contains frequent erratics. In the western part of town Grenville gneiss erratics are particularly common in till whose matrix consists largely of disaggregated Ordovician shale and limestones. Those same shales and limestones are, respectively, partly or largely composed of calcite and consequently the lodgement till derived from these materials is very rich in calcite as well. Farther east the till contains more sandstone and dolostone reflecting the composition of the older Cambrian and early Ordovician rocks underlying this part of town.
Several aspects of Wrights’ description are of interest. The first is his observation of foliation which he interprets as shearing beneath the ice. Second, Wright recognizes the high limestone content which he attributes to Grenville formation material which outcrops locally in the western part of Charlotte in the area here identified as the “Trough.” Third, he attributes rounding of clasts to “shearing” within the till.
Whereas I have not specifically studied and mapped glacial till in my recent Vermont studies, as just noted above in my 2026 Addendum field work, I revisited the vicinity of Wright’s outcropping along the LaPlatte River where he specifically identified evidence which he interpreted as indication a readvance. I believe that this evidence is instead indicative of shearing along a lateral shear margin of the streaming Champlain lobe in Late T7 time. The following is a photograph taken from an exposure at the base of the embankment at a lower stratigraphic level below Wright’s readvance evidence:
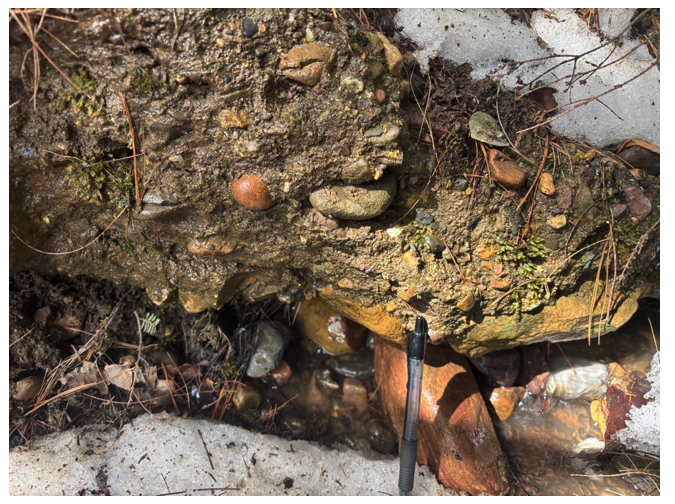
The pen provides a scale showing the sizes of the many rounded clasts within the till. It appears that this is similar to Wright’s description of his “lodgement till.” Also, at the same embankment but above the till are large blocks of highly cemented masses of sand and gravel containing pebbles which are similar looking, with similar lithologies.
In general, it is believed that the till at the base of this exposure corresponds with Wright’s “lodgement till,” which in my opinion formed along the lateral shear margin of the streaming Champlain lobe in Late T7 time. It is further believed that this particular till was formed in conjunction with the Scarp development, with the till produced by shearing in the vicinity of the lateral shear zone which as well caused the deformation in the overlying materials as reported by Wright.
As just noted, the presence of rounded pebbles in the till and the foliated nature as described by Wright are very unusual characteristics for lodgement tills in Vermont in my experience. In my field examination of Scarps at various locations as part of my April Addendum study I have noticed that many Scarps are associated with steeper slopes and commonly with shallow bedrock, likely part of shearing related erosion. Also, the terrain in these areas appears to be mantled by till and discontinuous lacustrine veneer but in some places exposures of the till are similar to the “lodgement till” identified by Wright. Further, erratics scattered on the terrain in Scarp vicinities in places are rounded stones, possibly providing another field mapping tool for the study and delineation of Scarps and lateral shear zones.
Thus, it is concluded, based on the entirety of the evidence from previous VCGI study and as well more recent study of the LaPlatte Basin, that the Wright “Deformation Till” exposure on the LaPlatte is part of the lateral shear margin in late T7 time, and not evidence for a T8 margin in Champlain Sea time, per my previous interpretation. This interpretation eliminates a major argument for ice presence as a long convex lobe in this area in T8 and Champlain Sea time, and as well fits with the findings based on many observations as presented in this Addendum for associated ice streaming as part of the collapse of the Champlain lobe triggered by the lowering of Lake Vermont to the Fort Ann level, again all in late T7 time.
The hillside above the till stratum at Wright’s readvance locality consists predominantly of bottom-set lacustrine material, with intermixed sand and silt layers, and with interbedded pocket-like deposits of other material, including large heavily cemented blocks of sand and gravel. Wright’s deformation evidence is in the upper portion of this stratum.
Exposures near the upper elevations of this same hillside indicate an uppermost third stratum of silt-clay at the terrain surface, which is also shown by Soil Conservation Service soil maps. At the top of the hillside, the terrain flattens, forming a bench. The terrain of this bench is irregular, perhaps slightly kamic, and is crossed by several swales which resemble those found on Ribbed Lacustrine deposits. The topography of this bench is not like a deltaic deposit and is at an elevation slightly above the Champlain Sea delta nearby to the west. Bedrock outcroppings further north indicate this bench is constructed of the above-described materials, as a Ribbed Lacustrine deposit, formed against a bedrock upland.
Owing to slumping, the exposure of the deformed strata identified by Wright is no longer visible. The following is a screen shot of this exposure, taken from Figure 6 of his report:
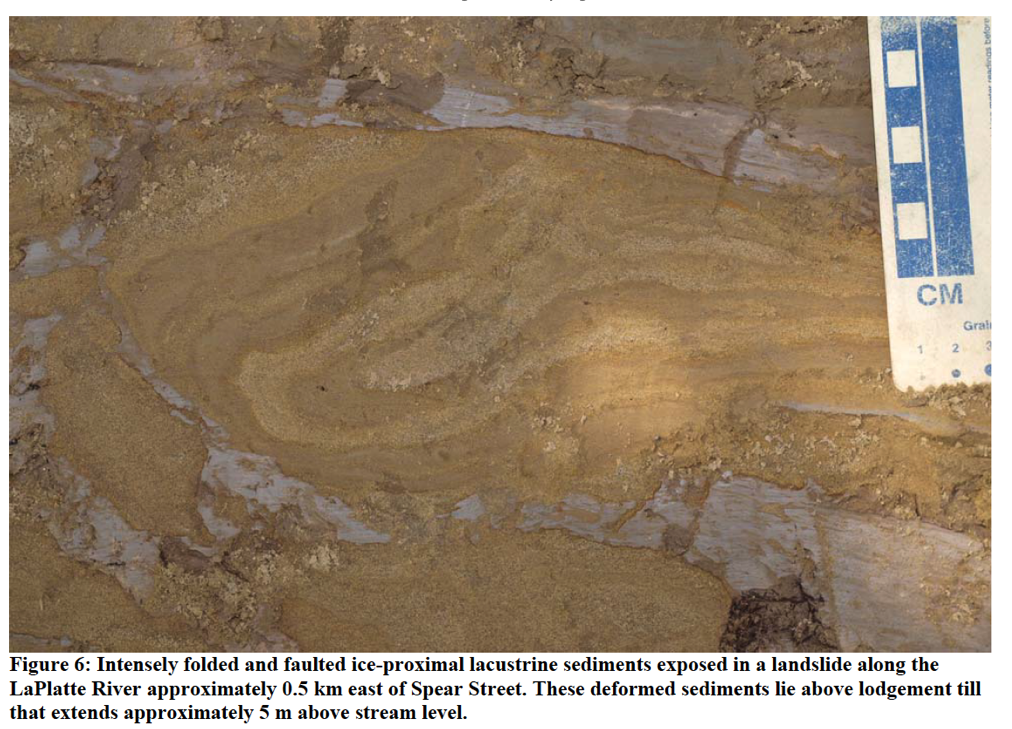
Whereas Wright interpreted this exposure as representative of a “Deformation Till,” which he regards as evidence of a readvance, neither the material in the photo in Wright’s report, nor the material observed in the exposure at this level, can be characterized as a “till,” but instead is consistent with deformation of strata with in the Ribbed Lacustrine deposit, at a lateral shear margin. In fact, Wright’s caption identifies this as “Intensely folded and faulted ice-proximal lacustrine sediments.”
Wright’s exposure is now believed by me to be part of a Ribbed Lacustrine deposit which correlates with the similar nearby deposit along the LaPlatte near the old Town Dump, associated with the late T7 margin. The elevation of the stratum in which the deformation is exposed is above the level of the Champlain Sea. Further, there is no topographic evidence in this Locale which would support the presence of the Champlain Sea delta. Most importantly, the deformation shown in Wright’s Figure 6 is consistent with the description given in the literature of Lateral Shear Zones. The deformation shown in Wrights Figure 6 is at a small scale as can be seen by the centimeter ruler, within the stratification of the lacustrine material. Whereas the three-dimensional shape of the deformed strata cannot be exactly determined from the two dimensional exposure, in general the deformation suggests shear from west to east, as would be expected in a lateral shear zone.
Thus, it is concluded, based on the entirety of the evidence from previous VCGI study and as well more recent study of the LaPlatte Basin that the Wright “Deformation Till” exposure on the LaPlatte is part of the lateral shear margin in late T7 time, and not evidence for a T8 margin in Champlain Sea time. This interpretation eliminates a major argument for ice presence in this area in T8 and Champlain Sea time, and as well fits with the findings based on many observations as presented in this Addendum for associated ice streaming as part of the collapse of the Champlain lobe triggered by the the loss of buttressing support of the Middlebury Bench, again all in late T7 time.
Whereas the focus here is on the LaPlatte Basin at a late time in this Addendum study, the terrain to the west of the LaPlatte, along the margin of the Trough was examined on LiDAR, using the elevation of the Scarps found in the LaPlatte Basin as a guide. Interestingly, this led to the identification of features suggestive of and compatible with Scarps, though the associated presence of Ribbed Lacustrine deposits was only suggested locally. The following is a screenshot of LiDAR imagery in this area:
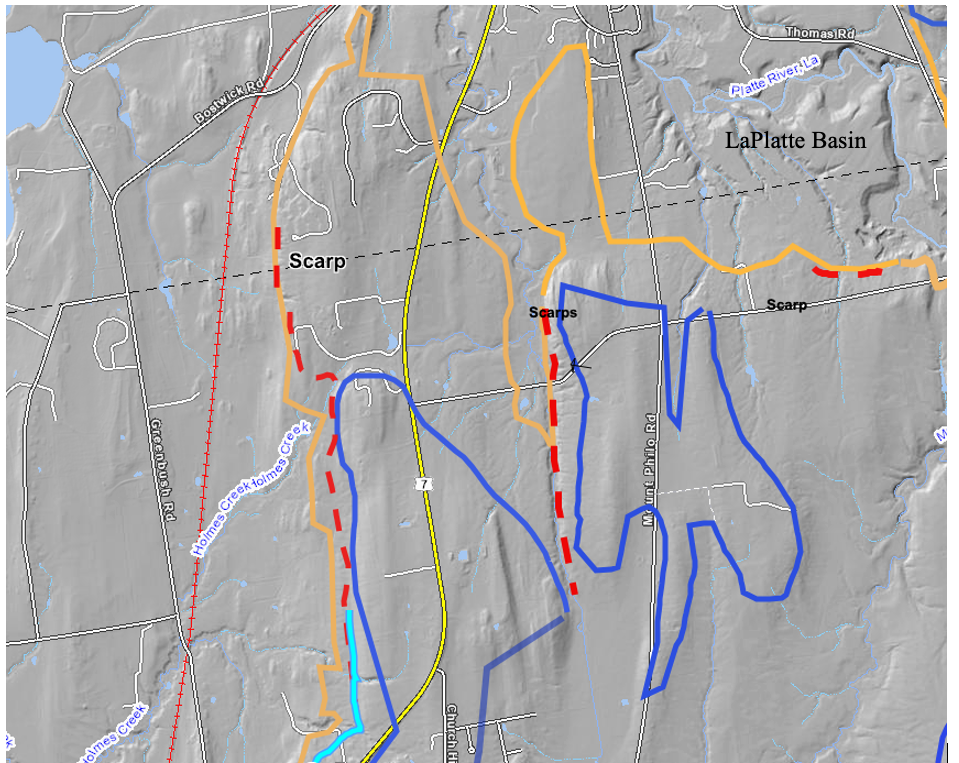
The LaPlatte Basin is marked, including the Scarps previously identified at the mouth of the Basin along the Trough margin. This closer study also suggested a Scarp further to the west. This Scarp is west of Route 7, along the Trough margin associated with a local upland, which is part of the Middelebury Bench. This westernmost, third Scarp is very evident in the field, as marked by a sharply steepened slope. Interestingly, scattered exposures show shallow bedrock which in places is overlain by a similar till as described by Wright as a “Lodgement Till,” with scattered rounded pebbles. Further, even where no exposures are found, scattered erratics tend to include rounded stones. This differs from erratics commonly associated with basal till, which typically includes mostly angular erratics. As previously stated, this observation suggest that the presence and distribution of rounded erratics may provide an additional tool for the identification and mapping of Scarps. These observations also suggest that lateral shear zones associated with Scarps incorporated rounded stones likely formed in tunnels at the base of the ice stream, by shearing into till along the shear margin. This evidence also relates to Mega-Scale Lineations near Vergennes which likewise were identified in the Addendum study. Such features generally are interpreted as shearing associated with lubrication of basal ice on the terrain.
In essence this particular Scarp suggests that ice streaming was not simply along a single ice stream margin but occurred at multiple locations owing to the irregular topography of the Trough floor. Further and intriguingly, as noted above many Scarps have thus far been identified and mapped. These Scarps together suggest ice streaming shear margins (which are close to but not actual markers of the ice margin per se). Interestingly, because so many Scarps are readily identifiable, they give reasonably good definition to ice streams and their boundaries. These seem to be as well associated with curvilinear “Streaks” on LiDAR imagery, suggesting that further study of such features may be fruitful in giving further, even more substantial definition to ice stream “margins.”
The apparent association of Scarps with the distinctive till containing many rounded pebbles and boulders fits with descriptions given in the literature, suggesting that shearing at ice stream margins may incorporate material from the base of the ice sheet, including subglacial fluvial tunnel deposits, into till material along the shear zones. Whereas no field evidence specifically corroborating this has been found, conceptually it is interesting to speculate about possible sources. For example, immediately north of the Winooski River, in the Towns of Essex and Colchester, VCGI mapping has identified long, distinctive, groove-like channels, specifically in the area between Colchester Pond and Indian Brook Reservoir. These channels are mapped in close proximity to the T7 margin , which was associated with Fort Ann Lake Vermont, which fits with the timing of Scarp formation and ice streaming. It is suggested that these channels may have served to handle drainage along or beneath the ice margin, which may have contributed gravel to shear zones and associated till further downgradient to the south, as for example at the Scarps described above in the LaPlatte Basin. But, of course, as already stated, whether or not this might be a source of clasts within these distinctive tills is unknown.