In my original report, which was “finalized” in January 2026, I found and concluded that the Champlain lobe persisted as a long convex lobe in the Champlain Basin in T7 time, continuing into a late glacial (T8) time in conjunction with the Champlain Sea. The concept of a long convex lobe at such late times evolved progressively, almost reluctantly, as a matter of fitting together multiple pieces of evidence. Briefly, the VCGI mapping that led to the January 2026 report identified major elements in my understanding of the deglacial history of the Champlain lobe, as follows:
- In T3 time the Champlain lobe extended southward in the Champlain Basin with a bifurcated lobe tip, with an eastern sublobe in the Vermont Valley marked by an ice margin near Bennington, and a western sublobe in the main basin extending southward, beyond Vermont into New York, with the central portion wrapping around the northern flank of the Taconic uplands. This was the beginning of the “Lobate Phase” of Vermont deglacial history, following the “Nunatak Phase.”
- In ensuing T3-T6 times, the VCGI mapping evidence indicates the progressive, step-down, recession of this ice margin, fronted by local, progressively coalescing and enlarging proglacial lakes. By T6 time the eastern subl0be margin stood near the mouth of the Vermont Valley in the Rutland-Proctor area, and the western sublobe margin was in the Benson Landing area. In essence, much of the Champlain Basin was still occupied by ice in T6 time, as a relatively long, convex lobe. Late T6 time ice margin features are associated with Coveville Lake Vermont. 1 As noted in my previous report, Franzi proposes re-naming Coveville Lake Vermont as “Lake Abenaki” and Fort Ann as “Lake Akawasasne.” I support this name change but use the conventional names here because they are more familiar. deltaic deposits, marking the ultimate coalescence of increasingly larger and more regional proglacial lakes .
- Also as indicated, the VCGI mapping evidence indicates that these deltaic deposits were formed in close proximity to the ice margin, again in late T6 time, leading to the concept of a “Disaggregated Ice Margin,” a type of highly crevassed and fragmented margin as reported in the literature. In my report I suggest that Coveville Lake Vermont occupied a long narrow, more or less open water corridor, that extended progressively northward along the eastern margin of the Disaggregated Champlain lobe margin, with the margin in the Green Mountain foothills, by which the Champlain lobe and its fringe became increasingly convex. And it was surmised that in late T6 time a first phase of calving of the main lobe likely developed, notably on the western margin of the Basin, mostly in New York State, in the “Deep Lake” portion of the basin.
- In early T7 time, again as presented in my January 2026 report, the lowering of Lake Vermont to the Fort Ann level triggered a second phase of calving, with calving taking place both along the lateral eastern margin of the Champlain lobe in the re-entrant basins within the Middlebury Bench, and as well at the frontal tips of both bifurcated main Trough basin ice stream lobe tips along the southern margin of the Champlain lobe. The evidence for this calving includes Ribbed Lacustrine deposits, Headless Deltas, and Thickened Bouldery lacustrine deposits.
- Further, evidence also was found suggesting that the subsequent lowering of Lake Vermont to the Champlain Sea served to trigger a third phase of calving in T8 time. This included evidence both at the mouths of the multiple re-entrant basins along the Champlain lobe eastern margin and as well the south-facing frontal tip of the Champlain lobe. This evidence included:
a. Reports by Cannon (1964) and Wagner (1972), both of who reported evidence of a readvance in the Missisquoi basin, in conjuncti0n with Champlain Sea deposits, interpreted in the January 2026 report as marking the ice margin in T8 time.
b. Evidence reported and interpreted by Wright in the Charlotte area as a readvance was interpreted and likewise reported by me in the January 2026 report as associated with the recession of a calving ice stream in the LaPlatte re-entrant in T8 time.
c. Similarly, Stewart and MacClintock mapped a prong-like extension of bouldery marine silt and clay deposits in the West Bridport area, suggesting these as evidence of calving. These deposits are recognized in my January 2026 report as closely related to the Champlain Sea marine limit. Also in the West Bridport area, Connally reported evidence which he interpreted as a readvance. The exact location of this evidence is not given but was regarded by me as likely fitting with a Champlain Sea and T8 ice margin time.
The summary as just given is intended to set the stage as an overview. In the following, this overview is repeated, in the context of various issues being discussed. Whereas this makes for some redundancy, the goal is to provide a larger understanding and perspective of deglacial history.
Thus, the T7 and T8 margins were interpreted and reported in January 2026 as extending southward in the Champlain Basin, marking a long convex lobe, from the Missisquoi Basin to the Charlotte and Bridport areas, in close association with first Lake Fort Ann and subsequently the Champlain Sea. It needs to be noted that the Missisquoi, Charlotte, and West Bridport features interpreted above at T8 time are not strictly correlative in that the readvance and ice margin presence in the Charlotte and West Bridport areas are interpreted as associated with the opening of the Champlain Sea, in contrast to the Missisquoi features which occurred at a later time after the Sea had already opened. But in general, all three locations were associated with the Champlain Sea and thus broadly fit within T8 time.
As was recognized, this finding of a long convex lobe flies in the face of conventional thinking about the configuration of the receding ice margin, as a flattened lobe, as suggested by Chapman and many other subsequent reports, with the ice margin in Champlain Sea time commonly located north of the border with Quebec. Of course, until this present study the position of the ice margins has been inferred and not directly and explicitly mapped.
Further as discussed above, discussions with David Franzi in the later stages of this study were helpful. David expressed skepticism about the presence of a long convex lobe based on evidence in the New York side of the basin and as well on reported profiles for receding ice sheet lobes which suggest to him that a long convex lobe is physically unsustainable. My response to David was first in regard to the New York evidence that I believe the lobe was “schizophrenic,” with the recession on the New York side of the basin being very different from the Vermont side owing to the physiography of the basin which promoted earlier and more substantial calving on the western side of the basin. And second, I suggested that in regard to his profile argument, the presence of a long convex lobe reflected the lingering presence of ice from its former more substantial extent. And I speculated that perhaps this lobe was mostly stagnant with oscillatory spasms or pulses to account for the “readvance” interpretations reported by Connally in the West Bridport area and Wright in the Charlotte area, in contrast to Missisquoi Basin readvance which seems more substantial.
In any case, the finding of a long, convex lobe is uncertain and, so to speak on “thin ice,” and deserves to be re-examined. The above January 2026 report was completed with the issue regarding the nature, shape, and extent of the receding Champlain lobe in T8 time left unresolved. I thus subsequently decided to take a closer look at this issue, first by closer, more detailed study of VCGI map evidence, especially using LiDAR imagery, followed second by focused field examination of selected critical features. This addendum summarizes these findings.
To help with this introduction, the following map, taken from VCGI, shows a USGS topographic map of the southern portion of the Champlain Basin, with selected ice margins as previously depicted, specifically for T6 and early T7 time.
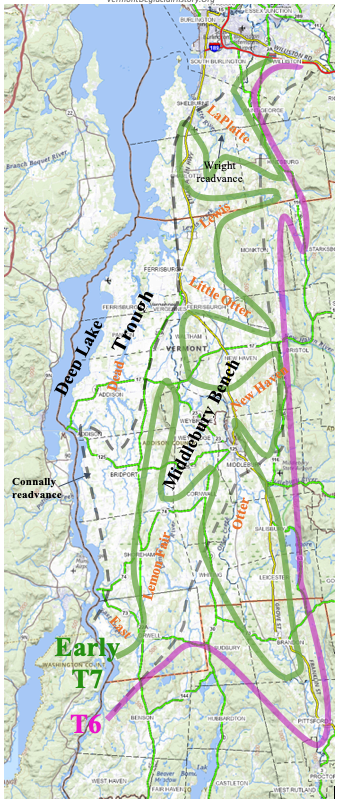
As the above map suggests, the physiography of the Champlain Basin had a profound influence on the Champlain lobe and its ice margins, especially in regard to regional water bodies which were likewise affected by physiography, as depicted on the above map. As explained previously, the Champlain Basin floor in the area of the above map can be subdivided into three distinct portions, specifically the “Middlebury Bench,” “Trough,” and “Deep Lake” areas as marked on the above map. The T5 margin lies at the margin of the Green Mountain foothills east of which are the Green Mountains.
The “Bench,” which lies generally west of the foothills, between the two dashed black lines, is very uneven, low, rolling, largely bedrock controlled terrain, penetrated by multiple “re-entrant basins, including the LaPLatte, Lewis, Little Otter, New Haven, Otter and other sub-basins. The “Trough” is lower flatter terrain on the Champlain Basin floor west of the “Bench.” The border between the Bench and the Trough is a significant and substantial physiographic slope, which greatly influenced the receding Champlain lobe and associated proglacial water body levels, with a calving ice stream (as marked by many “Scarps” and other features identified in this follow-up study as described further below). The western “Deep Lake” portion of the Trough, also as discussed above, is a lower portion of the Basin floor, substantially below the present day level of Lake Champlain and sea level.
Geologically, again per the above map, the maroon colored line represents the T6 margin and the green colored line the early T7 margin. As already noted above in the preceding report, an early phase of calving of the frontal and western portion of the Champlain lobe is suggested to have begun in late T6 and Coveville time, mostly in the western “Deep Lake” sector, mostly in New York, when and while the ice margin on the Vermont side was buttressed by the higher terrain of the Bench on the basin floor. The concept of this early calving seemed reasonable even though no specific data specifically supporting such an early phase of calving had been found. The presence of this early phase of calving helped to explain and account for possible “schizophrenic” differences in the deglacial history between Vermont and New York, and was part of the response given to Franzi with regard to his reservations about a long convex lobe in late glacial time.
In fact, as discussed below, the evidence from this re-examination, as discussed below, indicates that such early calving in late T6 time was not possible. Instead, the new evidence indicates that in T7 time the Champlain lobe extended far to the south, as suggested by the above map, such that calving in the Deep Lake area was not possible at T6 time. Instead, again based on the new evidence, the lowering of water levels from Coveville to Fort Ann levels in early T7 time triggered the beginning of calving and associated ice streaming of the long convex T7 lobe, leading to the collapse and demise of the ice sheet in Vermont by rapid ice margin calving recession to and beyond the Quebec border by the end of T7 time. The evidence as presented below documents this calving and collapse of the Champlain lobe, which again was triggered by proglacial water level lowering from Coveville to Fort Ann levels, though, as noted above in my earlier report, may also have been affected by the draining of Lake Mansfield and the breakout of Lake Iroquois in the Ontario Basin into the Champlain Basin at Covey Hill.
The usage of the term “collapse” is significant and introduced here guardedly, particularly with regard to the implications of the term for modern day global warming. It is difficult to identify and document a “collapse” of the ice sheet when dealing with the record of past glaciations. However, the recession of the Champlain lobe as just described comes as close as possible to representing a collapse. The evidence indicates that the recession of the lobe from the basin from its long convex shape as marked by the early T7 margin on the above map took place by a calving ice stream. The new information found here provides substantial evidence further documenting this recession by a calving margin along both the lateral and frontal margins of the Champlain lobe. This took place in a reverse gradient setting. Such settings are recognized to cause instability. Whereas the Middlebury Bench and Lake Vermont served to buttress this ice lobe in early T7 time, the calving of this narrowed ice stream in late T7 time, already destabilized by the lowering from the Coveville to the Fort Ann level, likely removed or reduced this buttressing support, causing the more rapid, accelerated recession of this Champlain lobe ice stream. Further, as suggested previously, a) the T3-T4 margin is correlated with the White Mountain Morainic System which has been dated to be about 13,800 -14,000 years BP, and b) the opening of the Champlain Sea in Vermont has been dated as about 13,000 years BP. Thus, the entirety of this recession likely took place in less than 1000 years, which in geological terms is quite short. Again, this is about as close as one can get to the documentation of a “collapse.” In this context, the findings here for the demise of the Champlain lobe provide helpful information about the nature of a “collapse.” The previous, pre-January 2026 report presents a discussion pertaining to the insights to be gained from this study. This addendum serves both to further document the deglacial history and as well the nature of such a collapse.
The map and discussion in the above is intended to give an introductory overview perspective of physiography and associated drainage basins and as well the ice margins for T6 and early T7 time, and to show the locations of interest in this addendum study. Both the T6 and T7 ice margins depicted on this map are drawn crudely and approximately, intended only to give a general sense of the associated setting and history. More accurate margins are delineated on VCGI maps that served as the basis for my January 2026 and this subsequent Addendum report.
By way of organizational overview, this Addendum provides three types of information, per the following sections:
- LiDAR imagery evidence
- Evidence from focused field examination of selected Locales
- A summary overview of the findings.