A. Introduction
As stated above, this is a report on Vermont’s Deglacial History, Styles, and Glacial Dynamics, with the history based on the assumption that the Bath Tub Model is a valid and reliable basis for correlating ice margin features having similar elevations. Application of this methodology leads to the identification of specific associated ice margin elevation levels, positions, and times, all in a relative chronology ranging from T1 to T8, as summarized and presented in tabular, map, and narrative formats as discussed below. More detailed information in support of the findings is given in specific “Locales” in Appendix 2, which also includes a map showing all Locale locations, and as well various details are provided in the preceding text in support of the findings given here.
The history presented here is based on information developed by usage of the online services of the Vermont Center for Geographic Information(VCGI) to identify, map, and correlate ice margin features. This service provides users with access to a wide array of information, such as LiDAR imagery, and published information regarding Vermont geology, soils, and other relevant information. VCGI is accessible and viewable online at the following link:
https://maps.vermont.gov/vcgi/html5viewer/?viewer=VCGI_IMV_v7.VCGI_IMV_Viewer_HTML&project=273d22a9a28f4d9191bb1a7a10e8107c&link=6065f1a7ee2648c3a16e8158b082efa1_40RtRPlto_iBBl-u
VCGI allows users to compile information on a “Project Sheet,”which in essence represents an online “field map.” My Project Sheet includes markings of ice margin features as described above along with miscellaneous notes and observations. The Project Sheet can be viewed at a range of scales, with the ability to zoom in for extremely detailed, close-up views. Elevations of features on the Project Sheet for ice margin features and levels are taken from VCGI provided USGS topographic maps. Elevations recorded on VCGI maps are “Local” levels. Many of these are adjusted to make corrections for isostatic rebound using the Quebec border as the reference point to provide corrected elevations showing the topography as it existed prior to rebound, which was then used for correlating and differentiating features formed at the same times and levels. 1 Adjusted levels are marked on VCGI by giving the local, present day elevation, plus an additional elevation to correct for isostatic differences, again using the distance to the Quebec border as the reference for a correction factor at a slope of 5 feet per mile along a north-south transect. As discussed above, future revisions of the isostatic correction factor may be warranted, but this is not believed likely to change the findings in a major way.
The VCGI Project Sheet developed from research reported here can be can be viewed with a link, which can be made available. However, as is the nature of all such technology, VCGI is based on a geographic information system that is becoming outdated, with new versions presently in development. Unfortunately the next new version, scheduled for Spring 2026, will be incompatible with the present version, such that when VCGI converts its system, the older version, including the Project Sheet used for the study reported here, will no longer be available. The present VCGI Project Sheet can be preserved by usage of an extremely tedious method of stitching together many screen shots, which generates a pdf file, which can be shared but is no longer accessible online and can not be modified and updated on VCGI. My VCGI Project Sheet is available as a digital file created by GIMP, as of 1/1/2026, which can be converted into a JPEG, pdf, or other file format. Of course, any new added information or changes made to the Project Sheet after this date will not be included.
My mapping, which began two plus years ago, used the Project Sheet as an ongoing “field” map on which all pertinent information was added, with various pertinent notes and markings. As noted elsewhere, thanks to numerous, ongoing epiphanies, I returned to this Project Sheet frequently on an ongoing basis, resulting in many modifications and versions, with copious notes added as the mapping progressed. The screen shot below is taken from the stitched-together Project Sheet, and of course again is subject to change in the event that additional information is obtained. The present version of this stitched together Project Sheet is a very large file size (nearly 500 mb), hence the usage of a screen shot here. However, again, the latest 1/1/26 version of the Project Sheet can be made available upon request.
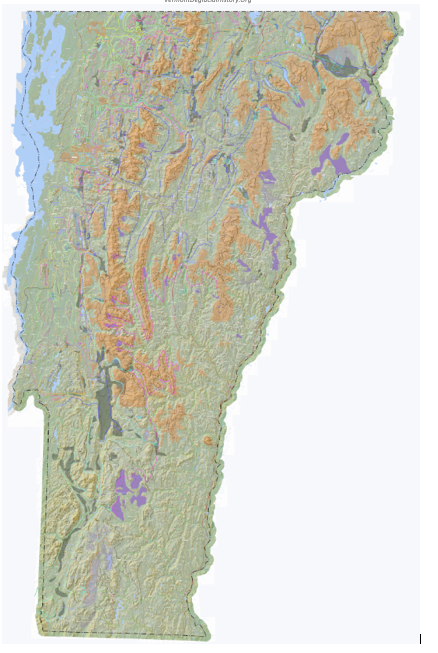
This map contains an enormous amount of information, representing all the information learned from VCGI mapping and as well notes added or based on both my previous mapping in the 1960s and 1970s, and as well more recent spot field checking. The mapping of ice margin features and associated proglacial water bodies on VCGI generated considerable detail on the VCGI Project Sheet. Unfortunately, scale limitations make this screen shot of the 12/31/25 version difficult to read, and is included here to primarily symbolize the data base which led to the interpretations given in this report.
Whereas Vermont and regional deglacial history is discussed in detail in subsections below, jumping ahead momentarily to give a preview sense of Vermont’s deglacial history learned from VCGI mapping, the following is a screen shot of a deglacial history map based on the VCGI finding. This map shows the receding positions of the ice margin and the associated ice sheet coverage for various times as deglaciation proceeded. This is not the full deglacial history story which is presented below. For example, this map does not show the footprints of various proglacial water bodies. Nor does it include correlations with neighboring regions in New York, Quebec, and New Hampshire. But it gives a general overview sense of the larger scale perspective of the deglacial history taken directly from the Project Sheet:
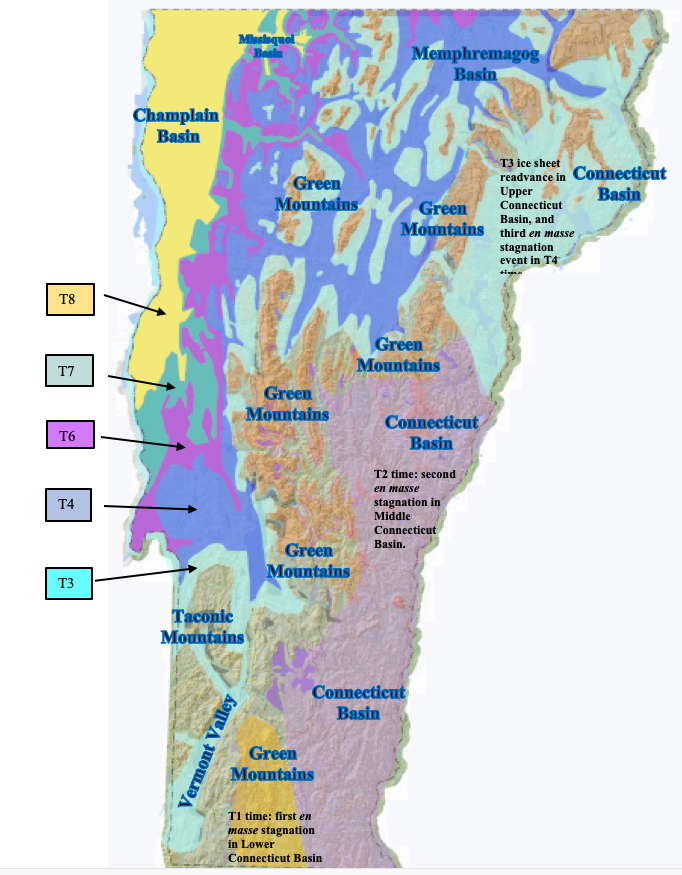
The following comments pertain to the above map:
- The Vermont State boundary marks the perimeter of the above map.
- The earliest ice margin depicted on the above map represents T3 time, which is not the earliest deglacial history available from VCGI mapping. T3 time represents the beginning of the Lobate Phase. However, earlier and higher deglacial history is marked by Ice Marginal Channels and other features in the Nunatak Phase, which is identified by features on the above map, but these are not correlated and thus not delineated Also, whereas the T3 ice sheet on the above map gives a sense of the ice sheet coverage in T3 time, the ice sheet in T1 and T2 times extended across all of Vermont, with only mountain peaks emerging as nunataks. As marked by Scabby Terrain, in earlier T1 and T2 times, the Champlain lobe surface lowered such that ice supply across low cols along divides between the Vermont Valley and the Connecticut Basins ended, in two en masse stagnation events, first in the Lower Connecticut Basin in T1 time, followed by a second en masse stagnation in the Middle Connecticut Basin in T2 time. Some but not all Scabby Terrain for these events and times is evident on the above map.
- The T3 margin is correlated with the upper, older portion of the White Mountain Moraine System in New Hampshire. This is significant in that the WMMS is interpreted as representing a significant readvance. The T3 readvance margin is shown here as extending southward in the Upper Connecticut Basin to the Bradford vicinity where the ice margin is marked by features with drainage linked to Lake Hitchcock (not shown).
- Ice sheet recession then led to the T4 ice margin as identified above. T4 time represents a significant and well-marked “Signature” margin in Vermont. For example, in the Memphremagog Basin ice margin features at the T4 level are extensive along basin divides between the Connecticut and Lamoille Basins. The T4 margin is correlated with the lower, younger portion of the WMMS and with the Dixville moraine in Quebec. The T3 ice mass in the Upper Connecticut Basin stagnated en masse in T4 time, representing the third en masse stagnation event in the Connecticut Basin. Also, in the Vermont Valley, the T4 margin is marked by a major ice margin feature at Rutland near the mouth of the Vermont Valley; the T3 margin in the Vermont Valley is marked by another, older feature in the Bennington vicinity. As discussed below the T3 and T4 margins are correlated with ice margins reported by others in New York.
- The T5 margin is not delineated on the above map owing to scale limitations, but was intermediate between the T4 and T6 margins.
- T4 to T6 times are marked by a step-down pattern of receding ice margin features, including local proglacial lakes which progressively expanded and coalesced leading to Lake Winooski (and its successor Lake Mansfield) in the Winooski and Lamoille Basins, in T4 to T7 time, and Coveville Lake Vermont in the Champlain Basin in T 6 time. Again, owing to scale limitations, and for the sake of simplicity, these water bodies are not shown on the above map. As discussed below, an early phase of calving is believed to have led to a large open water area in the lower, western portion of the Champlain Basin floor in early T6 time. The T6 ice margin is correlated with the Sutton moraine in Quebec.
- T7 time was associated with the lowering of Lake Vermont from the Coveville to the Fort Ann level, which again is not shown on the above map. However, the early T 6 to T7 margins were closely associated with and essentially controlled by these water bodies. The evidence indicates that the Coveville to Fort Ann lowering triggered a second phase of calving in the Middlebury Bench. In T7 time the eastern ice margin was fronted by a long narrow “Disaggregated:,”more or less open water corridor, which progressively extended northward, eventually leading to the termination of Fort Ann and the incursion of Champlain Sea waters, triggering a third calving event. The evidence indicates that eastern margin of the Champlain lobe became destabilized, transforming from a lateral to a frontal margin at this time. The Fort Ann corridor in T7 time is faintly visible on the above map. Fort Ann Lake Vermont was also marked by a large open water area in the western portion of the Champlain Basin floor, extending northward to the breakout identified by others for Lake Iroquois at Covey Hill into the Champlain Basin. Again, this Fort Ann open water area is not shown on the above map.
- By T8 time the ice sheet is well marked by ice margin features in the Missisquoi Basin, where previously published evidence by Cannon (1964) and Wagner (1972) indicates a significant readvance in Champlain Sea time, after the initial incursion by the Sea. Further, the evidence suggests that the T8 margin extended far to the south in the Champlain Basin, perhaps, as suggested here, correlating with reported readvance evidence by Wright in the Charlotte area and by Connally in the Bridport area, and as well by other calving ice margin features as discussed in this report. Also, as discussed, whether or not the Charlotte and Bridport T8 lobe “readvances” represented an extension of the T8 ice sheet as a long, convex active ice mass, as shown on the above map, versus alternatively a brief reactivated “spasm” pulse associated with the collapse of a stagnant mass of the ice sheet is not resolved. Beyond deglacial history, this issue having to do with the nature of the “collapse” of the Champlain lobe represents one of the more important elements of the findings reported here, bearing on present day concerns for global warming.
Again, the immediately preceding overview is intended to provide an introduction to deglacial history discussion presented in the following.
As noted the above map gives only a general sense of the deglacial history. To generate statewide maps of the different ice margins marking the deglacial history of Vermont, the VCGI map with its ice margins was used as a visual guide to manually trace ice margins onto a suitable base map showing the physiography of the State of Vermont as an entity. This is a tedious, cumbersome process, and only gives approximate ice margin locations on the Statewide map as compared to the VCGI map. Of course, again, the VCGI map can be referred to for details, so long as available online, or by the “stitched copy of the Project Sheet. In as much as the study reported here represents the first statewide deglacial history of Vermont, specific details are given by many examples throughout this report and as well in Appendix 2. For emphasis and to be made clear, it is again stated that the ice margins and proglacial lake footprints presented below on regional maps are only imprecise approximations and intentionally schematic, intended to illustrate the general concepts.
The base map used for the development of the statewide ice margin maps presented below was taken from the following online source: www https:// en-ca.topographic-map.com/map-z4c3q/Quebec/?center=44.99106%2C-72.41132&zoom=15&overlay=0&base=2&popup=44.99257%2C-72.4072
The following were added to the Statewide map:
- The Vermont State boundary marked by a heavy dashed black line.
- For physiological perspective, 1) the present day 2000 foot(610 m) elevation contours across the State, marked by dark brown lines, and 2) major drainage basins, as shown on the following map, marked by yellow lines, including:
- Champlain Basin
- Memphremagog Basin
- Connecticut Basin, which is divided into the Upper Connecticut portion(includes the Passumpsic basin), the Middle Connecticut portion( includes the Stevens, Wells, Waits, Ompompanoosuc, White, Ottauquechee, Black, West, Williams, and Saxton basins) portion, and the lower Connecticut(Deerfield) portionHudson/Hoosic Basin
- Hudson/Hoosic Basin
- Metawee Basin

Obviously, present day physiography differed slightly from deglacial times owing to isostatic rebound, but the above base map and markings give a sense of the terrain in late glacial times. The ability to understand and visualize drainage basins is very important in as much as these were occupied by increasingly discrete ice lobes during deglaciation.
3. Moraines or ice margin positions in Quebec, New York, and New Hampshire, based on information taken from published literature as identified below. More detailed information related to these features is given in Appendix 1.
4. The footprint of regional proglacial Coveville and Fort Ann Lake Vermont, and large, but local proglacial Lakes Winooski and Mansfield in the Winooski/Lamoille Basins in pale blue shading. Again, the sources for this information is provided when and where appropriate, but generally came from Chapman, Wagner (1972), and Springston