The concept of paradigms is a recurrent topic in this report. In some respects I am as much interested in how we think as to what we think about deglacial history. In the Preface to this report I stated: “Paradigms are powerful ways of processing information, at the very heart of human thinking. But at times they limit our ability to see and understand what is before our eyes.” I am convinced that paradigms are profoundly important in the deciphering of deglacial history, that the past thinking of the deglacial history of Vermont reflects paradigm-ic biases, just as this report so too reflects paradigm-ic thinking. Paradigms are unavoidable ways of thinking. We all use them, succeed with them when we solve a history puzzle about a long ago time, and as well are trapped by them, generally without our being aware of their being a part of our thinking,
We can see the paradigm-ic model underlying the thinking of Stewart and MacClintock with their perception of flow directions as the basis for historical deduction. Chapman’s maps of Coveville, Fort Ann, and Champlain Sea, showing the progressive positions of the associated ice margins reflects his paradigm-ic preconception that the recession of the ice sheet generally was northward. Parent et Occhietti, who have been very bold in exploring deglacial history, and have been quite helpful to me, helping me see new ways of thinking about these matters, nevertheless have their own paradigm-ic constructs. As discussed elsewhere herein this is reflected in their positioning of the northern margin of their Lake Candona (Fort Ann in Quebec), not so much based on data but by inference, which is to say the way they think about ice margin recession. We all of us have no choice but to do as best we can, sort of like looking at our Bath Tub or whatever model we are using, forcing us to blink our eyes to try to then look once again at the data before us with fresh eyes.
These observations are not meant to be critical or judgmental or fault-finding. We all of us by our nature are trapped by the ways our brains our wired to process information, in this case the interpretation of deglacial history. Franzi’s recent revision of the Champlain Basin water body history, with his recognition of the variable and diachronic nature of strandlines is an example of his coming to realize that our (meanng all of us) way of thinking about these strandlines as timelines has been incorrect, (meaning all these years since Chapman first opened our eyes to this subject in the late 1930s). Franzi introduces a “paradigm shift” The full implications of which have yet to be explored.
For me, I too have struggled to overcome my paradigm-ic preconception about the nature of ice sheet margins and their recession. In the past I tended to think of ice margins as relatively simple, solid boundaries, like simple lines on a map, which receded progressively northward. As my examination of the evidence on VCGI progressed and my information gathering continued, I began to encounter difficulties that forced me to challenge my mental model, to see other possibilities. I now recognize that ice margins were not like simple lines on maps, and the northward recession likewise was not so simple. It was only late in the writing of this report that I began to see the evidence differently. In fact, report writing and head scratching became intertwined and more protracted, requiring multiple report revisions. I would give two examples.
The first example has to do, as just stated, with the thinking that ice margins are like lines on a map. This story is relatively complicated, having to do with the recession of the ice margin involving the opening of the Winooski Basin which as explained above was quite complex, but simply put:
- The South Hinesburg delta at the Coveville level, which is a major deposit, was formed by drainage from Lake Mansfield, which required an ice dam across the mouth of the Winooski Basin, at a location north of the of South Hinesburg delta.
- However, my VCGI mapping evidence showed that the Bristol delta, which is south of the South Hinesburg delta, also at the Coveville level, and also a major deposit, showed that this delta was formed by outwash from an ice margin at Starksboro, which is south of South Hinesburg.
How could the ice margin be both north and south of the South Hinesburg delta at the same time? The answer turned out to be relatively complex as discussed above in regard to the calving margin recession and Ice Tongue Grooves in that area. But simply put, the answer is that the margin was not a simple line on the map, but in fact was a hybrid margin with both active and stagnant ice components, that these were spatially and temporally overlapping, and that this margin was not and could not be depicted as a simple line on a map but instead was a “dissaggregated labyrintihian complex in a narrow, more or less open water corridor” or some such words to that effect as used in my explanation in the above with regard to calving margins and Ice Tongue Grooves.
The second example has to do with my tendency to think of the recession of the ice margin more generally in the Champlain Basin as proceeding from from south to north. I struggled with this in many ways. This is a terrible paradigm hang up, meaning quite potent and tending to lead me down totally incorrect thinking. I still find myself stuck in this mental rut. This has to do with evidence from three locations: the Missisquoi Basin, Charlotte, and Bridport. Again simply put, Connally reported an ice margin readvance in the Bridport area, similarly Wright presented evidence he interpreted as evidence of a readvance of the ice margin in the Charlotte area, and both my own evidence from the 1970s and likewise Cannon before me indicated a readvance in the Missisquoi Basin. The readvance evidence in all three of these locations is at approximately the level and presumably time of the Champlain Sea maximum. One possible interpretation could be an ice readvance from the Missisquoi Basin, past Charlotte, to the Bridport area, a distance of about 80 miles. This would be huge, preposterously so, and not plausible. In all my detailed mapping in the 1970s I had not seen any evidence to support a readvance of that scale. Even Cannon, who did some great mapping in the Missisquoi Basin with intriguing insights, found the idea of a readvance even locally in the Missisquoi Basin in Champlain Sea time, despite the evidence he found, too much to believe. Cannon and I both had a paradigm mental block, a form of constipation that has yet to be fully understood by medical science but has long been recognized by philosophers.
Thus, faced with my paradigm-ic bias, I was inclined to regard Connally and Wright’s evidence of readvances as local oscillations, just as had been suggested by Calkin, which in fact may be the case. But still, how could the ice margins be in these three locations at the same Champlain Sea time? Eventually I came to realize that this problem was the result of my built in paradigm-ic thinking, that the recession of the ice margin was south to north. If instead the ice sheet in the Champlain Basin was a long convex lobe, this model would accommodate a readvance in T8 time with the ice margin in the Missisquoi Basin, with ice margin “oscillations” far to the south, all at the same time without requiring a long distance readvance of the ice sheet. And, of course, as a bonus my failure to find evidence of such a readvance in my mapping in the 1970s was likewise resolved. This change in my paradigm model not only solved the long distance readvance dilemma, but as well fit the growing evidence that showed that the ice margin recession, for example in the LaPlatte re-entrant basin, was predominantly westerly, a kind of shrinking of the convex lobe, from Coveville to Fort Ann to Champlain Sea times, consistent with such a lobe.
These examples illustrate the challenge of “Paradigm Traps.” In time I came to recognize that, just as suggested by Franzi, not only were the Champlain Basin proglacial strandlines diachronic, so too were the T time ice margin boundaries diachronic. This recognition is reflected by my usage of terms like “early T6” versus “late T6.”
Deciphering deglacial history, it turns out, is not a simple proposition, sort of like analogous to the lining up rubber duckies in single file in a bathtub, so to speak. If an analogy is to be made with the Bath Tub Model it entails both spatial and temporal variations, which goes way beyond simple rubber duckie type thinking. Whereas the recession of the ice margin in the Champlain Basin in Vermont was both south to north and east to west in Fort Ann time, so too the ice margin receded to extend the Fort Ann (Lake Candona) corridor into Quebec, presumably expanding progressively eastward along the Quebec Piedmont until the ice sheet opened to allow the corridor to drain. This presumably took place in Vermont after T7 time but before T8 time, with early delta formation in the Missisquoi Basin at the Champlain Sea marine limit level before a readvance in T8 time. The extent of the recession prior to T8 time, meaning the position of the ice margin at maximum recession, or in other words the extent of the readvance in T8 time, is as yet unknown. However, the absence of Fort Ann deltas on the north side of the Missisquoi Basin, which was noted by Wagner (1972) and previously by Cannon, suggests that the magnitude of the recession may have been quite limited. However, to further complicate matters, if these deltas are in fact absent owing to the ice sheet presence, then how did Lake Candona extend further east along the Quebec Piedmont? This conundrum is very much like the question posed above having to do with how the ice sheet could be standing at Starksboro as required for the Bristol delta in Coveville time yet as well necessarily be north of the South Hinesburg to allow for the Coveville delta at that location in Coveville time. The answer, I suggest, lies in the nature of ice margins which were far more complex than our simple mental models imagine. In order to get out of my paradigm box I had to find a “dissaggregated labyrintihian complex in a narrow more or less open water corridor,”which came not from my imagination but from very recent literature about the nature of ice margins.
Paradigms are wonderful mental tools that help us think… way beyond the capacity of Artificial Intelligence(at least so far) but they also can be traps. 1 According to ChatGPT, “I can identify patterns in reasoning, language, and assumptions that signal a certain worldview or theoretical framework, whether its scientific, cultural, political, or philosophical.” ChatGPT has not learned to be modest. I do not believe it has the capability, yet, of discarding one worldview for another, or evaluating the merits of doing so.
At the risk of possibly overstating my case, the following schematics illustrate several of the paradigm “traps just discussed:”
- This illustration is for the South Hinesburg and Bristol deltas, as discussed above, both at the Coveville level:
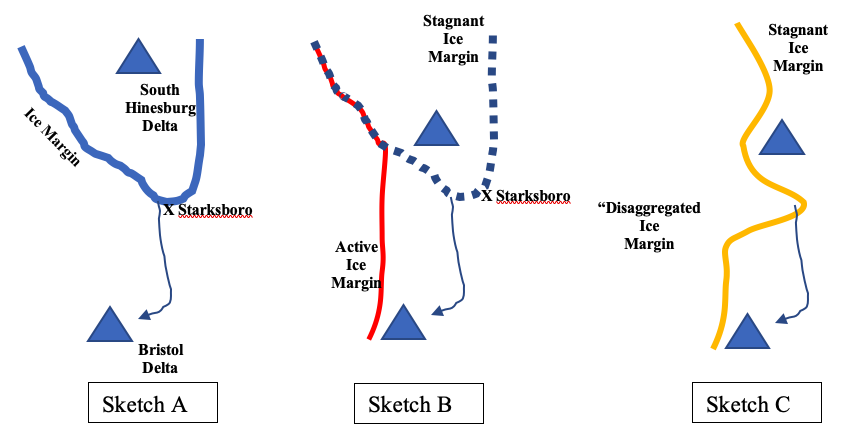
As indicated above, according to the information from VCGI mapping the Bristol delta formed from outwash emanating from a T4-T6 ice margin at Starksboro, at the head of the LaPlatte Basin in which the South Hinesburg Coveville delta formed. The above Sketch A suggests an ice margin at Starksboro, which, by conventional thinking, would require subsequent recession of the ice sheet to allow for the formation of the South Hinesburg Coveville delta. However, alternatively it is possible, and I believe likely, that the ice margin was a hybrid type, as illustrated, more or less, by Sketch B, with its stagnant portion(blue dotted line) standing at Starksboro, with its meltwater feeding outwash, leading to the construction of the Bristol delta, while at the same time the active ice margin(red line), which unlike its stagnant ice counterpart, receded northward to allow Coveville waters into the LaPlatte Basin for the South Hinesburg delta. Thus, both deltas could be constructed at the same time.
Another possibility is represented by Sketch C, where the ice margin was a “Disaggregated Type,” a term referred to in the literature and used for the discussion of Ice Tongue Grooves, whereby Coveville waters would have been able to penetrate the ice margin which was highly crevassed. At an early time in the writing of this report I referred to an open water “corridor.” I then changed this to “ narrow standing water” corridor. The evidence for such standing water corridors is taken from from kame deltas but is mostly inferential, relating to the concept of the receding margin accompanied by invasion of standing water, the level of which is equilibrated to the levels of Lake Vermont.2VCGI is very limited in regard to assessing such concepts as the nature of the ice margin and associated standing water. A more complete evaluation can be obtained by field mapping. For example, the mapping by Springston and De Simone in the Williston area, which identifies exposures along Sucker Brook said to represent deposition in close proximity to an ice margin to the west is helpful documentation. Thus, whereas this corridor may have in fact included open water, it may have been more “labyrinthian,” a term I used to connote a crevassed maze of a “Disaggregated” “Chicklet-like” ice margin, as suggested in online literature.
Another paradigm trap example is in regard the effects of calving. I tend to think of the Champlain lowland as favoring calving, which for me suggests a mental picture of a flattened margin where the ice sheet the lowland might look more or less like Sketch D below. However, lowlands also promote the protuberance of the ice sheet lobes whereby calving may take place along the frontal margin of a more convex lobe as in Sketch E.

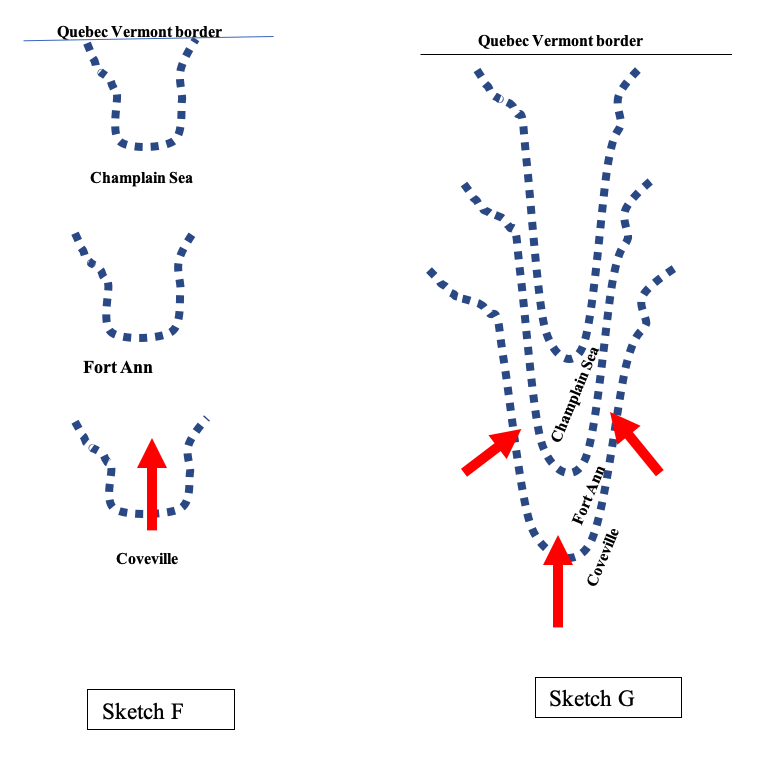
Also, the issue of ice sheet protuberance or convexity relates to my paradigm-ic thinking about ice sheet recession as being south to north, as in Sketch F below, versus a south to north recession in conjunction with lateral recession of the side margins of the Champlain lobe(Sketch G).
The red arrows in these diagrams are intended to illustrate recession direction. In my original interpretations of ice margin data, as previously indicated, I tended to have a Sketch F type of mental model in mind as a preconception, which is to say a paradigm, that ice margin retreat was predominantly south to north. Of course, I was aware that the shrinking ice lobe also involved lateral changes in the ice margin. However, in my original interpretation of the T8 margin, for example, I was content to place the T8 margin far to the north, restricted to the Missisquoi Basin, such as in Sketch F. It took a long time and mental concentration for me to see an alternative interpretation as in Sketch G which gave a better fit to the data, representing a more complex recession with substantial east to west components.
It should be clear by now that the point to the preceding discussion is that, not just in my opinion but as well some of the great philosophers of scientific thinking, we are all confronted by challenges to our paradigm-ic thinking. Paradigms represents traps which make it difficult to see the “forest for the trees,” as the saying goes. Whereas I would like to think that this report breaks through some of these constraints(which was not my initial goal), it is likely that these have not been fully resolved, and that it remains to future generations to further advance our understanding, which I believe will entail collaborative thinking by researchers in Vermont, New York, Quebec, New Hampshire, and perhaps beyond.
This discussion points to the difficulty associated with correlating ice margin and standing water body features, and in the process constructing deglacial history, the difficulty having to do with our way of thinking about ice sheets that we are just beginning to understand. My goal here is not to sound profound. Rather it is to confess my ignorance, as it were, stuck in the Dark Ages about the Ice Age, but hopefully offering some progress.
I added the word “Blinders” to the heading for this section of the discussion underscore that paradigms can be so deeply imbedded as to prevent us from looking at deglacial history in new and different ways. This is especially the case for the concept of the “Bath Tub Model.” In fact, for one of the reviewers of early drafts of this report, the suggestion of this model seemed so preposterous and outrageous as to angrily lash out at me for not understanding the nature of glaciers and ice sheets. Perhaps for some readers of this report, this concept will prove to be a bridge too far. As I said, the best I can do is make my case, which has only grown stronger and for me more convincing since that early draft, as history will ultimately be the judge.