As noted, this research was inspired by the work of Parent et Occhietti (1999) and colleagues in Quebec. In a subsequent 2001 report these authors explicitly refer to their work as defining a new paradigm. 1 See heading entitled, “Glacial Features along the Appalachian Piedmont and new Paradigms,” on page 260 in Occhietti, S, et al, 2001, Late Wisconsinan glacial dynamics, deglaciation, and marine invasion in southern Quebec, Geol. Soc. Of America Special Paper 35, pp 243 -270, As discussed in various ways in this present report, both paradigms and “paradigm shifts“ are exceedingly important, leading to new insights, as has been the case here.
Three aspects of the Quebec research are particularly helpful:
1. Bath Tub Model
The 1999 Parent et Occhietti report (and other reports by these authors and their colleagues) present maps which depict a series of recessional moraines marking the margin of the ice sheet as it retreated down the northward sloping terrain along the south side of the St Lawrence Valley in Quebec, as shown below:
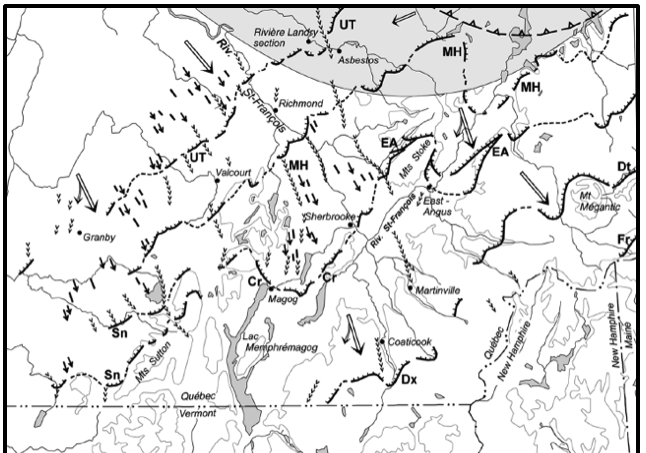
The authors do not use the term “Bath Tub Model,” but indicate that the moraine segments, shown by heavy black lines on the above map, can be correlated by their trends, alignment, and summit elevations. As the ice sheet thinned, as its margin receded down the Appalachian piedmont on the north sloping southern flank of the St Lawrence lowland, it was greatly and increasingly influenced by physiography such that moraines in that region can be correlated, again based on their elevation, orientation, and alignment. Of course, in general the terrain in southern Quebec tends to slope gently to the north, unlike Vermont’s highly irregular terrain. However, looked at more closely the physiography of the Piedmont of southern Quebec, close to Vermont, likewise has similar topographic irregularities where moraines closely follow the terrain. As a long time hiker and biker in both Vermont and Quebec I can personally attest to the similarity of the physiography. I am struck by the close similarity of both Quebec’s terrain and as well the nature and occurrence of ice margin features to Vermont.
Further, the above Quebec map shows two moraines, specifically the Dixville moraine (Dx) which approaches the border east of Lake Memphremagog, and the Sutton moraine(Sn) north of Lake Carmi, both of which are close to and trend toward Vermont, raising the prospect of finding correlative ice margins in Vermont. In fact, correlative ice margins of these moraines (and as well possibly the higher and older Frontier moraine (Ft) ) are identified in Vermont, New Hampshire, and New York in this present study. These are believed to span and encompass much of Vermont’s deglacial history as identified in this report.
As suggested by Parent et Occhietti, the Dixville and Sutton moraines represent a relatively late portion of the larger regional deglacial history which had its beginning much earlier far to the south. Both moraines are found here to correlate with Vermont ice margins, specifically margins T3/T4 and T6 respectively. The T3 and T4 margins in Vermont are here found to represent the transition from the Nunatak Phase to the Lobate Phase, in the earliest time of ice margin recessional history. Thus, the implication is that much of the deglacial history presented here for Vermont is late in the larger deglacial history of New England and northeastern North America generally, when the ice sheet had already substantially thinned. This is an important observation as it helps to explain why it has been possible here in this study to map and correlate ice margins on the basis of elevation in the “Bath Tub Model.”
Conceptually, the Bath Tub Model has to do with the progressive vertical lowering of the levels of the ice sheet and the receding horizontal positions of the ice sheet margins through time in accordance with physiography. The model suggests that with climatic warming and ice sheet recession, the highest peaks of the Green Mountains emerged as early nunataks and that with continuing recession the ice sheet became increasingly confined by the terrain in the form of discrete lobes, large and small, in major basins and a myriad of tributary basins – all of this everywhere with frontal margins governed and delimited by the laws of gravity (less so for lateral margins), with progressively younger margins, again “like the rings of water in a slowly draining Bath Tub.” This quoted phrase is repeatedly stated in regard to the findings of this report for Vermont, where in many places evidence is found showing the progressive recession of ice margins (again, specifically frontal margins as opposed to lateral margins), with ice margin features at progressively lower levels, in places spanning and representing much of the entire recessional history of the ice sheet being reported here. These features conceptually express a sense of the Bath Tub Model pertaining to deglacial history, but for a highly irregular bathtub with a variety of “rings” representing ice margins, meltwater drainage, and proglacial water bodies. The reference to rings in a slowly draining bathtub, again, is intended to convey a sense that the analogy is quite appropriate, as marked by many ice margin deposits scattered across the State of Vermont, which together represent a remarkably substantial record of the progressive, generally recessional deglacial history.
Of course, care is required when examining deglacial history by usage of elevation as a guide because ice sheets have surface gradients and are not flat like actual water in a bath tub. The rationale and basis for usage of elevations in the Bath Tub Model are discussed further in more detail in a subsequent section below.
2. Ice Margin Styles
In their work, Parent et Occhietti et al include evaluations of the environmental conditions along the ice sheet margin and associated ice margin features in considerable detail, enabling a better understanding of the ice sheet environment as part of its deglacial history. These authors use the term “Styles” to refer to the nature of ice sheet margins, the manner of their retreat, and the associated character of ice margin features in different physiographic settings. In this present VCGI mapping report, different Styles are identified. It turns out that this is a story not just about the ice margin recession, but as well the accompanying conditions or “Styles” along the margins.
3. Glacial Dynamics
The term “Glacial Dynamics,” as noted above, is used by Parent et Occhietti and others in Quebec. It refers to the interaction between the ice sheet and the terrain, and large proglacial water bodies in the St. Lawrence lowland, which dramatically altered the ice sheet flow system and its recessional history. The same can be said in Vermont. on a more local scale. The term “Glacial Dynamics” refers to thermal and physical interactions between the ice sheet, meltwater drainage, and standing water bodies in multiple, complex ways, as also discussed herein.
Thus, this report explores the identification and correlation of deglacial ice margins across the State of Vermont, and with neighboring areas in Quebec, New York, and New Hampshire by usage of a “Bath Tub Model,” combined with an exploration of Styles and Glacial Dynamics. This exploration represents the testing of a hypothesis, that deglacial history can be deduced by reference to elevations of ice margin features. The term Bath Tub Model represents the proposition that different ages of ice margins of the receding ice sheet in Vermont are related to physiography and elevation as a general guide, not a precise proposition. The concept is not meant to suggest or signify that the ice sheet was flat, akin to water in a bath tub. Obviously, the surface of the ice sheet of necessity had a gradient and was not literally like water in a bathtub. The concept of such a model reflects the widespread recognition that as the ice sheet thinned its margins tended to be influenced by physiography, increasingly so with time. In fact, as noted above the deglacial history being reported here is from a very late time in the deglacial history of New England.
Whereas as indicated above the concept of using elevation and physiography for correlating ice margins came from Quebec reports, many other reports in Vermont and neighboring areas have identified a relationship between ice margins and physiography. For example:
- In my opinion one of the most profound explorations of the nature of ice margin recession in New England is by Koteff and Pessel. 2Koteff , C. and Pessel, Jr. F., 1981, Systematic Ice Retreat in New England; USGS Prof Paper 1179, 20 p.[\mfn] I want to add a note that both Carl and Skip were good friends. Skip was a colleague of mine in graduate school. We shared many good times together, many wonderful discussions and some arguments, and good red wine in high places. Their report contains numerous insights which fit with the evidence found in this present study in many ways. For example: a) The finding here that ice margin recession commonly is associated with step-down sequences of stagnant ice and associated drainage and proglacial water bodies (consistent with a reverse gradient setting, which is common across New England) fits well with their discussion; b) The authors’ recognition and suggestion that recession entailed both northward longitudinal recession of lobe frontal margins and as well lateral shrinking of lobate shaped lateral lobe margins; c) Their discussion of the role of physiographic terrain barriers causing en masse stagnation relates to the long standing debate about the nature of ice margin recession in New England, and corresponds to the finding here of Disconnections related to en masse stagnation in the Connecticut Basin; d) With regard to the issue here, as to whether or not ice margin recession can be likened to a “Bath Tub Model,” the authors make clear in many parts of their report that they see a close relationship between progressive vertical lowering of the ice sheet and its thinning, with the recession of ice margins positioned in accordance with physiography.
- In neighboring New York and portions of southwestern Vermont, as discussed in Appendix 3, DeSimone and LaFleur (1985) 3De Simone, D.J. and La Fleur, R. G.(1985) Glacial Geology and History of the northern Hudson Basin, New York and Vermont, New York State Geological Association Field Trip Guidebook. September 27-29, 1985, pp 82-116. identify twelve ice margin positions, which are closely related to physiography, stating: “Topographic control determined the location of distinctive kame moraine sediment bands…” The authors present a map of ice margins in Hudson/Champlain divide area of New York, which shows a very close relationship between receding ice margins and physiography, per the above analogy like “multiple rings in a slowly draining bathtub.” Interestingly, their map overlaps with a portion of Vermont but was first seen by me after ice margins had been mapped here using VCGI. Although mapped independently the similarity of the ice margins in the overlap area is striking, which is taken as supporting the usage of the model.
- In New Hampshire, Thompson et al 4 Thompson, W. B., et al 2017, Deglaciation and late-glacial climate change in the White Mountains, New Hampshire, USA; Quaternary Research, V. 87, pp 96-120. present research findings on the “White Mountain Moraine System,” as discussed in more detail in Appendix 3. In general, the White Mountain Moraine System fits with the Bath Tub Model presented here for Vermont deglacial history, and adds evidence suggesting an associated readvance.
- Another example from New Hampshire is given by Davis et al. 1 In their report on the Mount Moosilauke Quadrangle, they identify till “benches” which they interpret as having formed along the margin of the receding ice sheet. In the abstract of their report the authors state:
Whereas these authors do not suggest that these features represent a basis for regional correlation of ice margin features in New Hampshire, their description as given above and stated elsewhere in their report suggests that the ice margin recession substantially corresponded with physiography from near the summit of Mount Moosilauke, downward over an elevation range of over 2000 feet in what is described here (in this present Vermont VCGI report) as the Nunatak Phase down to the beginning of the Lobate Phase, at similar elevations.
- In Vermont, the now classic work by Stewart and MacClintock conceptually examined historical aspects by usage of a different conceptual model, one based on different ice movement directions, by which three different historical events were identified. My own work back in the 1960s and 1970s raised doubt about this history, but failed to establish a meaningful alternative, largely because I did not then identify a conceptual model that would allow me to correlate ice margins positions. (I would like to again note, as stated previously above, that in retrospect while I still disagree with Stewart and MacClintock’s historical interpretation, I see their work as having been monumental, providing the only state-wide compilation of surficial geology information, representing an extremely valuable resource. I don’t agree with their interpretations in every instance, but nevertheless their report is a remarkable and valuable contribution. Whereas S & M did not specifically map ice margins, their report makes clear that they recognized the role and importance of physiography. This was explicitly and well stated by Cannon who was on the S & M team.
- Also in Vermont, subsequent work by Stephen Wright, who was my successor at UVM, and his colleagues, present detailed documentation of glacial features at many locations across the State. I likewise see the work by Stephen et al as invaluable contributions. Their work presents detailed, careful, and thorough documentation of surficial geologic information. They report that their findings, including a detailed examination of striations and other ice movement indicators, fully discredit S & M’s three-staged glacial history.
Wright et al recognize the influence of physiography in many of their reports. For example, in a 2015 report published in Quaternary Science Reviews, Wright states, “topography began influencing ice flow as the ice sheet thinned.” Similarly, in a NEGSA Poster presentation 2025 : “During ice retreat, the thinning ice sheet became topographically controlled and generally flowed south, parallel to the region’s valleys.” Whereas Wright’s statements are about ice movement directions, the logical inference is that ice margins as well therefore were physiographically influenced. However, the reports by Wright et al do not examine this possibility. Instead, as noted above, they infer receding ice margin positions associated with proglacial lakes, which reflects a physiographic influence, but do not specifically identify, delineate, and correlate such margins by interpretation of ice margin features. It is in this respect that this present report differs from their work in Vermont.
Whereas Wright et als’ observations about flow directions does not establish that ice margins are necessarily controlled by physiography, as is often stated, the “devil is in the details. Take for example, the matter of ice margin “steps.” These are micro-terraces on mountainsides in glacial till. Such features have been recognized by a number of researchers, including in Vermont, New Hampshire, New York and Quebec. It is generally agreed that these were formed along ice margins, though the exact mechanism of their formation is a matter of some debate. More to the point, as discussed in the Ice Margin Feature section of this report, Wright, has identified and reported on several areas having such steps. One such area is in the Upper Missisquoi Basin near an old asbestos mine named Tillotsin Mill. He interprets these features as indicating push moraines formed at the lateral margin of the receding ice sheet in that area. Whereas I might be picky about lateral moraines being considered as “push moraines,” because this infers an ice flow direction more or less toward a frontal ice margin, and not a lateral margin, my point here is that in my opinion his interpretation is tantamount to his acknowledging and providing support for the ” Bath Tub Model,” albeit without Wright himself explicitly stating this implication and its significance. Suffice it to say, as discussed below in the section of my report introducing Steps as one of the types of features used by me for deciphering deglacial history, his Steps in the Tillotsin Mill area are part of a broader, much more substantial body of evidence in the Upper Missisquoi Basin, that documents the Nunatak Phase in this basin giving way to the Lobate Phase, marking the T4 margin which can be traced around both the Basin and more generally the State as a whole, and correlated with features in New Hampshire and Vermont – all in close association with physiography which is visually discernible. This is an example where such details as Step type features ,while important in and of themselves, can be more meaningfully examined in the context of the larger deglacial ice margin history and associated features. In essence, in my opinion, Wright’s Tillotsin Mill steps add to the “proof” in support of the “Bath Tub Model,” especially when taken in the broader context.
Thus, the Bath Tub Model is not some far-fetched theory. As just stated, it explores the relationship between the ice margin and elevation, as recognized by others as the ice sheet thinned, whereby elevation can be used as a general guide.
As stated in the Epilogue, as to the validity of these findings, as noted above, proof, meaning real proof, is elusive in the natural sciences Such proof in this case comes in multiple ways, based on:
- The preponderance of the evidence, meaning the fullness of the evidence that fits together in a reasonable way in accordance with a large data base and in a reasonable manner consistent with our present day understanding of glaciers and ice sheets. The nature of such “proof” is to substantiate a finding by an overwhelming body of evidence, so substantially as to be taken as proof.
- Hypothesis formulation and testing which lies at the heart of the scientific method. For example, usage of the Bath Tub Model led to the identification of features indicative of calving. One type of these features is referred to as Ribbed Lacustrine deposits. Based on LiDAR imagery a suspected Ribbed Lacustrine deposit along the La Platte was identified, which as it turns out was confirmed by field examination. Such hypothesis testing took place repeatedly in this study, generally using VCGI information alone, but in this case by field study. The ability of a methodology which leads to the formulation of hypotheses for testing, if successful, again repeatedly, adds to the weight or merit of the methodology. Calving ice margin features were of necessity closely related to physiography, through the close association with proglacial water bodies.
Looking ahead, the “preponderance of the evidence” and “hypothesis formulation” types of proof in support of the Bath Tub Model concept as mapped here on VCGI and discussed below are substantial. In fact, the mapping here has identified abundant evidence across the State, very much like multiple rings in a slowly draining bath tub. Again, this deglacial history does not represent the entire recession of the Laurentide ice sheet. Rather it only represents the late glacial time when the ice sheet had thinned. In fact, this preponderance led to the identification of a recurrent “Signature” pattern of ice margin features which is so consistent across the State, in such a great variety of different settings, with a wide variety of Styles and Glacial Dynamics, as to be predictive, independent of the examination of associated elevations.
To briefly elaborate: Late in the VCGI mapping, while examining the evidence of the deglacial history in New Hampshire, it was realized that the features associated with the White Mountain Moraine System are commonly and consistently repeated as a pattern in Vermont at the T3/T4 levels, positions, and times. Thus, this pattern suggests a “Signature, ” which can be used for mapping. This is exceedingly important. Not only does this “Signature” serve to support the validity of the Bath Tub Model, it also constitutes a basis for mapping and correlation independent of elevation and the application of the Model.
For example, the T3 andT4 margins are mapped on VCGI in the Vermont Valley from the Bennington area to the Rutland area, a distance of about 50 miles.2 A similar pattern is likewise marked along the North Branch Lamoille Basin. And in the Memphremagog Basin, the T3/T4 evidence is very substantial, including features extending across divides with and into the Connecticut Basin. Again, the point here is that this recurring pattern is so substantial, in so many diverse places, as to establish an important “Signature” which both supports the Bath Tub Model and as well provides an independent basis for correlation. In fact, this signature pattern has many pieces, in terms of deglacial history, including ice margin features like rings on the bath tub, Styles, and Glacial Dynamics, all of which fit together in a remarkable way.
The above three “paradigm-ic” legs of the stool are interrelated and difficult to parse, as the environmental conditions at the ice margin, or i.e., its Styles, as marked by a variety of different types of features greatly affected the ice sheet in a Glacial Dynamic feedback loop, including the margin itself. Different Styles and Glacial Dynamics are identified in this report. The findings presented here refer to the Bath Tub Model, Styles, and Glacial Dynamics, but these concepts are so fundamental that the tendency is to examine and describe these elements without recognizing or actually referring to and using these specific names, or appreciating that studying glacial history commonly leads to an exploration of Styles and Glacial Dynamics. One of the benefits of coining and using these terms to represent the concepts is to serve as a reminder to look for and explore such features, to better understand their presence and meaning as a better, more complete way of understanding deglacial history.
Thus, the idea of a Bath Tub Model is intriguing and has merit, the question being tested here in this report is, to what extent this relationship can be reliably applied on a regional scale as a methodology for correlation of ice margin features for the determination of deglacial history. To suggest that ice sheet margins may be examined and correlated by elevation of ice margin features as if ice sheets were like water in a “Bath Tub” would seem to ignore a) the fact that ice sheets have gradients and are not flat like water in a bathtub, and b) abundant evidence indicating that the margins of glaciers and ice sheets of the same age, both present-day and Pleistocene, are marked by ice margin features which do not occur at the same elevations, but quite to the contrary occur across a wide range of elevations. This is because the levels and positions of ice margins are affected by many factors, which likewise must be considered in the application of the Model.
The applicability of the Bath Tub Model and its validity as a methodology for deducing Vermont deglacial history is supported by the following:
1. Ice sheet thickness: As noted above, many published reports observe that ice sheet margins tend to conform with physiography when and where ice sheet thicknesses during recession become relatively small or thin. This is reported for both modern day ice sheet margins and for the late Pleistocene records in neighboring Quebec, New York, and New Hampshire in regard to the moraines and other ice margin features in those areas. In general, the evidence is that most of the ice margins as delineated here as part of Vermont’s deglacial history show a remarkable conformance with physiography, in relatively minute detail for the later margins. Older ice margins appear to be less sensitive, presumably because of increased ice thicknesses, but still show a general relationship with physiography. This is attributed to the fact that the ice thickness of the receding ice sheet in Vermont had thinned sufficiently so that ice margins for much of this history were affected by and followed physiography. In general, the deglacial history of Vermont presented here is very young in the context of the larger, entire deglacial history of the ice sheet that took place after the glacial maximum, in a time when the ice sheet had thinned substantially such that ice margins tended to conform with the landscape.
The issue of ice sheet thickness is discussed in more specific terms in Appendix 2 for Locale LC1. The following text is copied from a portion of that discussion relating to the issue of ice thickness:
The thickness of the ice in the Vermont Valley when the Scabby Terrain Tract formed in Locale LC1 was about 1200 feet(366 m), as marked by early, T3 features. The issue of ice thickness is important in regard to the discussion in the text above about the usage of the Bath Tub Model being favored by thinner ice. This raises the question as to how thin the ice sheet needs to be in order to justify the use of the “Model.” Obviously, this is not a matter of choosing a single thickness but is a relative matter, related to the relief of the terrain. Whereas the 1200 foot(366 m)thickness might seem to be relatively thick, obviously the terrain differences associated with the Vermont Valley are much more substantial. By contrast, for example, the T7 ice margin, near the end of the deglacial history, in the vicinity of Fairfield Pond, shows remarkable sensitivity to terrain differences, with ice thicknesses on the order of 200 feet(61 m), which obviously is relatively thin ice. In general the Bath Tub Model was used for ice thicknesses within the range of 200 to 1200 feet(61 m- 366 m), but again the justification is dependent on the relative relief.
2. Late glacial time: Whereas this VCGI study provides no sense of the absolute ages 5 “Relative time” in geological history refers to the order of events, without assigning numerical ages, in contrast to “absolute time” which specifies the actual numerical ages of features, events, etc. However, various reports by others suggest actual absolute age dates or refer to glacial chronologies which indicate absolute ages. Thus, for example, Thompson et al (2017) suggest the age of the Littleton-Bethlehem moraines and readvance is about 13,800 – 14,000 years BP, correlated with the Older Dryas. The T8 margin developed after the Champlain Sea opened in the Champlain Basin in Vermont. In as much as Cronin et al (2008) estimate date of the Sea opening as about 13,000 years BP, the T8 margin is slightly younger than this age. of such features, the correlations as just described indicate that the bulk of the Vermont deglacial history reported here was in late deglacial times by which time the Laurentide ice sheet had substantially thinned, helping to explain and support the correspondence between ice margins and physiography and the usage of the Model. The deglacial history presented here is thus a late deglacial history, not the full deglacial time for the entire history of the Laurentide ice sheet in New England.
3. Ice sheet gradients: As is well known, and as indicated by the evidence reported here, ice sheets generally and specifically including as well in Vermont had substantial gradients. The applicability of the Bath Tub Model is modified to take this into account. It is recognized that ice margin features can form along both frontal margins associated with streamlines oriented perpendicular to the ice margin, versus lateral margin feature with flow lines oriented parallel or at some angle to the ice margin. The focus here is on the former, the theory being that truly frontal margins are more likely to be more closely related to and controlled by physiography. This is done by focusing on those particular stagnant ice margin features which: a) are substantial in size, and b) lie athwart the drainage basins where they are identified and mapped. This thinking is thus intended to identify ice margins at lobe tips which reasonably can be assumed to have formed perpendicular to flow lines and were more sensitive to physiography. For example, the Rutland and Bennington “moraines” identified by Stewart and MacClintock represent the types of stagnant ice features of particular interest. Both are large deposits on basin floors and both formed where and when the receding ice margin was substantially confined by the terrain as a very distinct and substantial lobe.
4. Meltwater drainage and standing water: The application of the Bath Tub Model for deciphering deglacial history utilizes not just ice margin features but also meltwater drainage and standing water features for which evidence is as ubiquitous as the ice itself. In general, this story is about both the ice sheet and associated meltwater and proglacial water bodies histories. I tend to anthropomorphize this by thinking of the ice sheet as struggling to cope with water along its margin. Obviously, the ice sheet was not a “struggling” entity, but I see the ice sheet’s handling and disposition of meltwater, with physiography as a limiting boundary condition, as a major, central part of the ice sheet deglacial history story. In terms of the usage of a “Bath Tub Model,” in contrast to the ice itself, drainage and standing water features do not suffer from the ice sheet gradient difficulty, and in fact relate to the terrain just as water in a bath tub containing a mass of ice. Further, drainage and standing water can provide links for correlation across multiple basins and over long distances, which is a powerful application of the “Bath Tub Model.” In fact, such links provided support for ice margin correlation along much of the length and width of the entire State of Vermont.
Further, the evidence as presented and discussed herein at length indicates that the margins of the ice sheet in Vermont were not just associated with running and standing water but in fact the ice margins were greatly affected and largely controlled by standing water, whereby a more direct analogy with the concept of a “Bath Tub” is even more appropriate. In other words, the study reported here indicates that, for example, the development of calving ice margins in the Champlain Basin greatly altered the ice sheet equilibrium, causing a destabilization which tended to adjust the ice margins to water levels.
5. Correlation of different Styles in different basins: The mapping here shows that Vermont’s physiographic basins differed substantially in terms of the environmental settings associated with ice margins, resulting in a variety of different types of ice margin features. However, again as reported below, despite these differences, ice margin stillstand levels are identified in these different settings across the State, at recurrent and corresponding elevations(when adjusted for isostatic rebound effects). For example the deglacial histories of the Memphremagog and Champlain Basins, which differed greatly in terms of Styles and therefore types of ice margin features, nevertheless developed correlative ice margin positions at similar elevations(again when adjusted for isostatic rebound), consistent with a Bath Tub Model.
6. Regional correlation: As discussed below, the correlation of Vermont ice margin T levels and times fits with ice margins identified in neighboring regions. For example, the T3 and T6 margins fit very well with the margins independently identified by De Simone and La Fleur 6 De Simone, D.J., and La Fleur, R.G., 1985, Glacial geology and history of the northern Hudson basin, New York and Vermont; ; NYGSA, pp 82-84. , the T4 and T6 margins likewise fit with the Dixville and Sutton moraines of Parent et Occhietti in Quebec, and the T3 and T4 ice margins as well fit with the ice margins reported by Thompson et al in New Hampshire. 7Thompson, W.B. et al, 2017, Deglaciation and late-glacial climate change in the White Mountains, New Hampshire, USA, Quaternary Research, V 87, pp 96-120. This “fitness” lends support to the usage of the Model in that all of these pieces fit together in a rational, reasonable, and sensible way.
7. Collective weight of the evidence: Finally, and in my opinion perhaps the most important bottom-line test for the usage and validity of the “Bath Tub Model,” is the fact that, after taking into account a wide array of evidence, these historical puzzle pieces fit together and make coherent geological sense in a very robust story with many parts and pieces, which not only fit together, but as well make sense in a manner consistent with an understanding of both ice sheets and as well reports by others from previous reports in Vermont and beyond. In fact, developing this history was a two-way street whereby puzzling about the nature of the pieces of the evidence led to a closer examination of modern glaciological literature and as well previously published reports in Vermont and neighboring States, but as well in reverse, where information from the literature led to hypotheses for further search for, and the finding of expectable evidence.
In sum, this is a report primarily about late glacial history of the Laurentide ice sheet in Vermont, in particular its recession, using elevation as a guide. I repeatedly found it helpful to remind myself that this is not a story about how the ice sheet advanced into specific locales. By the time this story begins the ice sheet had already made its way into every nook and cranny of Vermont, and further as just stated had already substantially receded. It is a story about the emergence and growth of nunataks, the emergent higher peaks of the Green Mountains (a “Nunatak Phase”), as the surface of the ice lowered, and about the development of ice lobes (a “Lobate Phase”) in Vermont’s physiographic basins, and the accompanying progressive lateral shifting and vertical lowering of these ice margins through time in the “Bath Tub Model.” It is also a story about the Styles of ice margin retreat and Glacial Dynamics such as mass stagnation and other interactions between the ice sheet and its surroundings. As stated above, it is a story built around a three-legged, new paradigm, which again is the Bath Tub Model history, with details related to Styles and Glacial Dynamics.
This present report explores application of the Bath Tub Model in a careful and thoughtful way as a means to develop and better understand the deglacial history of Vermont. In doing so, elevation serves more as a guide rather than an absolute control. This is made necessary owing to the nature of ice margin features which give a range of elevations, and as well the usage of contours for elevation control which likewise adds to the imprecision, especially with regard to necessary adjustments for isostatic rebound which are themselves complex and incompletely understood. But also, more fundamentally, the “Bath Tub” deduced history is made more challenging by the nature of the lowering and receding ice margins in Vermont. While ice margin positions which may be likened to “stillstands” are identified, in general, substantial evidence, in many locations and different ways, indicates that deglaciation proceeded progressively and incrementally, as stated above, in a manner very much like “multiple rings in a slowly draining Bath Tub.” Again, this phrase is repeatedly re-stated in this report, yet again and again, and has profound significance with regard to the Bath Tub Model and deglacial history. As noted above, the ice margin positions identified here represent stillstands, or pauses, in that time was required for the formation of stagnant ice margin features. But whether or not such “stillstands” correspond with climatic variations cannot be determined by the available data which are silent in regard to climatic differences.
To any who may take issue with the Bath Tub Model, it needs to be said that whereas this concept and its application are not perfect, for Vermont there are few alternatives. Stewart and MacClintock offered a different paradigm, their drift sheet model based on changes in flow directions through time. That model may well have merit and be compatible with the results of the Bath Tub Model by showing changes in the directions of ice movement in different areas of the State in different times. But that model does not specifically delineate ice margins during deglaciation. In contrast the Bath Tub Model in fact focuses on ice margin positions through time, and in that respect provides a richer record which more favorably compares with deglacial history developed in neighboring regions of Quebec, New York, and New Hampshire. In any case, for doubters it needs to be asked, if not a Bath Tub Model for Vermont, where moraines are scarce or not existent, then what?
And finally, I am aware that there are limitations to the concept of the Bath Tub Model and its application. For example, Dyke(2004) and Stokes (2017) examine a larger, continental scale view of the Laurentide Ice Sheet, recognizing that at this scale the ice sheet margins did not follow physiographic patterns, but instead ice margins varied in response to different regional Glacial Dynamics, for example with ice margins in some places advancing and at the same time receding in other places. In this perspective, Vermont represents a small, local part of the larger ice sheet. The evidence presented here suggest that this portion of the ice sheet behaved as one, more or less monolithically. On the other hand, Quebec researchers have provided dramatic evidence that sub-continental scale physiographic elements, such as the St Lawrence lowland, had major effects on the ice sheet. Thus, there are limitations to which the deglacial chronology found here for Vermont can be extrapolated to neighboring regions. There is reason to believe, for example, that the history of northern Maine was very different than in Vermont. Identifying the extent of the Laurentide Ice Sheet for which Vermont is a component, wherein the deglacial history is comparable , is worthy of further exploration.
An important element pertaining to the nature of the ice sheet retreat has to do with time related variations in the elevation and frontal margins of the Laurentide ice sheet during its recession. The same Quebec authors make clear that during the recession of the Laurentide ice sheet whereas glacial dynamics were a complicating factor, the record includes evidence of global temporal climatic fluctuations, but that the ice sheet responded to these in complex and different ways having to do with different Glacial Dynamics. This topic for me segues into the matter of “readvances.” There is strong and unrefuted evidence for climate related readvances in many places for the Laurentide ice sheet during the ice sheet recession. The previous literature for Vermont and adjacent areas, as discussed below, includes suggestions for readvances, including specific evidence indicating that in certain specific locations and times ice sheet readvance is documented, including evidence tying such readvances to climatic fluctuations. However, in many instances research reports suggest “readvances” without presenting specific evidence pertaining to the scale of the readvance, meaning the extent of the recession (ie., the position of the ice margin) prior to the “readvance” and without specific evidence for the absolute ages of such events and without linkage to any climate evidence. This matter, in my mind, raises the question about the nature of the ice sheet margin during recession. There is some evidence indicating that such recession in many places in Vermont was oscillatory in nature. Thus, the distinction between “normal oscillations” versus climatically driven “readvances” is important but difficult to make. In general, in this present report I have tried to avoid this entire issue, and likewise have limited discussion about absolute ages of ice sheet margin positions. While both issues are, of course important, the VCGI mapping here does not provide any specific stratigraphic or absolute age related evidence. However, as a matter of principle I tend to be skeptical about unsupported findings pertaining to significant “readvances.”
Footnotes:
- Davis, P.T., Keeley, J., and Thompson, P.J., (date uncertain) Surficial Geology of Mount Moosilaukie 7.5 Minute Quadrangle, Grafton County, N H; 39 p,; https://www.des.nh.gov/sites/g/files/ehbemt341/files/documents/geo-061-024000-smap-mount-moosilauke-summary.pdf ↩︎
- As discussed below, the WMMS is reported as being related to a significant readvance. The evidence discussed below indicates that correlative margins in the Vermont Valley, at both Bennington and Rutland, include possible readvance evidence. However, it is hard for me to believe and is not suggested that the correlative WMMS readvance in the Vermont Valley was of this magnitude. Again, further study is warranted. ↩︎