Ice Marginal Channels are common and quite stunning features in Vermont. The term “Ice Marginal Channels” is used informally here to refer to features which are quite numerous on LiDAR imagery, especially but not only in the Memphremagog Basin where they number perhaps in the hundreds. They generally are quite obvious and distinct, usually short and sinuous grooves, but some can be quite subtle, in some cases becoming apparent while mapping only in the process of tracing a particular contour for a suspected ice margin. Ice Marginal Channels are marked on the VCGI base map with thin dashed black lines, along with elevation information.
a. Description of Ice Marginal Channels
Ice Marginal Channels typically are relatively short, arcuate to somewhat sinuous and linear erosional-looking gullies, more or less parallel to the topographic contour. They vary in length but typically are hundreds to several thousands of feet (hundreds of meters) in length. Their depth is difficult to determine but generally less than topographic contour intervals which commonly is 20 feet(6 m). They typically occur in till ground moraine and are not found in stagnant ice deposits, and do not show any stagnant ice patterns. Nor do they show any geomorphic fluvial patterns, such as dendritic or trellis types, which are typical of free flowing, fluvial surface waters. They are interpreted as having formed close to the edge but beneath active ice margins, which is significant for historical interpretations as such margins were capable of impounding proglacial waters, as contrasted with stagnant ice margins which allowed for and promoted the penetration, flow, and drainage of standing or flowing proglacial waters.
Whereas Ice Marginal Channels generally are best seen with LiDAR imagery, some of these features are quite prominent. For example, Ice Marginal Channels on the “massif front” east of Norton Pond in the Memphremagog Basin are visible on satellite imagery as for example on Google Earth. These particular Channels are especially notable in as much as they approximately mark the T3/T4 readvance correlated with the White Mountain Moraine System in New Hampshire and are part of the ice margin “Signature.”
Ice Marginal Channels are commonly found in vertical clusters along the lateral sides of basins as multiple sets at a range of elevations and at different locations along the basin length. The higher elevation Ice Marginal Channels suggest ice margins encircling upland peaks, indicative of an early “Nunatak Phase” of ice recession. These were mapped but not correlated so as to define ice margins as part of the deglacial history, the thinking being that these formed at earlier times when ice thicknesses were less influenced by physiography. Lower elevation Ice Marginal Channels show patterns suggestive of the progressive development and recession of lobate ice margins downward toward basin floors as part of the “Lobate Phase,” giving way to stagnant ice deposits on and near basin floors. But again, Ice Marginal Channels are never found in stagnant ice deposits. This, plus the fact that, as already noted, they never show drainage patterns typical for free flowing surface water drainage, is taken as an indication that they likely formed at the base of the ice sheet, beneath active ice lobes, and near their margins.
The interpretation of these features as being associated with active ice margins is an important element which relates to deglacial history at many locations, as discussed further below. The Ice Marginal Channels in the Lobate Phase are also important in that they provide strong evidence supporting the usage of the “Bath Tub Model,” as they clearly show that, as the ice thinned, for a substantial part of Vermont’s deglacial history ice margins were largely controlled or at least greatly influenced by physiography. However, while Ice Marginal Channels were mapped and used to help define ice margins as part of the deglacial history, in general individual Channels per se were not correlated, except in the Memphremagog Basin where these features at the T4 level are numerous and show a strong correlation with the Dixville moraine in Quebec at a specific elevation, near 1400 feet(426 m) at the Quebec border(corresponding to upper active ice portion of the T4 “hybrid” level and time, as discussed below).
Ice Marginal Channels are more common on lobate-shaped north and west-facing terrain, and more so on northwest-facing terrain slopes as compared to northeast-facing terrain slopes, but not exclusively so. This suggests meltwater drainage gradients directed by, on, and within the ice sheet, generally southward away from northern sectors of the ice sheet toward the ice margins on the east and south. Such channels also are numerous on bedrock upland fronts where the ice abutted “head-long” and pressed against such terrain. For example, in the Memphremagog Basin Ice Marginal Channels are especially numerous along the northern front and sidewalls of a massif in the south side of the basin. The example given below from the Norton Pond area is cited to show that as the ice sheet retreated, there came a time in this basin where and when the ice abutted firmly against this massif front as an active ice margin, with the Ice Marginal Channels forming from meltwater flow beneath the ice sheet near its margin against this upland. Further, Ice Marginal Channels indicate sub-lobes of the ice sheet penetrated the massif in the narrow trough-like Black, Barton, Willoughby, and Clyde basins, and as well the Upper Missisquoi basin (which appears as part of the Memphremagog Basin but actually is part of and within the Champlain Basin). Ice Marginal Channels also appear to be associated with raised physiographic protuberances, which as discussed below, is regarded as significant.
In the section below entitled “Epiphany” it is suggested that ice marginal channels, at least at certain elevations, may be related to a readvance of the ice margin, whereby the readvance may have served to warm basal glacial ice, creating an inverted polythermal condition, with subglacial meltwater ponded behind terrain dams, and thus eroding channels much like proglacial lake outlet channels or spillways. If this is correct, the ice sheet when these features were formed likely would have been a polythermal “sandwich” with cold ice overlain and underlain by warm ice. Further recession then led to the complete warming of the ice whereby ice marginal channels in the later deglacial times would be absent, which in fact is the case, in that Ice Marginal Channels are not found along later T7 and T8 time margins. Thus, interestingly, in this respect the absence of features is as important as their presence.
b. Examples of Ice Marginal Channels
The following are examples of Ice Marginal Channels:
Norton Pond area:
Ice Marginal Channels are evident on the map below, just west of Norton Pond, in the vicinity of an area identified as “The Hurricane.” As can be seen the Channels are prominent sinuous features, in this case very evident on VCGI’s topographic map, without the aid of LiDAR imagery. As can be seen, these features specifically descend a ridgeline “protuberance” of the terrain.
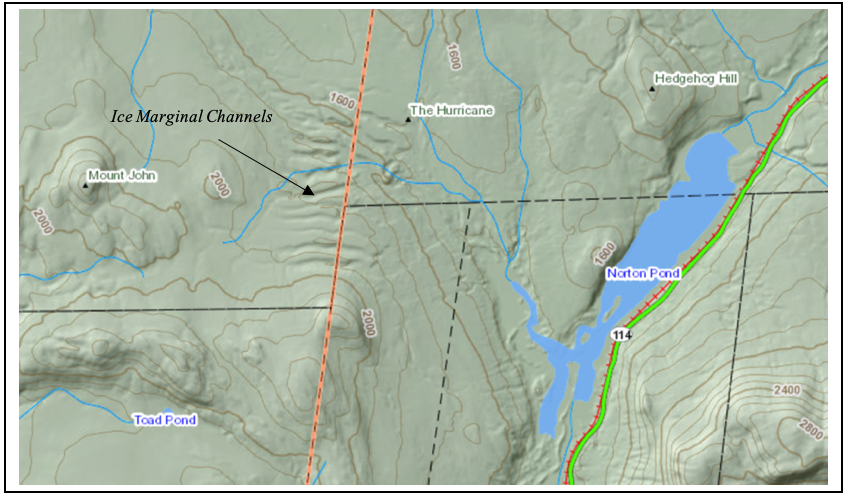
The following is an image of the same area but expanded to encompass a larger region:
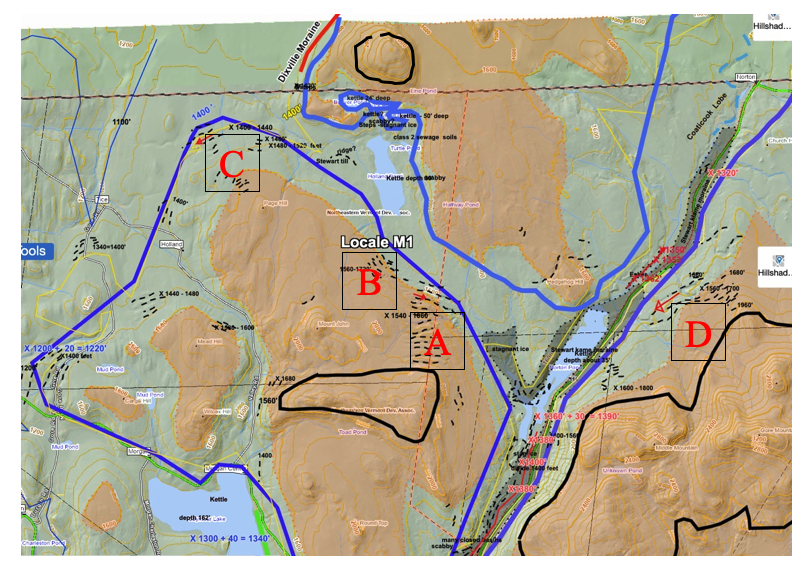
By way of orientation, Norton Pond can be identified on both maps. Ice Marginal Channels are delineated by short, black, dashed lines. Elevations on VCGI are given in English units. As part of the VCGI mapping, in order to better understand the physiography, meaning the lay of the land so to speak, terrain elevations above about 1600 feet (488 m) are marked by the ochre color. Similarly, selected contours at elevations at 2000 feet (610 m) were marked by the heavy black lines. The 1400 foot (427 m) contour elevation is marked by a thin yellow lines. The elevations of the Ice Marginal Channels are also given. These generally are “local elevations” which have not been adjusted for isostatic corrections, but in places are adjusted with elevations added by + amounts. As discussed elsewhere, the methodology for making such corrections is to adjust local elevations upward based on the distance from the Quebec border at an isostatic slope of 5 feet per mile (0.95 m/km). In as much as the location of the Norton Pond area is very close to the border, local elevations are essentially the same as the corrected elevations.
Based on the widespread occurrence of ice margin features at many locations across Vermont, a T4 margin is identified and mapped on VCGI at elevations of 1200-1400 feet (366 m – 427 m), as given in the tabular summary below for all ice margins. The T4 margin is demarcated on VCGI maps, by a heavy blue line, as can be seen on the above map. As discussed elsewhere, the T4 margin is a “hybrid” type, with an upper active ice margin portion corresponding with Ice Marginal Channels and a lower portion with stagnant ice deposits. The T4 margin marks the transition from the Nunatak Phase to the Lobate Phase in the Memphremagog Basin. As discussed elsewhere, the higher and older T3 margin marks the beginning of the Lobate Phase in southern Vermont, but in this northern Vermont location T3 time was within the Nunatak Phase. The T4 margin is correlated with the Dixville moraine in Quebec, which is identified on the above map.
As can be seen on the above map, Ice Marginal Channels on VCGI occur as nested clusters at multiple locations, with elevation ranges given for individual clusters. On the above map four example clusters are marked with large red labels as A to D. As can be seen these Channels indicate the progressive recession of the active ice margin in the Nunatak Phase from a high elevation just below 2000 feet (610 m) , downward to the T4 margin at about 1400 feet (427 m ). Again, these clusters seem to be related to terrain protuberances, which, as discussed below, are believed to be related to drainage across protuberances beneath the ice sheet margin similar to surface water spillways.
Substantial stagnant ice deposits are mapped on VCGI, as designated by gray colored areas. Again, these deposits mark the top of and beginning of the T4 Lobate Phase in the Memphremagog Basin. As shown above, stagnant deposits are mapped in the vicinity of Norton Pond at the T4 level, time, and margin. Details are discussed elsewhere herein as part of Locale M1, and are not repeated here.
Again as discussed below in the Epiphany section of this report, an“Epiphany” came from the recognition that certain Ice Marginal Channels, as suggested and discussed at length, are believed to have formed in conjunction with warmed basal ice associated with the readvance of the ice sheet in T3 /T4 time, based on correlations with these margins with features at the White Mountain Moraine System. Further, it is suggested that the Ice Marginal Channels formed in a manner likened to “outlet channels” for subglacial meltwaters at base of the ice sheet. impounded behind terrain protuberances. In the Norton Pond area, the protuberances can be seen on the above map at the four clusters. Drainage directions associated with each cluster, as indicated by topographic contours, is given by the red arrows. These give a sense of meltwater drainage and associated patterns in this area. This pattern fits with the expectable regional ice sheet gradients, which generally reflect ice supply southward from the north, with deviations adjusted so as to fit with the physiography of the “Bath Tub.”
As can be seen, drainage at cluster A is toward the southeast, in the vicinity of a protuberance. Although drainage direction at cluster B is not marked, drainage at cluster B is likely to the southeast. At cluster C and D the drainage directions are toward the southwest. Again, these directions are consistent with expectable inferred likely directions of meltwater flow within the ice sheet as governed by the ice sheet gradient so as to comport with the ice masses in local terrain.
As is very common in the region, T4 stagnant ice deposits in this area on basin floors, include prominent eskers. Elevations or esker ridge crests are taken as indicators of meltwater flow in these deposits. These directions are likewise marked by red arrows. As can be seen, drainage within the T4 stagnant ice deposit north of Norton Pond is northward, and to the south is southward, associated with a meltwater divide in the Norton Pond vicinity. The drainage patterns in this area, as discussed at length for Locale M1, show a substantial history associated with drainage from T4 stagnant ice deposits downgradient to T5 ice margin, reflecting rapid recession associated with the “Everything, All at Once, and Continuing” Style.
In general, such drainage patterns and histories are represented by Ice Marginal Channels and associated features in many locations in Vermont. Whereas these details generally are not everywhere explored and developed, further study of such features is warranted in conjunction with the step-down deglacial history as commonly identified across Vermont.
Burnt Rock Mountain
These features on VCGI’s LiDAR imagery are on the southeast flank of Burnt Rock Mountain, near Fayston, as marked by the dashed black lines on the map on the right below, at elevations from about 2000 feet to 1200 feet(610 – 366 m):
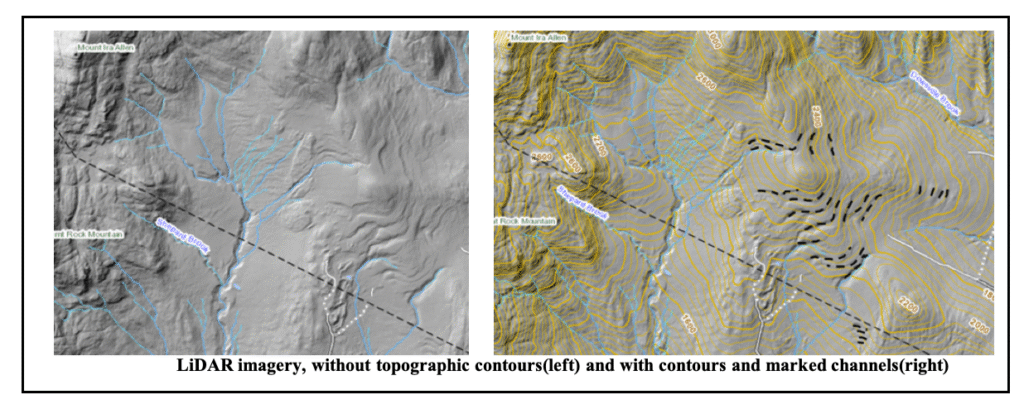
These features demarcate the position of the ice margin at an early time, with the ice sheet margin abutting against the eastern flank of the Green Mountain front range, within the interior upland portion of the Winooski Basin. The ice sheet margin at this time presumably extended along the contour at the level of the Ice Marginal Channels in the Nunatak Phase. As such, meltwater drainage was generally and regionally southward along the ice margin as dictated by the regional gradient of the ice sheet during recession. As before, the Ice Marginal Channels here are at a terrain protuberance which is taken as an indication of erosion by subglacial; meltwaters across the protrusion, which served as a local dam, favoring the development of the channels.
These features in this particular area were selected as an example, in part because they represent the ice margin at a time before the development of Lake Winooski (at T4 time), with the associated Disconnection which resulted in Scabby Terrain in deeper drainage basins on the east side of the Green Mountain front range as discussed elsewhere herein.
The following is a portion of the VCGI map in this area:
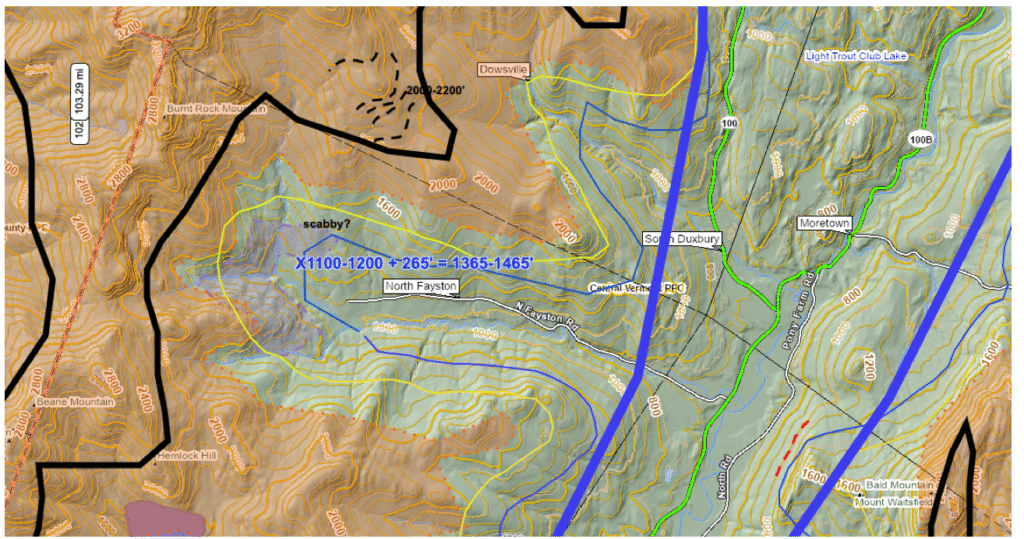
The Ice Marginal Channels are shown in the northern portion of this map. Again, the ochre colored area designates terrain above about 1600 feet (488 m) , the thin yellow line the 1400 foot (427 m) contour, the thin blue line the 1200 foot (366 m) contour, and the heavy blue line as the T4 ice margin. The T4 margin approximately corresponds with the 1200 foot contour which fundamentally is based on ice margin features associated with the T4 margin, between which the T4 margin is interpolated more or less along the contours. This map also shows the Scabby Terrain (lavender colored shading) which in this area is mapped at the head of the local drainage basin, where it is suggested that a local ice mass became Disconnected by the penetration of Lake Winooski waters along its strandline.
The following map shows the Lake Winooski strandline as mapped by Wright et al in this area:
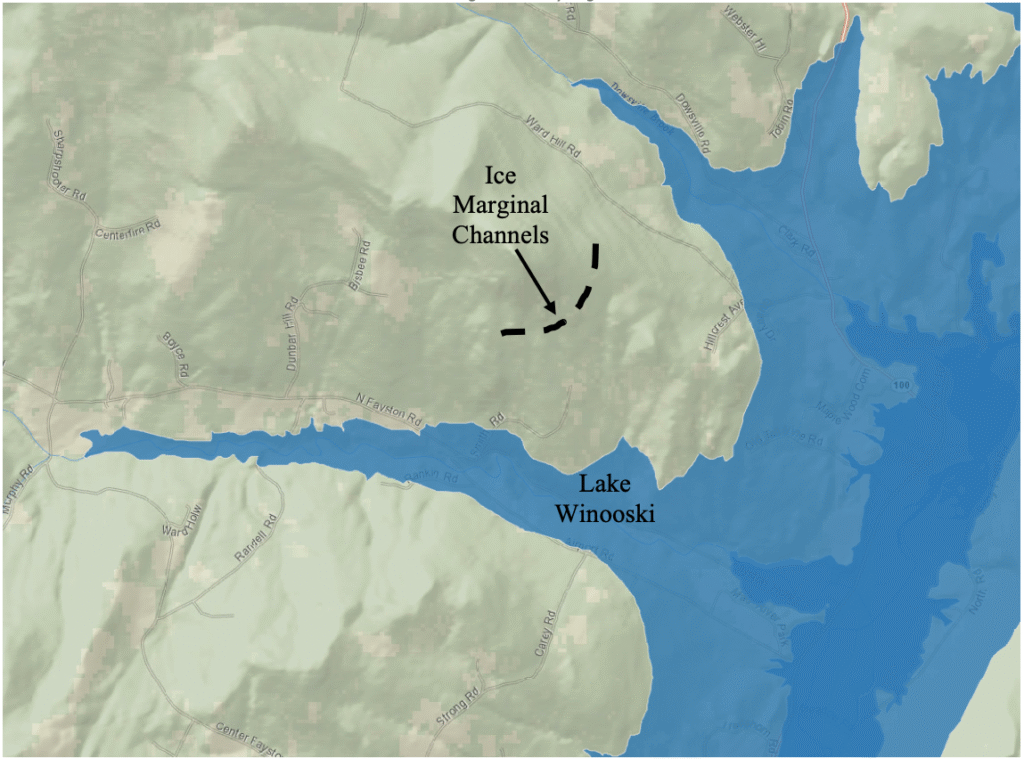
It appears that this map delineates the Lake Winooski footprint and strandline based on Wright et al’s interpretation of the elevation of Lake Winooski, with the configuration of the Lake strandline corresponding with present day topography. Obviously, postglacial erosion has altered the physiography since Lake Winooski time, but this map gives a general sense of the deglacial history associated with the development of Lake Winooski and the associated Disconnection, subsequent to the ice margin marked at a higher level by the Ice Marginal Channels. The Scabby Terrain in the headwater area of this basin is taken as an indication of local Discinnection of the ice mass in this basin, with disconnection related to the penetration of the ice mass by Lake Winooski waters.
Hardwick vicinity
The Ice Marginal Channels here correspond with the sinuous marks on the LiDAR image below. The location is in the headwaters of the Lamoille Basin near East Hardwick, where the Lamoille lobe pressed against substantially higher terrain of the Lamoille Basin headlands. The elevations of these features range from about 1200 feet(366 m) to over 2000 feet(610 m).

The image below is from VCGI mapping of the same area: with LiDAR imagery turned on:
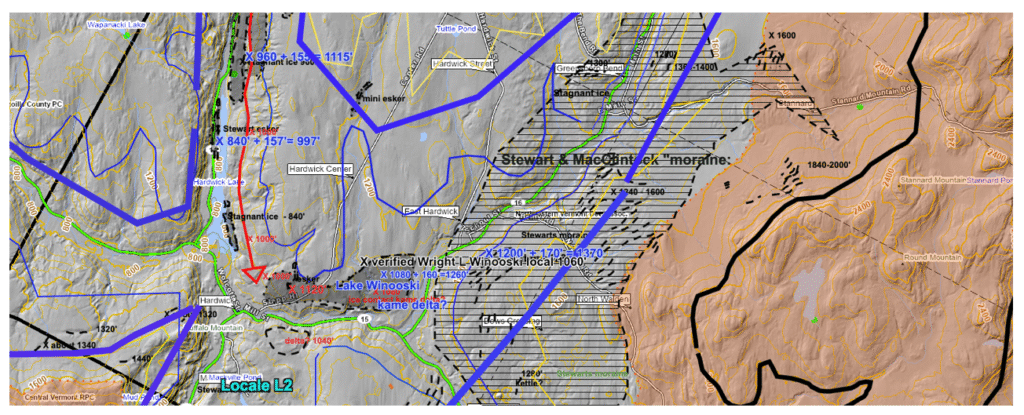
The heavy blue line represents the T4 ice margin which is drawn at the adjusted elevation of about 1400 feet(427 m), with the thin blue line marking the 1200 foot(366 m) present day topographic contour. The russet or ochre colored area is bedrock terrain above 1600 feet(488 m). The Ice Marginal Channels are marked by short dashed lines and generally are within the horizontally ruled area, which corresponds with S & M’s “moraine.” These images show many additional aspects of the deglacial history as discussed elsewhere.
In general, the ice sheet at the time of the formation of the Channels had receded from the preceding Nunatak Phase such that at T4 time, which represents the beginning of the Lobate Phase, the ice sheet in this area, again in the headwaters of the Lamoille Basin, had become confined to a distinct and discrete ice lobe, as marked by the Channels. The Channels thus represent meltwater effectively trapped on the south side of the terrain as controlled by the regional ice sheet surface gradients, behind and to the northeast of a terrain protuberance.
S & M mapped the features here mapped as Ice Marginal Channels as part of their St Johnsbury moraine, which their description suggests is composed of an ablation type till. LiDAR imagery clearly shows the till surface as sloping planar terrain, with numerous Ice Marginal Channels(marked by the dashed black lines on the VCGI map) giving the sense of ribbed topography which S & M understandably interpreted as end moraine ridges. The Ice Marginal features shown in this graphic and other features in the upper Lamoille Basin clearly delineate the T4 hybrid active ice margin and the progressive recession of the Lamoille lobe, leading to the development of the stagnant ice margin portion of the T4 hybrid margin, which is marked by the darker gray colored area. Both active and stagnant ice margins are mapped at various levels, in many places with the active ice margin at a time and level giving way to an associated stagnant ice margin, in turn followed by the recession of the active ice margin to the next younger and lower position while the stagnant ice margin was still in the process of developing. Obviously, this suggests a very different type of ice margin than traditionally interpreted, one which is difficult to portray as a simple line on a map as conventionally done.
As a parenthetical sidebar note:
The red arrow marks a “Drainage Line” which extends southward from the Black River Basin, the largest and lowest of the five drainage basins that comprise the Memphremagog Basin. This Drainage Line served as a pathway for drainage for the receding ice lobe in the Memphremagog Basin where stagnant ice meltwater drainage waters were diverted along an ice margin across multiple interfluves from the Clyde River Basin, including proglacial Lake Memphremagog drainage, with drainage southward across the divide into the Lamoille Basin. This history is discussed in more detail elsewhere in this report. Drainage Lines in some cases mark ice margins and thus can be ice marginal features as discussed below. However, the point of this sidebar here is that they provide “connective tissue” showing a correlation for ice margins in multiple Basins, as in this case between the Memphremagog Basin and the Lamoille Basin, which is part of the Champlain Basin. This type of evidence serves as further support for the identification, delineation, and correlation of ice margins across the State helping to establish the deglacial history, supporting the validity of the “Bath Tub Model.” In this case the Drainage Line is graded to a kame delta associated with Lake Winooski, thereby providing linkage with features across the Lamoille Basin, which in turn can be correlated via links to ice margins elsewhere. This particular example thus serves as evidence supporting the usage of the Bath Tub Model across large portions of the State of Vermont.
C. Information about Ice Marginal Channels from the Literature
Channels formed by fluvial erosion along the lateral sides of ice sheet and glaciers have been identified by numerous researchers. For example, Davies 1AntarcticGlaciers.org operates a website about Antarctica which provides very substantial and helpful information, including reference to features here termed “Ice Marginal Channels.” Greenwood, Clark, and Hughes(2007) 2Greenwood , Clark, C.D. and Hughes, A.L.C., 2007, Formalizing an inversion methodology for reconstructing ice-sheet retreat patterns from meltwater channels: application to the British Ice Sheet. J. Quaternary Sci., Vol. 22 pp. 637–645. ISSN 0267–8179. reconstructed the deglacial history of the British Ice Sheet by the extensive usage of such features, which is said to be particularly useful (for situations like Vermont) where end moraines are uncommon. Similar features, which closely resemble “Ice Marginal Channels” as just described, are included in published literature, as for example by Parent et Occhietti et al in Quebec, Wright in Vermont, and Franzi in New York (personal communication). In general, again such features are given different interpretations by these and various other researchers.
Davies attributes these features to subglacial erosion by meltwater near the margins of warm-based ice. This explanation fits with observations of these features in Vermont. The fact that the Ice Marginal Channels in Vermont appear only along the ice margins as opposed to beneath deeper or more central positions within ice lobes suggests that the Vermont ice sheet may have been “polythermal, ” as described in the literature, with the Ice Marginal Channels developing at or near the lateral temperature transition, close to the ice margin. Further, ice margin channels are absent or scant in younger, later portions of the history and on the slightly raised Champlain Basin floor in the vicinity of calving margin ice streams, suggesting that the ice in such areas may have been warm based.
A substantial literature exists about channels formed either at the base of the ice sheet or in the substrate beneath the ice, such as so called “Rothlisberger”and “Nye” Channels. The features identified here as Ice Marginal Channels may correspond with Nye Channels.
C. Deglacial History Significance of Ice Marginal Channels
Further study of the origin, nature, and mechanisms of formation of drainage features as identified here as Ice Marginal Channels and other evidence of drainage is warranted, both in and of themselves and as well the nature of meltwater drainage systems and the ice itself within ice sheet margins more generally. Such systems appear to have been quite complex, with drainage of meltwater by, from, within, and alongside the ice sheet, including the transfer of water from active ice margins into and through stagnant ice margins, as for example from Ice Marginal Channels into and through stagnant ice deposits via eskers, and in places alongside the ice margin in “Drainage Lines (as described in detail below).
In general, as noted above, Ice Marginal Channels provide strong support for the physiographic “Bath Tub Model,” specifically in that they show the progressive lowering of the active ice sheet with its margin closely corresponding with physiography, with lobate shaped ice masses progressively developing in drainage basins. These features document an early “Nunatak Phase” of deglacial history and show the increasing development and confinement of the ice sheet in lobes as deglaciation proceeded, transitioning into a “Lobate Phase.”
Whereas Ice Marginal Channels are mappable features, with individual channels correlating with others at comparable elevations, as noted above, in general these features were not specifically correlated on VCGI maps, except in the Memphremagog Basin where, as noted, such features suggest a correlation of an ice margin at the T4 1400 foot (427 m) elevation across the Basin, correlating and aligning with the level and trend of the Dixville moraine in Quebec.
Significantly, whereas Ice Marginal Channels are numerous and common, they are largely absent in large parts of central and southern Vermont in the Connecticut Basin. For a long time in the VCGI mapping the explanation for this was puzzling. Eventually it was realized, based on evidence from “Scabby Terrain,” as discussed below, that their absence is likely due to the fact that large parts of the ice sheet in these areas stagnated en masse, caused by “Disconnections,” as discussed in the section below on ice sheet history. Again, given the interpretation here that Ice Marginal Channels formed in conjunction with active ice, their absence in the Connecticut Basin makes sense.
Similarly, as noted previously, ice Marginal Channels are generally absent within the areas of the late deglacial ice margins, such as T8 time. This is taken as an indication that by T8 time the ice sheet in this area was “warm” and no longer polythermal.
Finally, again as discussed in a separate section of this report below, the possibility emerged, as a late “Epiphany” in this project, that Ice Marginal Channels, in particular certain Channels at particular levels, may be related to a readvance of the ice sheet (which served as a mechanism for warming basal ice) , and as such may add to and be helpful as an important “signature” which can be used in addition to the Bath Tub Model for deducing deglacial history. In examining the reported features of the White Mountain Moraine System in New Hampshire, it was recognized that not only do the ice margin elevations in this System correlate closely with elevations of ice margin features in nearby Vermont at the T3 and T4 level but that just as the correlative ice margins in Vermont are a hybrid type including both Ice Marginal Channels and associated ice margin deposits, so too the WMMS features include closely associated Ice Marginal Channels and ice margin deposits. In as much as the WMMS is reportedly associated with a readvance, with suggested possible correlation with reported readvance features in Vermont, this raises the possibility, as just noted, that perhaps the readvance is related to the formation of Ice Marginal Channels.
Briefly stated, given that Ice Margin Channels are here interpreted as having formed beneath the ice close to the ice margin of active, polythermal ice, perhaps the readvance served as a mechanism for heating the base of the ice sheet, by the ice advancing across deglaciated and warmed terrain which thus served to warm the basal ice of the readvancing ice sheet. Ice Margin Channels in Vermont are found at and above the T4 level, but as well at and above the T3 level. The hypothesis advanced here is that the T3 and T4 Ice Marginal Channels and associated stagnant ice deposits in Vermont can serve as signature markers for deglacial history, by which the T3 and T4 levels across the State of Vermont can be correlated, independent of the usage of the Bath Tub Model, and as well marking a readvance. This is an important proposition. Not only does it serve to validate the Bath Tub Model, but it as well provides a deglacial history marker, a “Signature,” independent of the Bath Tub Model, for correlating ice margins across the State of Vermont in a manner related to an important event. This does not necessarily mean that all Ice Marginal Channels represent a readvance. It is possible that, for example, more minor oscillations may as well serve to warm basal ice to a polythermal condition. Or it is possible that some Ice Marginal Channels may form by means and conditions other than oscillations or readvance. In any case, the combined hybrid ice margin features at the T3 and T4 levels represent such a prominent and distinctive pattern at many places across the Vermont, that regardless of the explanation, whether in conjunction with oscillations or a readvance, they nevertheless represent a bonafide deglacial history marker “Signature.”