The map shown here depicts the T8 ice margin:
As a parenthetical note, once again, this depiction of T8 time has been revised by the Addendum findings.
As with previous T time maps, owing to scale limitations this map is highly generalized and drawn schematically. More details about the T8 time, level , and margin are given in the text above and for various Locales. At an early time in the VCGI mapping it was recognized that Champlain Sea deltaic deposits in the Missisquoi Basin are ice contact, kame delta types, formed in close proximity to the ice margin at a level identified as T8.
The specific details in this regard are discussed in Locales CV5, CV6, and CV8. As discussed in the preceding, at an early time the mapping of ice margins in the Champlain Basin was conditioned by my conventional paradigm, which in this case was the expectation that the presence of the Champlain Sea in Vermont required that the ice margin be located to the north in Quebec to allow the Champlain Sea to enter the Champlain Basin in Vermont. Thus, the T8 margin was drawn, as guided by ice margin features and elevations to indicate a thin lobe tip extending up the Missisquoi Basin. At that early time, the southernmost evidence of ice presence in T8 time was at Greens Corners, northeast of St Albans, where a kame terrace was mapped at the head of Sweet Hollow, with the evidence suggesting drainage down the Hollow grading into deltaic deposits at the Champlain Sea level, as mapped by Stewart and MacClintock and myself (Wagner, 1972). Additional study led to grooves now identified as Ice Tongue Grooves, as discussed above. Again, my thinking at the time, therefore was that the ice margin likely extended westward from the Greens Corners area, toward New York, as a calving lobe tip margin.
Also, a report by Cannon (1964) and by me (Wagner,1972) recognized evidence of a readvance, including silt-clay bottom-set deposits and till, on the top, upper surface of Champlain Sea deltas. Thus, the T8 margin was taken as indicating a readvance. Intriguingly, the Ice Tongue Grooves appear to mark a progression, with the easternmost Grooves apparently graded to deltaic deposits at the Champlain Sea marine limit, and the western Grooves graded to Champlain Sea deposits below the marine limit.
My original interpretation of the T8 margin as just described being blunted and limited to the northern portion of the basin began to run into problems during my VCGI mapping of the La Platte Basin, and then the Otter Creek Basin, and as well the intervening Lewis Creek, Little Otter Creek, and New Haven River Basins, where multiple pieces of evidence such as described in the preceding indicated the presence of an ice margin in T8 time. This is not just multiple individual pierces of evidence but collectively together these comprise a relatively robust and coherent deglacial history story.
Thus, I had what I refer to as an epiphany, actually a series of multiple epiphanies, (which has been the nature of this entire project starting from an early time with Scabby Terrain and Disconnections, Ice Marginal Channels as possibly being related to a warming of basal ice by a readvance, and so on). In this case, this particular epiphany was that the Champlain lobe extended southward as a long convex lobe in Champlain Sea time, apparently including a readvance. Epiphanies have a way of evolving, or metastasizing, to use a medical metaphor. In this case, this had to do with the lateness of the entire deglacial history and the speed of the ice recession: 1) T3/T4 time is correlated with Thompson et al’s White Mountain Moraine System which is dated at about 13,800- 14,000 years BP; 2) according to Cronin et al, the incursion of the Champlain Sea in Vermont is dated as slightly younger than 13,000.. and thus the T8 readvance is slightly younger.
Epiphanies have a way of creeping up on one, like the feeling of a bad cold coming on. I say this because even now, as I write this, I am beginning to sense yet another epiphany. This latest “attack” relates to my recent conversation with David Franzi in which he expressed skepticism about my finding that the T8 Champlain lobe extended far to the south in Champlain Sea time. As noted in the preceding, David’s mapping in New York suggests to him that the Champlain lobe margin in Fort Ann and Champlain Sea times was much further north, much as suggested by Chapman in his classic study of Champlain Basin strandlines, and similarly by Parent and Ouchietti in Quebec. In response, again as noted in the preceding, I observed that my mapping indicates that the deglacial history of the Champlain lobe on the New York side differed from Vermont, by the early development of a calving margin which led to a large open water area on the western side of the Basin. David’s second argument is that his theoretical calculations indicate that it was not possible for the ice sheet to sustain such a long lobe, to which I responded that in fact the T8 lobe represented a residual ice mass from an earlier time when the ice had extended further south.
Whereas this second argument may be correct, an alternative interpretation, this possibly being the birth of the new epiphany, is that in fact T7 and T8 time may actually represent the “collapse” of the Champlain lobe, marked by active ice “convulsions.” A cursory review of the literature suggests that such convulsive or spasmodic behavior has been reported, as documented by modern ice sheets, by late Pleistocene events of the Laurentide ice sheet elsewhere, and as well by theoretical modeling of ice sheet dynamics. However, rather than chase this possibility down yet another epiphany ‘rabbit hole,” it would seem this is in fact a good time for me to simply observe, as has been so often, repeatedly stated in this tome, “more research is needed.” But the nature of ice sheet collapse may be among the more important topics of this study.
As a side bar, the following is a summary which is intentionally repetitious of information given above in order to give an overview of the deglacial history but with added detail:
When I initially identified ice margin features at the T8 level and time, in the Missisquoi Basin in the Berkshire vicinity at Locale CV5, as described elsewhere herein, I recognized that this ice margin was closely related to the Champlain Sea. I also recognized that the elevation of the Berkshire stagnant ice deposit at the T6 level is similar to the elevation of the Sutton moraine in Quebec, and likely is correlative with that feature. As discussed for this Locale, a close examination of the physiography using the Bath Tub Model indicated that the ice sheet margin, marked by the Sutton moraine, could have extended into the Berkshire area in a variety of different ways, meaning by different shapes of the ice margin. This led to the delineation of an ice margin indicating that the Berkshire deposit likely formed at the juncture of multiple sublobes, including: 1) a lobe extending eastward up the Missisquoi Basin, bifurcating into a sublobe extending northeastward up the Lake Carmi basin and a sublobe reaching the Berkshire area via a direct route on the Missisquoi Basin floor; 2) a sublobe extending directly southward down the Pike River Basin from the Sutton, Quebec vicinity to the Berkshire area; 3) a sublobe extending southwesterly down the Missisquoi Basin floor from Quebec. The Berkshire deposit likely was formed by a complex configuration of the ice margin, with step-down recession in T6-T8 time. The above map is too generalized at this regional scale to show such details.
I also recognized, going back to my work in the Missisquoi Basin in the 1970s, that the evidence indicates a readvance of the ice sheet in Champlain Sea time, again as discussed above. This was supported Cannon’s report1 Cannon, W.F., 1964 Report of Progress: 1964, The Pleistocene Geology of the Enosburg Falls Quadrangle, Vermont. Open file Report No 1964-1, 25 p. This reference apparently is mislabeled online as “Pleistocene geology of the northern Champlain Islands and Alburg peninsula, ” with the Champlain Islands report missing. on the Enosburg Falls Quadrangle which also identified evidence of a readvance in Champlain Sea time, although Cannon’s paradigm-ic mind set would not allow him to suggest a readvance in Champlain Sea time because he believed that by Champlain Sea time the ice sheet had receded to the north in order to allow the entry of the Sea into Vermont. This is discussed further under the heading of “Paradigm Trap” in regard to the shape of the ice sheet in the Champlain Basin and its northward versus westward ice margin recession. I too struggled to fit all the evidence together, and repeatedly had to fight to overcome my mental bias associated with the conventional mindset that the ice margin recession entailed a northward retreat of a relatively flat ice margin in plan view.
Interestingly, Cannon, who as an assistant to Stewart and MacClintock in their statewide surficial mapping project for the Vermont Geological Survey reported on the Enosburg Falls Quadrangle, in the Missisquoi Basin, likewise had the issue of the ice margin configuration in mind, particularly with regard to his striation information.2 This observation gets to the timing when striations are formed, relative to whether or not this is during advance versus recession of the ice, or different times within the recession. This also speaks to the issue of warm versus cold based ice, the suggestion being that these late striations may have been associated with warm based ice. And this as well relates to the issue of the Glacial Dynamics of the ice margin, the possibility being that warm based ice may more closely correspond with physiography. His report provides some interesting observations:
- P. 2: Striae and grooves which indicate ice movement directions are said to be “extremely abundant, ” indicating a north to south ice movement in the central lowlands as compared to a more northwest to southeast direction along the margin of the lobe in the eastern portion: “From these data it appears that the last ice to cross the region advanced from the northwest but was deflected toward a more north-south flow by the topographic control of the Champlain Lowland and the “Green Mountain front.” This observation pertains to the influence of physiography, per the Bath Tub Model and relates to the sustenance of the ice lobe in the Missisquoi Basin. Further, if in fact the ice movement in the lowland had become “deflected” to a more north to south direction, then the ability of the ice sheet to sustain a long convex ice lobe in the basin, as ultimately found as my VCGI mapping progressed and as discussed in the following for T8 time, may have been more easily accomplished than by an ice flow from the northwest.
- P. 3: “Tongues of ice apparently extended down the major valleys for a period of time after the main ice mass had retreated from the area and in some cases readvanced into formerly deglaciated valleys. The direction of movement of these ice tongues was controlled by the trend of the valleys and was not necessarily parallel to the flow of the main ice mass.”
- P. 4: Cannon then gives specific documentation of evidence for a “readvance,” stating: “From this it is evident that the valley (meaning the Missisquoi) was ice free for a significant period of time before ice readvanced and deposited the till.” Whereas Cannon recognized that the evidence suggested a readvance in Champlain Sea time, as noted above he apparently found this to be too much for him to suggest such a readvance in Champlain Sea time based on his paradigm-ic model belief system which reflected the commonly held view that by Champlain Sea time the ice margin had receded far to the north (into Quebec) to allow entry of the Sea into the Champlain Basin, and therefore was unable to report this as a Champlain Sea readvance as such, as being more substantial than he believed likely.
- P. 5: “A final case where active valley ice seems likely is in the Lake Carmi valley. Lake Carmi occupies a depression in a broad glacial trough trending north-northeast. The sides of the trough are covered with a nearly continuous layer of till but no lacustrine deposits were found although the elevation of much of the valley sides is below the supposed level of Lake Vermont.” Per this quote, Cannon’s observation about active ice seems obvious but is helpful to bear in mind.His comment about till without a lacustrine cover is reminiscent of my mapping of the north side of the Missisquoi Basin in the 1970s, where fresh looking, boulder strewn till ground moraine was identified. I recognized at the time that this likely was significant, but its meaning was not understood. This ground moraine terrain is remarkably bouldery and fresh looking(for example, resembling the bouldery-ness of Pinedale deposits in the Rocky Mountains). In general, such fresh-looking glacial terrain is not found elsewhere in Vermont. This may also relate to the fact that Fort Ann deltas on the north side of the Basin are likewise spotty and less evident than expected. In general, I take this as indicating that this area was within the footprint of the T8 ice readvance, or less likely that this area remained ice covered until a late time.
Returning to the work related to the configuration of the ice margin in the Missisquoi Basin, I also recognized at an early time that Ice Tongue Groves at the mouth of the Basin likewise include both active ice Bedrock Grooves and stagnant ice features, specifically near Greens Corners, suggestive of and consistent with a step-down recession of the ice margin which was hybrid in nature, leading to the Ice Tongue Grooves which are graded to the Champlain Sea at the marine limit and as well lower level. A stagnant ice deposit at the head of the largest Groove fits with a T8 margin, with drainage extending down the Groove, graded to deltaic deposits at the Champlain Sea level. Taken together, the features in this area indicate a hybrid type ice margin with both active and stagnant ice margins in a step- down recessional mode, presumably associated with the ice margin “readvance”(or oscillation), with a very close relationship between the ice margin and the terrain physiography. The step-down pattern of recession is especially well marked in the area south east of the village of Greens Corners, along the foothill front, where Bedrock Grooves and deflected stream drainage patterns mark this recession. Interestingly, whereas most of the Ice Tongue Grooves appear to be graded to Champlain Sea deltaic deposits at the marine limit, the westernmost and youngest Groove, as part of the step-down recession, appears to be graded to a deltaic deposit at the Burlington or Port Kent Stade of the Champlain Sea. More detailed study of this area is needed, but if correct this evidence would suggest that the T8 ice margin persisted, with progressive recession, during a prolonged period of Champlain Sea time.
The features near Greens Corners just described came to my attention in 2023 during a bike ride on the Missisquoi Rail Trail. I was reminded of my mapping in that area in the early 1970s. That led to my taking a fresh look, with the benefit of VCGI and LiDAR imagery, which turned out for me to be astounding. In turn this led to an open letter to the Vermont State Geologist aimed at calling attention to this area which seemed to provide important deglacial history information. As it turned out, this was the beginning of my Statewide mapping as reported here. Appendix E contains my open letter. This letter is included here as it presents information bearing on the T8 margin and time, including evidence which I now see as especially important, particularly with regard to the step-down sequence, and the T8 margin,(though in 2023 I did not at that time recognize T margins) including the suggestion that the T8 margin receded trough time from the maximum readvance position at Champlain Sea marine limit time and perhaps continuing to times of lower Champlain Sea stades. It needs to be kept in mind that a) the Champlain Sea marine limit strandline and the T8 ice margin were diachronic Thus, details of this history still need to be resolved.
As noted above, the T8 margin was drawn at an early time so as to extend from the Berkshire and Enosburg Falls area to the Greens Corners area, the question then became as to where this ice margin extended. Again, without my realizing it at the time, my mental thinking (ie., “Paradigm Trap”) conditioned me to think that the T 8 margin likely extended westward across the Champlain Basin toward New York, as a calving margin. Thus, early drafts of ice margins indicated that the T8 margin extended westward toward New York State.
However, again at this early time in my VCGI mapping, I also recognized that the Champlain Basin floor is relatively low and flat, extending far southward, to and beyond the Taconics. Recent glaciological literature suggests that ice sheets in similar settings, including and especially with reverse gradient conditions as in this case, face a Glacial Dynamic where ice flow tends to extend the ice margin as a convexity, in this case southward in the Basin, while calving tends to cause the ice margin to recede as a concavity. In essence, these two factors represent a Dynamic which determined the shape of the Champlain Basin ice lobe, as to its being relatively convex versus flattened and concave. The literature indicates that as a consequence of this Dynamic, ice margins may be substantially convex or concave, or irregular. Again, in the case of my early mapping I delineated the ice margin as flattened, extending westward from the Missisquoi Basin across the Champlain Basin toward New York, as I believed that the receding margin of the Champlain lobe likely was calving, and at that time I had no evidence of ice margin features at the T8 level to the south. For reasons discussed elsewhere, the T8 margin likely was believed to extend westward to a position located north of Covey Hill in Quebec.
As the VCGI mapping progressed, particularly in the LaPlatte Basin, I recognized that the features in this basin represent a calving margin, with the evidence indicating progressive recession of the ice margin of the LaPlatte ice stream in the Middlebury Bench, beginning with the lowering of Lake Vermont from the Coveville to the Fort Ann level. The evidence from VCGI identified a Ribbed Lacustrine deposit on the lower LaPlatte at an elevation consistent with Fort Ann. However, at the LaBerge farm, a short distance downvalley to the west, field examination of a deposit, which Stewart and MacClintock identified as a stagnant ice deposit, suggested that this deposit likely is a deltaic deposit formed at the Champlain Sea, but with evidence of a) a silt-clay cover which is consistent with the readvance identified in the Missisquoi Basin associated with the Champlain Sea, and b) pockets of coarse-grained gravelly material which are inconsistent with the “normally” placid conditions associated with deltaic deposition, but suggestive perhaps of a nearby ice margin in the proximity to the delta – at the Champlain Sea level.
Repeated field visits to this area confirmed that the nearby Ribbed Lacustine deposit along the LaPlatte includes buried gravel material with a lacustrine silt-clay cover, as expected for such a deposit. Ribbed Lacustrine deposits formed where and when the ice margin rapidly receded, so as to allow for their submergence, whereby melting ice still in the stagnant ice deposit became overlain by fine grained sediment, which then became grooved as the buried ice continued to melt and the water levels lowered. This particular Ribbed Lacustrine deposit was at the recessional end of the Fort Ann sequence, suggesting its formation in conjunction with the Fort Ann to Champlain Sea transition. Further, the pattern of the LaPlatte River in this vicinity marks a striking change, consistent with drainage along an ice margin marked by this deposit, with flow direction deviating westward consistent with recession of the ice margin, and the lowering of water levels from Fort Ann to the Champlain Sea.
Across the River from the Ribbed Lacustrine deposit to the west, in the vicinity of the old Charlotte landfill, the topography in places appears to be slightly kamic, with a silt-clay cover, with stone and boulder content varying greatly from place to place, in places being very stony.
The “clincher” for me came from the literature for previous research from two sources:
First, the description given by Wright in his report for the northern portion of the Town of Charlotte, of an exposure of a “Deformation Till,” which he interpreted as indicating a significant readvance with climatic implications. Whereas I had previously interpreted this deposit as more consistent with an oscillation of the ice margin associated with the Champlain Sea delta, the point here is that either way the presence of the ice margin is indicated in close proximity to the Champlain Sea, at an elevation which correlates with the T8 margin far to the north in the Missisquoi Basin. Further, examination of VCGI suggests similar features, in the Little Otter Creek and New Haven River basins, including similar deposits and stream pattern deviation, though further field work in this area is needed. Calkin’s reports in this area are likewise consistent with this interpretation.
And second, “Ice Marginal Lines,” which are features still incompletely documented and understood, and only tentatively recognized, located on the Basin floor immediately southwest of Snake Mountain, are a) at an elevation correlative with the T8 margin, and b) are in the vicinity of features which Connally interpreted as indictive of his so-called “Bridport readvance.” This readvance has been disputed in subsequent literature and unfortunately, as Connally indicated, the exposure displaying his evidence no longer exists. However, his report presents photos which certainly appear to be compatible with ice margin oscillations, perhaps a readvance. This is in close proximity to the Champlain Sea limit.
Again, as my examination of the evidence regarding the T8 margin progressed I recognized the possibility that Connally’s Bridport readvance and the Ice Marginal Lines may represent the T8 margin. In fact, the VCGI evidence indicates that the ice margin on the floor of the Basin in the Otter Creek re-entrant is marked by calving ice margin features associated with the T7 margin at the Fort Ann level, with the evidence suggesting recession to a T8 level, whereby the Otter Creek Champlain Sea delta was formed in close proximity to an ice margin, consistent with Connally’s evidence and as well the Ice Marginal Lines at the T8 level and time.
Thus, the T8 margin was redrawn as depicted on the above map so as to indicate a long convex lobe extending southward from the Missisquoi Basin. The Champlain lobe in T8 time is depicted here as a relatively long and convex ice lobe based on the correlation of ice marginal features associated with the Champlain Sea at the marine limit in the Missisquoi Basin, in the La Platte Basin, suspected similar ice margin features in the Little Otter Creek and New Haven River Basins, the linear features immediately southwest of Snake Mountain, and as well the evidence of ice readvance or oscillation in the Bridport area, all in close association with the marine limit.
The margin of the southern side of this T8 lobe was calving, as suggested by bouldery silt-clay deposits as depicted on the State surficial geologic map, at and below the marine limit, extending northward from the Bridport area to the Quebec border, marking the recession of the ice margin in T8 time or post T8 time. As discussed above, the evidence in the Missisquoi Basin indicates that the ice sheet readvanced so as to partially veneer Champlain Sea deltas with lacustrine or marine sediment and till, as discussed previously by Cannon(1964) and by Wagner(1972). The T8 margin depicted here is taken to mark the ice margin associated with this readvance, and likely correlates with evidence reported by Wright in the Charlotte area and Connally in the Bridport area, and perhaps Calkin in the Middlebury area. Whereas Wright and Connally inferred this readvance as having climatic significance, this may instead have been a more substantial oscillation of the ice margin as suggested by Calkin (date uncertain but likely in the 1960s), with no climatic significance. In any case, the matter of climate variation can not be examined with VCGI information alone as reported here.
The VCGI evidence suggest that the T8 margin was associated with the Champlain Sea at the marine limit, but representing a readvance after a recession when the Champlain Sea had already developed at the marine limit. However, some evidence suggests that the ice margin may have persisted and been present in conjunction with lower Champlain Sea strandlines. This includes the later Ice Tongue Grooves at Greens Corners and possible Ice Marginal Lines on the basin floor north of Swanton in the Highgate area. The. origin of these features is as yet of uncertain but it is possible that they represent a late T8 or post T8 recessional position, perhaps marking a T9 ice margin and time.
Two locations are especially intriguing. The first is in the central Champlain Basin near Snake Mountain per the following VCGI map:
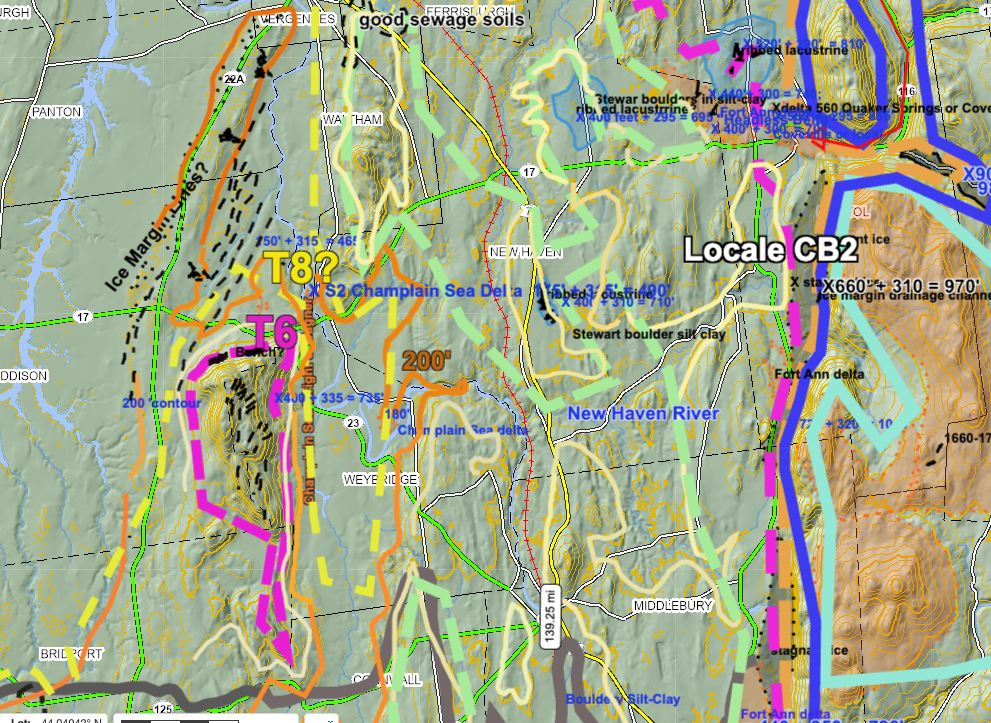
As can be seen, the map shows the progressive recession of the Champlain lobe, including the T3 (turquoise), T4 (blue), T5 (orange), T6 (maroon), T7 light green) and T8 (yellow), essentially the entire deglacial history of the Champlain lobe in its Lobate Phase, depicting the westward shifting of the ice margin in recession (which again relates to one of my epiphanies.) The orange line near Snake Mountain is the Champlain Sea strandline, which as can be seen extends into the mouth of Otter Creek Basin. The features of particular interest here are the “Ice Marginal Lines,” possibly MegaScale Linears, on the basin floor southwest of Vergennes, and the Ice Marginal Lines on the east flank of Snake Mountain. These features, in the context of the Otter Creek and main basin “ice streams” cry out for further study.
The second area is in northwestern Vermont, north of the Swanton area, as just noted. The screen shot below shows this northwestern area including the Ice Marginal Lines and the T8 margin. Unfortunately, the quirky digital nature of VCGI layers at the time this screenshot was made makes it difficult to see all of the information marked on this map. However, the Ice Marginal Lines(?) likewise deserve study.

The T8 margin as now mapped has implications bearing on both the deglacial history and the issue of global warming. From the deglacial history perspective, it appears that the receding Laurentide ice margin in Vermont was progressive, with a stillstand at the T4 level which may correspond with a readvance corresponding with the evidence in New Hampshire. This was followed by step-down recession from T4 to T8, with another ice margin oscillation/readvance. The readvance/ oscillation in the Champlain Basin may have actually been relatively minor when examined in the context of a long convex ice lobe. Further, given the evidence from modern glaciers and ice sheets showing that ice margins can vary from recession to stillstand to advance at the same time, it is possible that these oscillations/readvances may have been local.
From the point of view of global warming, the interpretation given here indicates that physiography played an important role in the ice sheet’s recession. It appears that the Middlebury Bench served as an important support for the Champlain lobe, buttressing the ice sheet whereby it extend far to the south in the eastern part of the basin, but that calving, initially in the “Deep Lake” portion, and subsequently along multiple ice streams in the Middlebury Bench, led to a T8 position which was subsequently followed by recession to a possible but not yet marked T9(?) position, entailing recession over a long distance, likely in a short time. The message here is that physiographic irregularities show their influence locally but with time lead to coalescing water bodies, and that standing water serves as a penetrant to accelerate recession. This suggests that concerns for present day ice sheets, ice caps, and glaciers should focus on such physiographic irregularities along and beneath ice masses, and associated water body coalesence. And in fact, this awareness is indicted by recent studies, as illustrated for example by a recent NY Times article. 3 https://www.nytimes.com/2025/08/07/climate/argentina-perito-moreno-glacier.html?smid=nytcore-ios-share&referringSource=articleShare This article stems from a report by Koch et al for the Perito Moreno glacier in Patgonia: https://www.nature.com/articles/s43247-025-02515-7 As suggested in the section of this present report on global warming, the Greenland Ice Sheet would seem to be especially pertinent to such a concern.