By T7 time the Memphremagog Basin in Vermont was ice free, the only remaining ice being a remnant lobe in the Champlain Basin. No regional map for T7 time is given here, in as much as T7 time is bracketed by the late T6 and T8 ice margins, which together give a sense of the trace of the intervening T7 ice margin, and because the ice margin was diachronic and shifted position significantly in T7 time. Significant changes occurred in the Champlain Basin in T7 time. These changes are interpreted as being associated with calving.
When I first began this VCGI mapping, after the various T levels and times had been identified, the southernmost position of the T7 margin of the Champlain lobe was believed to be marked by eskers in the Essex area. These are graded southward to the Winooski Basin delta at the Fort Ann level, on the north side of the Winooski basin. As noted elsewhere in this report, my thinking in regard to the ice margin deglacial history in the Champlain Basin at that time was that calving likely occurred. This was mostly a presumption, based on the presence of Lake Vermont along the receding margin, including its substantial depth. My thinking back then was that such calving likely resulted in the flattening of the Champlain lobe. Thus, my original mapping identified the T7 margin marking the eastern side of the Champlain lobe as extending southward along the foothills to the Essex area, with the margin then extending westward across the basin toward New York, marking the frontal margin of the lobe which I presumed was flattened by calving. At that time I had not identified any actual ice margin features associated with calving. As discussed elsewhere, in retrospect such thinking illustrates what I refer to in this report as a “Paradigm Trap.”
As my VCGI mapping progressed I began to discover evidence indicating that the T7 margin extended further southward, marking the margin of a longer convex lobe. Some of this evidence came from my mapping in the 1960s and 1970s, but back then had not been understood. Some of this information came from literature reports. And some came from my recent VCGI mapping and limited field investigation. For example:
- A report by Springston and DeSimone in the Williston area along Sucker Brook, on the south side of the Winooski Basin, identifies deposits which they suggest were produced by drainage in close proximity to the ice margin. My further study of these deposits indicate that these are at the T7 ice margin level and time, likely deltaic deposits related to the lowering of Lake Vermont from the Coveville to the Fort Ann levels.
- In the LaPlatte Basin, in its headwater area, are deposits which in the 1970s I identified as “Ribbed Lacustrine” but did not understand. VCGI mapping and limited field work led to the identification of these as calving ice margin features in the LaPlatte Basin, marking the progressive recession of the La Platte ice margin ice stream, one of five such ice streams that I eventually mapped in what is referred to here as the “Middlebury Bench.” This mapping identified calving in the LaPlatte Basin , possibly the Lewis Creek Basin, the Little Otter Creek and New Haven River Basins, and the Otter Creek Basin. The VCGI evidence indicates these deposits were formed at the transition between the late T6 and T7 times corresponding with the lowering from Coveville to Fort Ann levels.
- Further down the LaPlatte Basin is another Ribbed Lacustrine deposit (one of many such deposits now identified and mapped in the region). This particular deposit indicates the triggering of calving associated with the lowering of the Fort Ann Lake Vermont to the Champlain Sea. In fact, nearby are deposits, slightly further down to the west along the LaPlatte, which Stewart and MacClintock interpreted as kame terrace, but field investigation in 2025 indicated as deltaic at the Champlain Sea level, with evidence of a high energy sediment source nearby.
- Still further, Wright, who mapped the Charlotte area, identified an exposure along the LaPlatte, just east of Spear Street, which shows structural deformation which he interpreted as “Deformation Till” representing a “readvance.‘ My examination of this exposure indicates it is located at the upstream apex of the LaPlatte Champlain Sea delta, with structural deformation of deltaic sediment and not till, and more likely represents a calving margin oscillation. Regardless of how the deformation occurred it represents the presence of the ice margin in T8 time, in conjunction with the Champlain Sea.
- The nearby Ribbed Lacustrine deposit at the T7 level thus is interpreted as representing the transition from Fort Ann to Champlain Sea levels, the inference being that this transition served as a second trigger resulting in instability and calving. In fact, the path taken by the LaPlatte takes a sudden turn at this location, which is consistent with an ice margin and its subsequent retreat.
- My interpretation of Wright’s exposure neither requires nor precludes a readvance. However: a) These deposits correlate with Connally’s Bridport readvance evidence and with readvance evidence in the Missisquoi Basin from Cannon (1964) and my own 1972 report, both at T8 time in conjunction with the Champlain Sea, leading me to concur with Wright’s interpretation, but again specifically in T8 and Champlain Sea time, and b) The evidence in all five re-entrant basins in the Middlebury Bench, which is interpreted here as indicating calving ice streams show ice margin positions at both the Fort and Champlain Sea levels, with substantial information telling a relatively robust and persuasive story consistent with ice presence at T7 and T8 times.
The evidence thus suggests a long convex Champlain lobe in T7 and T8 times, and as well Fort Ann and Champlain Sea times. Further, as discussed below, the evidence indicates that these represent the recessional calving margins of five ice streams in the Middlebury Bench. For me this was startling and not easy to accept. Thus, I suffered from recurring multiple “Epiphanies” which challenged my conventional Paradigm, in the end forcing me to an unconventional interpretation.
Dave Franzi and I have discussed this interpretation at length. He does not believe the evidence in New York indicates such a long convex lobe. My rejoinder is that the evidence indicates that the first phase of calving in early T6 time, as just described in the preceding, resulted in the development of a large open water area on the western. New York portion of the Basin associated with calving in the “Deep Lake” portion of the Basin physiography, and that open water area expanded substantially in T7 and T8 time, such that the lack of ice margin evidence in New York supporting a long convex lobe is not surprising but in fact fits with the deglacial history reported here. Dave also believes that his calculated ice sheet surface profiles indicate that it was not possible for the ice sheet to sustain such a long convex lobe. And my rejoinder is that in fact the evidence indicates that the ice sheet did not necessarily sustain the lobe, but in fact represents remnant ice associated with rapid recession, essentially indicating the collapse of the Champlain lobe.
Related to the question of whether or not the ice margin for this lobe in T7 and T8 times was actively supplied, which is at the heart of Franzi’s skepticism , is whether or not the evidence reported here for five calving ice streams truly was “active” ice. The structural evidence reported by Wight and Connally would seem to indicate the presence of active ice, regardless of whether or not this entailed a readvance or an oscillation. My own evidence for calving stems from 1) Ribbed Lacustrine deposits, 2) Headless Deltas, and 3) Thickened Bouldery Silt-Clay deposits forming exceptionally flat bottomed basin floors. The first and second of these actually represent stagnant ice-cored deposits left behind when water levels suddenly lowered, and are not strictly speaking true grounding line deposits, and by definition are indicative of stagnant, not active ice. The third type deposits were inferred to represent substantial sediment delivery to the frontal tips of ice streams, suggestive of active ice. An alternative hypothesis is that these “ice streams” instead were simply residual stagnant ice masses in basin floors through which substantial sediment was delivered to the standing waters in these lowlands. This interpretation fits with the very substantial stagnant ice deposit marking the late T6 and T7 ice margin immediately south of Williston. In fact, LiDAR imagery shows curvilinear traces suggestive of drainage and an esker within the ice mass, with drainage graded to the Fort Ann level in the Hinesburg area, in the LaPlatte Basin. But generally speaking major, substantial stagnant ice deposits have not been found in the Basin floors as would correspond with the ice streams.
This issue of whether or not these long convex lobes in T7 and T8 time represented active ice again speaks to the heart of Franzi’s contention, and is not fully resolved here and deserves further study. The evidence indicates that the Champlain lobe margins in T3-T6 times were hybrid types, including both active and stagnant ice components. For example, the T3 – T6 margins included as Marginal Channels and Bedrock Grooves. Further, the ice dam across the Winooski Basin which resulted in Lakes Winooski and Mansfield is interpreted as indicative of active ice. The recession in late T6 and T7 time is marked by Ice Tongue Grooves at the mouth of the Winooski Basin which are interpreted as indicating destabilization associated with the lowering of Lake Vermont from the Coveville to the Fort Ann levels. Still further, whereas Ice Marginal Channels, which are believed to be associated with polythermal active ice margins associated with the T3/T4 readvance are not found along T7 and T8 ice margins, which may indicate that the ice was both warm and inactive. But again, all of this is intriguing and deserving of further study. It is possible that whereas the readvance identified at T8 time in the Missisquoi Basin was a true active ice event, but instead merely served to cause “oscillations” further south, as for example related to Wright and Connally “readvance” interpretations, in effect the dying gasps of the Champlain lobe.
Much of the evidence for the story as just described has already been presented in the preceding discussion of calving ice margins. In as much as this history is obviously important, not just from a historical point of view but also for its implications for modern day global warming, the highlights are presented in the following as part of the telling of this deglacial history in T7 and T8 time.
a. T7 Time North of the Winooski
As just indicted a regional map for T7 time is not specifically presented here, as being unnecessary. Whereas the ice margin recession south of the Winooski Basin is marked by a T3 to T6 step-down sequence, to the north of the Winooski the step-down sequence includes the T7 margin. The position of the T7 margin in this portion of the basin is very similar and close to the T6 position as shown on the preceding regional map. Thus, the trace of the T6 margin gives a sense of the T 7 position.
T7 time marked the progressive northward opening of the “narrow open water corridor” at the Fort Ann level through time along the base of the foothills, extending to and beyond the Quebec border, where it is termed “Lake Candona.” As noted, this includes, for example, the Ice Tongue Grooves at the mouth of the Lamoille, perhaps the Shattuck Mountain Pothole tract, and tributary basins on the south side of the Missisquoi Basin, such as the Black River basin, a long southward reaching tributary which includes evidence of calving, and other tributary basins as discussed for Locales CV 1 to CV4.
Specific, detailed information about the T7 margin and time north of the Winooski Basin is also presented for Locales, including Locale CV7 in the Colchester and Essex areas, Locale L6 in the Lamoille Basin, Locale CV4 near Bakersfield, Locale CV6 at the mouth of the Missisquoi Basin. and Locale CV5 near Berkshire, also in the Missisquoi Basin.
In contrast, evidence for Fort Ann is generally absent on the north side of the Missisquoi Basin which may have remained ice covered as part of the long, narrow convex lobe in the Champlain Basin, again as discussed above. Alternatively and more likely, the T8 readvance eroded or buried features associated with Fort Ann Lake Vermont. Whereas the eastern ice margin likely became destabilized in T7 time, in general the evidence suggests that calving did not take place in the Fort Ann “corridor” except in the Black River Basin, which had a more favorable position for deeper water needed for calving, and as well an orientation more conducive to ice streaming for the calving ice margin.
The map below is a screenshot from the VCGI Project Sheet of the LaPlatte Basin, one of the re-entrant basins identified in the Middlebury Bench.
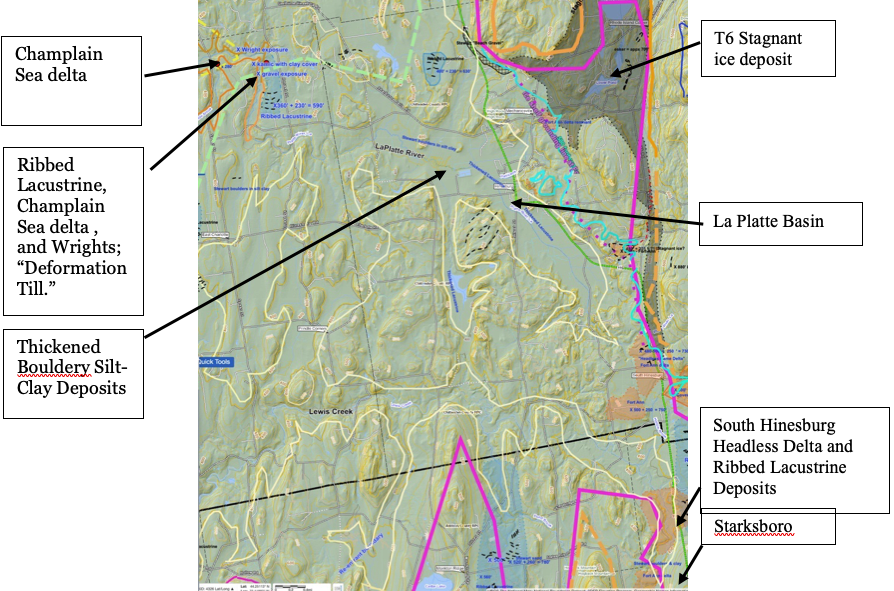
As discussed at length above, late T6 and T7 times involved complex ice margin spatial and temporal relationships associated with the lowering of Lake Vermont from Coveville to Fort Ann times and the opening of the Winooski Basin. This history is not repeated in all details here, but in general:
- The thin yellow line on the above map marks the present day 400 foot(122 m) contour which helps to visualize the physiographic configuration of this Basin. The bright, neon blue line along the north side of the Basin traces the approximate 500 foot(152 m)contour which in this area is close to the Fort Ann level and is associated with the calving ice margin features. The floor of the basin is remarkably flat, owing to a thick fill of bouldery lacustrine silt and clay soil, again interpreted as deposited my meltwaters from the ice stream and as well from the drainage of ice in the stagnant ice deposit to the north (gray colored area), and drainage associated with leakage of Lake Mansfield.
- The ice sheet occupied the LaPlatte Basin as an ice stream extending up the LaPlatte Basin in late T6 time, with its lobe tip near the head of the Basin in the Starksboro area at a stagnant ice margin associated with the development of the major delta at the Coveville level at Bristol.
- The lowering from the Coveville level is marked by Headless Delta and Ribbed Lacustrine deposits in the South Hinesburg area, with continued recession of the LaPlatte ice stream marked by calving ice margin features in T7 time, extending down the LaPlatte to the T8 margin position. The T7-T8 transition is marked by a Ribbed Lacustrine deposit associated with the lowering from the Fort Ann to Champlain Sea levels, essentially at the end of T7 time along the T8 margin.
- In late T6 and T7 time a lobe of the ice sheet extended into the Winooski Basin, with an active ice margin impounding Lake Mansfield, with an active ice margin also marked by Bedrock Grooves in the foothills along the western flank of the mountains, one of which at Gillett Pond served as the outlet spillway control for Lake Mansfield 1, leading to the major delta at South Hinesburg, also at the Coveville level. This was a hybrid margin, with its stagnant component marked by a major stagnant ice deposit. These features are off the above map, but presented previously.
- The south side of the Winooski lobe was itself lobate with a sub-lobe extending southward along the foothills south of Williston in the foothills, marked by a substantial stagnant ice deposit extending southward, forking around Oak Hill on the east side in the Allen Brook Basin, across the divide, into the LaPlatte Basin, and on the west side along the Muddy Brook and Sucker Brook Basins marked by ice proximal deltaic deposits at the Coveville and Fort Ann levels. A portion of this deposit is shown on the above map.
- In late T6 and T7 time recession of the ice margin was associated with the draining of Lake Mansfield and the progressive invasion briefly of Coveville waters and subsequently of Fort Ann waters into the Winooski basin as marked by stepdown Coveville and Fort Ann strandline features on the north flank of Oak Hill, drainage features beneath the active ice margin on the north flank of Yantz Hill, Ice Tongue Grooves on the northeast flank of Yantz Hill, and strandline features at the Coveville and Fort Ann levels, including a Ribbed Lacustrine deposit east of Yantz Hill within the Winooski Basin. These features are likewise off the above map but were presented previously.
- The recession of the calving ice margin in the LaPlatte Basin in T7 time, which was induced by the lowering of Lake Vermont from the Coveville to the Fort Ann levels, thus was accompanied by the opening of the Winooski Basin, with substantial sediment transport into the La Platte basin through the stagnant ice margin, including via an esker which is graded to the Fort Ann level in the LaPlatte Basin. T7 time in this Basin was associated with the progressive recession of calving ice margin, as marked by calving ice margin features, including Headless Deltas, and Ribbed Lacustrine deposits. (Numerous such sites are identified on the VCGI map, but only examples of these are labeled on the above map.)The Thickened Bouldery Deposits were deposited by heavy sediment laden drainage originating from the LaPlatte ice stream calving margin and drainage from the stagnant ice margin to the north, which included drainage originating from Lake Mansfield. Likewise multiple Headless Deltas and Ribbed Lacustrine deposits were formed along the Fort Ann level in the LaPlatte Basin as the calving ice margin in this basin receded northwestward. As previously noted these features do not actually mark the grounding line positions but are indicators of rapid recession of the calving margin in this basin.
- Another Ribbed Lacustrine deposit further down the LaPlatte Basin marks the transition from Fort Ann to Champlain Sea levels, near the Champlain Sea delta and Wright’s exposure of “Deformation Till”, as identified on the above map, marking the ice margin at the end of T7 time and the beginning of T8 time. The dashed green line is intended to mark the ice margin at the end of T7 time, and the yellow dashed line marks the T8 margin.
The evidence just described indicates that:
- The ice margin stood in the Starksboro and South Hinesburg areas in late T6 time, when Coveville lowered to Fort Ann, as marked by the aforementioned deposits, including as well the lowest level of the major Fort Ann delta at South Hinesburg;
- The ice margin then receded westward in T7 time from the Starksoboro and South Hinesburg areas , down the LaPlatte Basin as marked by Thickened Bouldery Silt-Clay deposits, marking a flat basin floor, to the T8 position, and thus was was diachronic;
- A Ribbed Lacustrine deposit marks when and where Fort Ann Lake Vermont lowered to the Champlain Sea level at the marine limit. This deposit became stranded and submerged, while ice was still buried in the deposit, so as to then become veneered by silt-clay, with continued melting giving the deposit its characteristic ribbed topography.
- In T8 time, which is marked by a deltaic deposit and significant evidence reported by Wright, which he interpreted as indicating a readvance but as discussed above alternatively may represent an oscillation of the calving ice margin along the LaPlatte Champlain Sea delta, but as well correlates with the readvance reported by Connally in the Bridport area, and with readvance evidence reported by Cannon (1964) and Wagner (1972) in the Missisquoi Basin;
- As well, the nearby deposit (at the LaBerge farm) along the LaPlatte which Stewart and MacClintock interpreted as stagnant ice is here interpreted as a kame delta at the Champlain Sea marine limit with evidence interpreted as an indication of the close presence of a nearby of ice margin.
Thus, ice margin recession in T7 time, per the map here, spanned the range between the head of the Basin near Starksboro at the T6 margin(maroon colored line), to the Ribbed Lacustrine deposit marked by the late T7 margin(sage colored line), followed by recession to the T8 position (dashed yellow line) at the marine limit(orange colored line) in the northwest corner of the map, based on the delineations given by Chapman, Wagner(1972) and Springston et al, with slight postglacial erosion altering the topography.
Another example of T7 time is further south in the southern sector of the Champlain Basin, just north of the nose of the Taconics, as depicted on the map below which is a screen shot from the VCGI map for the area approximately from Middlebury south to the Pittsford area:
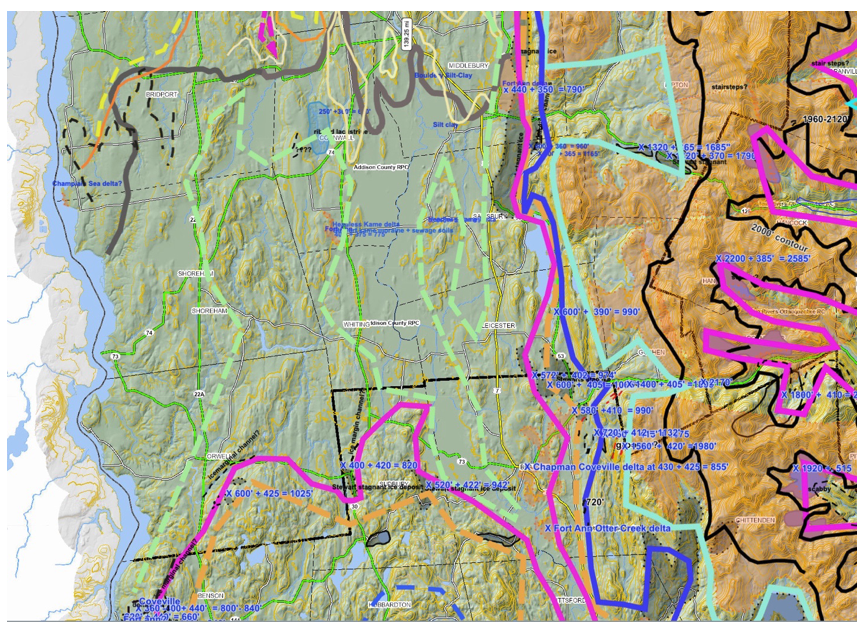
The T7 margin corresponds with the sage green dashed line on this map. As can be seen older ice margins include the T3(blue green), T4(blue). T5(orange), and T6 (maroon). The T8(yellow) margin is in the northwest corner of the map. These margins correspond with the Champlain lobe which extended southward into the mouth of the Vermont Valley, with the margin wrapping around the nose of the Taconics. Whereas the T3, T4, T5, and T6 ice margins are drawn based on ice margin features, with consideration given to Lake Vermont strandline positions, the T7 margin in this area was drawn so as to approximately correspond with the Fort Ann strandline, because the evidence indicates that by T7 time the ice margin was controlled or greatly influenced by this water body and level. The only T7 ice margin features are a kame(?) delta at the Fort Ann level near Benson landing, in the southwest corner of the map, a Ribbed Lacustrine deposit north of DeLong Hill, calving ice margin features at Delong Hill formed on the west side of the Otter Creek ice stream, and on the east side at West Salisbury. Further field study of this area is needed, including in the mouth of the Vermont Valley where the stepdown sequence of ice margins from the T4 to T7 levels is mapped.
The Stewart and MacClintock boundary marking the bouldery versus non-bouldery silt-clay deposits on their State map is marked by the heavy gray colored line on the above map. The DeLong Hill and West Salisbury features indicate calving beyond the S & M boundary, south of their line marking the boundary between bouldery versus non-bouldery lacustrine soils. The absence of boulders in the silt-clay soils below the Fort Ann level indicate that water depths may have been too shallow for calving, or alternatively and more likely that the bouldery soils are buried by late glacial and post-glacial deposition of non-bouldery soils. It is noted that the remarkably low, flat bottomed floor of Otter Creek is consistent with calving ice streams in the Middlebury Bench, corresponding with Salisbury and Leicester Swamp (well known and locally famous for its large and numerous mosquitoes which allegedly were once proposed as Vermont’s State bird!). Again, perhaps this terrain corresponds with thickened Silt and Clay deposits associated with calving, which are now buried by younger Otter Creek sediment.