This study did not begin with the intent or expectation of finding calving ice margins. Quite to the contrary, the initial approach and thinking was to identify ice margin features as conventionally recognized and thereby better understand the associated deglacial history. This led to the identification of a variety of ice margin features, including traditional types and as well some new types such as “Scabby Terrain” and others. Calving ice margin features were not immediately recognized, but came out of an increasing, progressively developing understanding about deglacial history and associated features, all of which were not initially well understood. The recognition and mapping of calving ice margins in Vermont is a relatively significant finding, such that the manner by which this understanding developed is pertinent and bears telling, as discussed in the following. Again, much of the following is similar to and duplicative of the discussion in the main body of this report associated with Ice Tongue Grooves and calving ice margins.
At a relatively early time, it became increasingly evident that recession of the ice sheet took place progressively, as repeatedly stated, much like “closely spaced rings in a slowly draining bathtub.” This observation led to the identification of a closely spaced, step-down sequence of ice margin features for the T4 to T7 levels in northern Vermont and the T4 to T6 levels in southern Vermont. Further, it became evident that the T4-T6 or T7 stepdown sequence was associated with the development of many local proglacial lakes, leading to, or giving way to, regional water bodies. For example, kame terraces and kame deltas in this sequence are quite common, to the point of being predictable and expectable. These show an intricate recessional pattern involving ice margin and proglacial lake features closely related to the local, highly irregular physiography, making clear not only that, as Chapman stated, the ice margins were continuously “bathed” in standing waters, but as well the ice and water were intimately inter-dependent as part of the Style and Glacial Dynamic associated with ice margin recession in a reverse gradient environment. In the southern and central Champlain Basin these step-down ice margin and local proglacial water body deposits give way to Coveville level and subsequently Fort Ann Lake Vermont deposits, and then to Champlain Sea features in close association with ice margin deposits at the T6, T7, and T8 levels, respectively. Many Coveville and Fort Ann deltaic deposits are mapped as ice contact kame deltas on VCGI, as marked by features evident on LiDAR.
The ice margin features at the T6 level and time in central and southern Vermont, for example in the Rutland area, around the nose of the Taconic upland, and along the western flank of the Taconics, which are intimately associated with Coveville level kame deltas, suggest that Coveville waters were confined by the ice margin in close proximity. Again, this is consistent with Chapman’s observation that the receding ice margin was constantly “bathed” in standing water. This led to the concept that Coveville Lake Vermont in early T6 time initially occupied a narrow corridor between the terrain along the foothills and the ice margin. For example, in the Proctor area, just north of Rutland, T5 ice margin features were found and mapped in many locations at elevations just above the Coveville Lake Vermont level. Similarly, nearby ice margin features at the lower, T6 level likewise were found and mapped in close association with strandline features at the Coveville Lake Vermont level. This “corridor” concept is also part of the “Paradigm Trap” issues discussed above.
Further, the same type of step-down sequence, expanding to include T7 and T8, was mapped northward along the foothills, all the way to the Quebec border, suggesting the progressive northward recession of the standing water corridor along the eastern margin of the Champlain lobe. However, the northernmost extent of Coveville deposits is in the Bristol and South Hinesburg vicinities where major deltas at the Coveville level were identified. Coveville waters apparently entered the Winooski Basin, shortly before Lake Vermont lowered to the Fort Ann level.
North of South Hinesburg the T4-T6 step-down sequence is in close association with local proglacial lakes giving way to Fort Ann features in the Winooski Basin, which then extend northward to the Quebec border at the T7 level, and as well include the T8 margin associated with Champlain Sea features in the Missisquoi Basin.
Obviously, the development of an understanding that the Champlain lobe was fronted by standing water of Lake Vermont is not new and does not by itself establish that the ice margin was calving. But the recognition of features which indicate a close association of the ice margin with Lake Vermont in a narrow corridor served as a clue about the intimate association of the receding ice margin and proglacial water bodies.
The Bristol delta is a major, large and thick Gilbert-type deltaic deposit at the Coveville level, on which the Village of Bristol is located, as shown on the above map. Stewart and MacClintock(and Calkin who was their assistant who mapped the Middlebury area) interpreted the Bristol deposit as a kame terrace based on the abundance of large boulders. Their reports show photographs from a large pit excavation in this deposit which no longer exists. These photos clearly show classic topset/foreset deltaic beds which make up the entirety of the deposit, but with interspersed boulders, many of which are very large. It is here believed that the boulders were ice rafted from the nearby ice margin to the west which is indicative of calving. Even this tidbit of information proved to be one of many such clues that fit with the calving ice margin story.
The following is a VCGI screen shot map of the Bristol and Starksboro areas, including portions of the Little Otter Creek and New Haven River Basins:
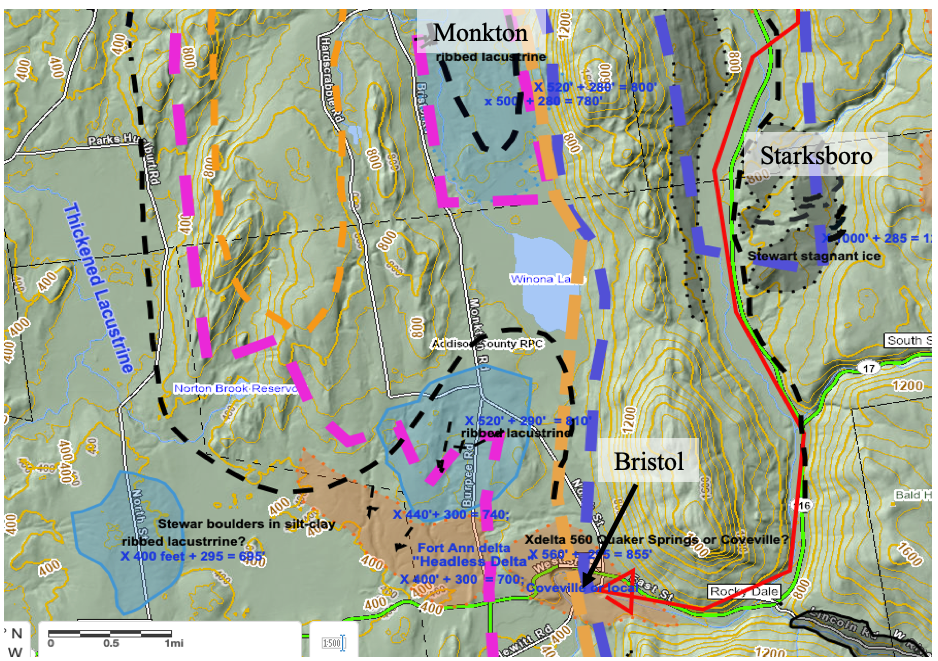
As previously indicated, VCGI mapping led to the recognition that the Bristol delta was constructed predominantly by outwash originating from a stagnant ice complex in the Starksboro area, representing an ice margin that was part of the step-down T4-T6 sequence. The dashed blue, orange, and maroon lines represent the T4, T5, and T6 ice margins. The Starksboro margin marks the T4-T6 ice margin lobe that occupied the LaPlatte Basin(north of the map area). The above map shows only the southern tip of the T4 margin of this lobe, as marked by stagnant ice deposits(gray shaded areas). This La Platte Basin lobe was a sub-lobe of the Champlain lobe, which shortly later developed as an ice stream with a calving margin in the LaPlatte re-entrant basin. An outwash plain is identified on VCGI extending southward on the floor of Baldwin and Beaver Creek valley from the T4-T6 stagnant ice margin in the Starksboro area, which appears to be graded to the Bristol Coveville delta. This outwash plain is not mapped as such on the above map, but is designated by a red arrow signifying a Drainage Line.
Immediately west of the village of Bristol are a variety of deposits, at slightly lower elevations in the Little Otter Creek and New Haven River basins. These include sprawling, shoaling type delta deposits at the Fort Ann level. Whereas the central portion of this deposit narrows into the New Haven/ Baldwin drainage basin at Bristol, as a conventional or typical delta, portions of this deposit occur along the Little Otter Creek and New Haven basin floor side margins, with LiDAR imagery showing patterns suggestive of the formation of these portions by drainage from stagnant ice deposits fringing the basin floor at the T6 level, some of which are Ribbed Lacustrine deposits. This was another clue, in this case suggesting that buried ice remaining in these deposits, likely contributed to meltwater leading to the formation of these “Headless” deltaic deposits, stagnant ice masses being left behind when Lake Vermont lowered to the Fort Ann level.
A further clue was nearby to the north in the Monkton area, where in the late 1960s and early 1970s, a peculiar deposit with strong hummocky, stagnant ice type topography was recognized by Wagner’s mapping, but perplexingly the deposit was in an area with substantial lacustrine silt and clay soils at the surface. This corresponds with Van Hoesin’s “distinctive topography,” as discussed above. Again, LiDAR imagery further confirmed this as a deposit having the topographic expression of a stagnant ice deposit, with a ribbed pattern. Such “Ribbed Lacustrine” deposits back then were not understood. They are here recognized as stagnant ice deposits of sand and gravel which became overlain by lacustrine soils, with melting ice remaining in the deposit when the active ice margin receded so as to allow ponded water invasion to give the lacustrine sediment cover. Such deposits are mapped in close association with “Headless Deltas.” The above map shows the “Headless Delta” immediately west of Bristol, with several of the drainage lines marked as arrows indicating drainage from the north. Some of this drainage originated from the “Ribbed Lacustrine” deposit, one of several in the Monkton lowland, at the T6 level, slightly above but close to the Fort Ann level.
This type of evidence, showing drainage from remnant stagnant ice at the T6 and Coveville level downward to deltaic deposits at the Fort Ann level, and in turn evidence of ice presence in Fort Ann time, is a critical part of the evidence leading to the concept of calving.
Immediately to the west, on the floor of the Little Otter Creek Basin, is a remarkably flat, basin -like area underlain by lacustrine deposits. Such basins are believed to be substantially thick lacustrine deposits formed in Lake Fort Ann along the receding and calving ice margin of an ice stream in the Little Otter Creek and New Haven re-entrant. The State Surficial Geology map shows these as “bouldery silt-clay.” Many such unusually flat basins are found in the Middlebury Bench area. These suggest that the basins were formed by fine-grained sediment deposition in standing proglacial lake water with a nearby source of exceptionally heavy sediment load, such as a calving ice margin associated with ice streams. And the identification of these as “boulder” is again another clue. Parker Calkin in his report on the Middlebury area wrestled with this evidence, concluding this showed calving.
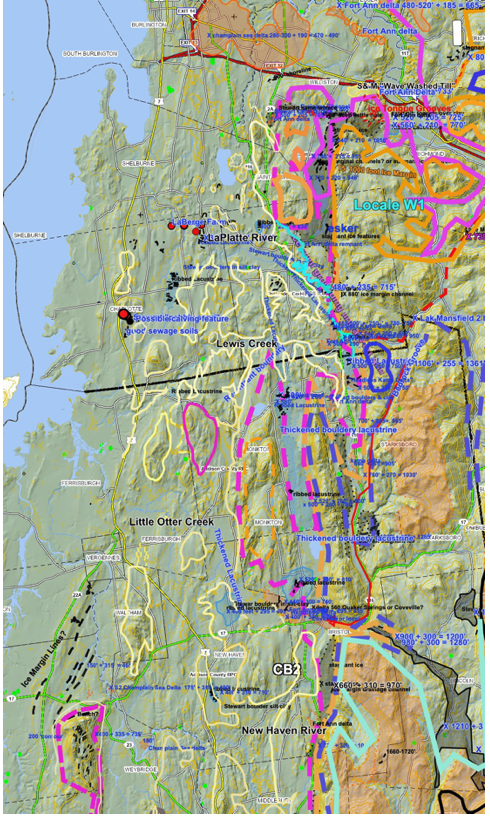
Just to the north, in the LaPlatte Basin, is a similar pattern, as depicted on the map below:
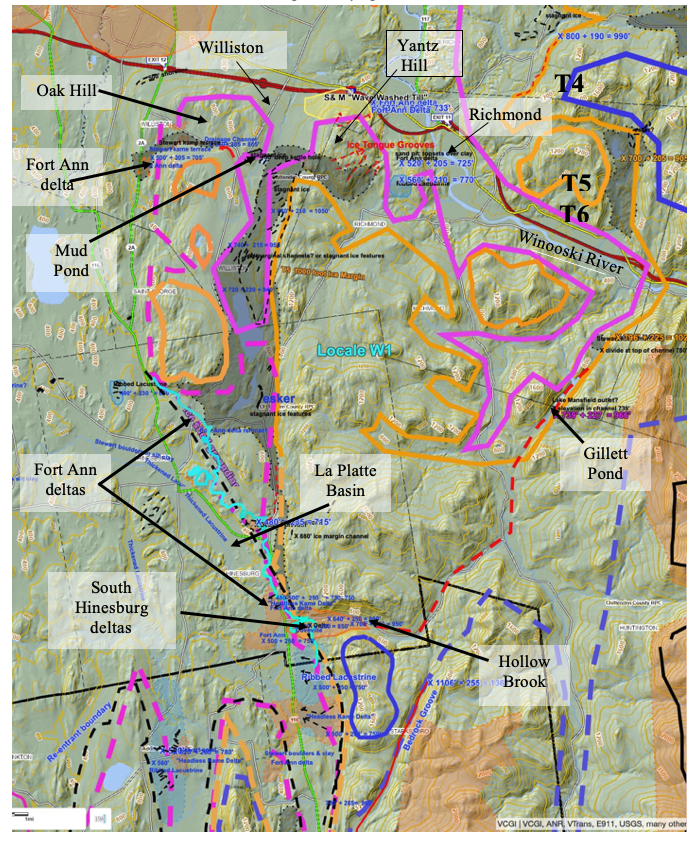
The northern margin of this map is along the Winooski River area, mostly in the foothills near the mountain front, in the vicinity of the villages of Williston and Richmond. Hinesburg is located in the south-central portion of the map, at the base of the foothills. Again, the blue, orange, and maroon colored lines mark the T4, T5, and T6 step-down margins, which represent the ice sub-lobe that occupied the LaPlatte and Winooski Basins. The southern tip of the T4-T6 LaPlatte lobe in the Starksboro area as discussed in the immediately preceding is just to the south of South Hinesburg. At the time when this map was originally produced it was still believed that the T7 margin was restricted to the north in the Essex and Colchester areas and further northward. It was subsequently realized that the T7 and T8 margins extend further south. Because the making of such maps by transposing from VCGI is so tedious, the above map has not been updated, but the difference does not conflict with the telling of the development of calving ice margin thinking.
A major deltaic feature at South Hinesburg represents four water levels, the upper two having formed in local lakes, the third a Gilbert-type delta at the Coveville level, and the fourth and lowest, on the west side of Route 116, is a shoaling type delta at the Fort Ann level. 1 In the 1970s, mining excavations showed over 100 feet of top-set and forest deltaic stratification in the Coveville level. Revisits in 2024 showed this level has been mostly excavated and removed by mining operations but major exposures in the upper two levels, show well over 100 feet of classic topset/forest prograding stratification, overlying glacial till, with no evidence of stagnant ice presence or bottom set beds in the deposit.As discussed in more detail below, the Coveville delta is linked to a late T6 margin and associated drainage from Lake Mansfield in the uplands to the east, as mapped by Wright and others 2 Wright et al identify an earlier Lake Mansfield I level controlled by drainage at Gillett Pond and a later Lake Mansfield II level controlled by a divide with Hollow Brook(as shown on the map).As recognized by Stewart and MacClintock, Wagner, and most recently by Wright et al, this deposit and its linkage to a water body in the interior uplands(Lake Mansfield) requires an ice margin extending across the Winooski Basin so as to serve as a dam for Lake Mansfield. The T5 and T6 ice margins as mapped in the Winooski Basin suggest that the ice dam was relatively narrow and thinning in T5-T6 time, about 6 miles wide in T5 time, and much thinner or narrower in T6 time – as discussed above in connection with Ice Tongue Grooves.
A late T6 stagnant ice deposit south of Williston, when the ice dam was quite thin and leaking(as discussed above and further below) shows evidence indicating major drainage southward into the LaPlatte lowland reentrant, grading into deltaic deposits corresponding with Lake Fort Ann. This drainage is specifically examined in more detail in Appendix 3 at Locale W1. Much of the following discussion has as well been previously discussed in regard to Ice Tongue Grooves, but is repeated here as it bears as well on calving ice margins.
The Williston stagnant ice deposit is a very substantial and significant feature at the T6 level(gray shaded feature on the above map), which is believed to have formed along an ice lobe which extended into the Winooski Basin as part of the Lake Mansfield ice dam. This deposit shows significant topographic features which are enhanced by LiDAR imagery. These are suggestive of progressive recession of the ice margin within T6 time, or alternatively perhaps crevasse patterns across a range of elevations reflective of the sloping underlying terrain. LiDAR imagery also helps to identify an esker in the southern portion of the deposit indicating southerly drainage toward and into the LaPlatte Basin, graded with deltaic deposits on the marginal fringe of the LaPlatte basin at the Fort Ann level.
In general, it is believed that this deposit represents the stagnant ice margin of the sub-lobe that extended into the Winooski Basin as part of the ice dam for Lake Mansfield. Close by at Yantz Hill are Ice Tongue Grooves(red colored arrows) and Stewart and MacClintock’s “Wave Washed Till”(yellow colored shading). These are believed to represent: a) the receding active ice margin, the Grooves representing the destabilization of the ice margin in T4-T6 time and the opening of the Winooski Basin in T7 time, and b) the Wave Washed Till here interpreted as representing subglacial drainage of Lake Mansfield waters beneath the active ice margin into the main Basin over a range of time, including drainage into and through the Williston stagnant ice deposit feature southward to the LaPlatte re-entrant where such deposits led to the thick deposits of bouldery lacustrine soils with flat geomorphic floors.Notice that this discussion involves both active and stagnant ice margins. These are indicative of hybrid margins and the Style referred to as “Everything, Everywhere, All at Once, and Continuing.”
Nearby, the northwestern, lower portion of this stagnant ice deposit is marked by stagnant ice features in the Oak Hill area. This is a complex area, with substantial and diverse evidence, some of which is inconclusive, conflicting, or somewhat contradictory, as given and reported by Stewart and MacClintock’s State map, SCS soil sewage favorability mapping on VCGI, Wagner’s mapping in the early 1970s, a surficial geologic map by Springston and DeSimone, 3 Springston, G. and DeSimone, D., 2007, Surficial Geologic Map of the Town of Williston, Vermont; Vermont Geologic Survey Open File Report VG07-5.and present Wagner VCGI interpretations(this report).
Without going into all of these details, suffice it to say that this Oak Hill area is here interpreted as representing a stagnant ice margin formed in late T6 time into T7 time, with the following:
- The stagnant ice margin extending into the Allen Brook lowland is marked by stagnant ice deposits near a kettle hole locally known as Mud Pond. This depression was probed by Wagner in the early 1970s and found to be about 50 feet(15 m) deep, and filled with peat. A sample of the peat from the base of the depression was C-14 dated, but gave an age which is too young, likely indicating cross contamination from the sampling. This depression is interpreted as indicating a kettle hole formed by a stagnant ice block at the at T6 level and time, as part of the more substantial stagnant ice feature to the southeast.
- West of the kettle hole is another small kamic stagnant ice deposit, which represents the same ice margin.
- Together these features mark the margin of a sub-sub lobe of the T6 ice margin extending southward into the Sucker Brook Basin, as part of the Winooski basin sub-lobe of the Champlain lobe
- The kettle hole and associated margin lies at the head of a very distinct, clearly developed and marked spillway-like drainage channel, with a distinctive topographic form especially evident on LiDAR, and with a pavement of course cobbles. The slope of the channel is westward, and is interpreted as representing drainage from the ice margin across a low topographic divide, which resulted in the spillway-like form, along modern day Sucker Brook.
- This spillway is believed to be part of the leakage from Lake Mansfield II in the Winooski Basin, and thus helps to account for the lack of a spillway associated with the Hollow Brook drainage related to the South Hinesburg Fort Ann delta. In other words, this spillway represents the bulk of the drainage from the Winooski Basin, thus accounting for its prominence, just prior to the water level in the Winooski Basin equilibrating at the Coveville level.
- The spillway extends westward and grades into indistinctive topography which Stewart and MacClintock mapped as indicative of stagnant ice. Examination of this area many times, including most recently in 2025, finds that the terrain is slightly undulatory but that the case for a stagnant ice margin, meaning west of the spillway channel, is uncertain.
- Regarding the downgradient drainage from the “spillway” channel, as best as can be determined, this drainage extends southwesterly to two deposits, an upper level deltaic deposit at the Coveville level and a lower small deposit interpreted on VCGI as deltaic at the Fort Ann level. Stewart and MacClintock mapped a much larger deposit of “pebbly sand” in the vicinity of this lower deposit area but SCS soil sewage favorability maps indicate that this deposit is not uniform with portions not being sandy. It is possible that portions of this larger deposit likewise represent deposition of sandy material as part of the Fort Ann delta.
- Springston and DeSimone map mapped the “spillway” channel as associated with “Quaternary Outwash,” which is described as:
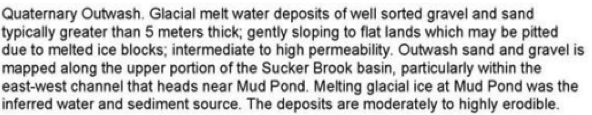
- Springston and DeSimone’s map also indicates that the “spillway” drainage feature extends southwesterly in a downgradient direction along Sucker Brook to a deposit mapped as “Quaternary Inwash.”

As noted above, this description and interpretation fits and comports with the interpretation given here, and indicate that the coveville and Fort Ann deltaic deposit formed in close association with the ice margin. This description is here interpreted as a kame delta representing the early development of the narrow standing water Fort Ann corridor which progressed northward along the foothills in T7 time.
Springston and DeSimone’s map further provides a description of till deposits along Sucker Brook, basically immediately south of as follows:
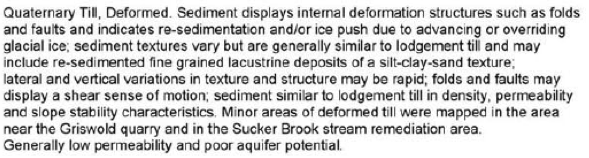
This description comports with features identified by others, specifically Calkin and Wright et al in the Middlebury Bench area which are here interpreted as being associated with calving ice margin oscillations. Whether or not the ice margin at this location was calving is uncertain, but seems likely.
The following is a screen shot from a current VCGI map showing the features and T6-T8 ice margins in this area:
In general, taken together, it is believed that: a) The recession of the T4-T6 Winooski sub-lobe active ice margin led to destabilization as marked by the Ice Tongue Grooves on the northeast flank of Yantz Hill; b) drainage beneath this active ice margin from the non-catastrophic leakage of Lake Mansfield as marked by Stewart and MacClintock’s “wave washed till” on the north flank of Yantz Hill; c) drainage waters which issued from a tunnel along the calving ice margin at Mud Pond; which caused the incision of the spillway type channel at the low divide between Mud and Sucker Brooks, perhaps associated with a small, local proglacial water body along the ice margin; d) drainage extending downgradient, essentially as mapped by Springston and DeSimone, and interpreted here as including a Coveville and Fort Ann kame deltas, formed along and associated with the opening of the narrow, early T6 Coveville and Fort Ann corridors, associated with the opening of the Winooski Basin.
Additionally:
- A substantial “Ribbed Lacustrine” deposit occurs just south of the South Hinesburg Coveville delta. The owner of the property reported that the deposit consists of about 15 feet(4.6 m) of silt and clay overlying a thick deposit of sand and gravel. It is believed that this deposit formed in late T6 time, as part of the same T4-T6 step down sequence as at Bristol, and was a remnant stagnant ice deposit that became covered with lacustrine sediment during the time of transition from Coveville to Fort Ann.
- Just to the south of this feature are shoaling and “Headless Delta” sand and gravel deposits at the Fort Ann level, with LiDAR identified features indicating drainage from fringing stagnant ice deposits.
- Immediately to the northwest of the South Hinesburg delta is a conspicuously broad and flat LaPlatte basin floor, just below the Fort Ann level, which is underlain by bouldery lacustrine silts and clays. The geomorphic expression of this deposit suggests an unusually thick deposit on the LaPlatte Basin floor. Large thicknesses of such deposits in some places in the area were confirmed by previous studies, as referred to elsewhere in this report. As part of the VCGI mapping it was realized that this deposit corresponds with a unit identified by Stewart and MacClintock on their State surficial geology map as “bouldery,” which represents another clue. And nearby are multiple shoaling deltaic deposits at the Fort Ann level, portions of which seem to be “headless,” similar to features just described for features in the New Haven River basin near Bristol. These deposits are related to and graded with the aforementioned stagnant ice deposit south of Williston, including its esker.
The deposits and features just described relate to the recession of LaPlatte Basin and Winooski Basin sub-lobes, in a manner similar to the recessional ice margin history in the New Haven/Little Otter Creek basin ice stream sub-lobe, suggestive of the recession of calving ice margin ice streams in both the New Haven/Little Otter Creek and LaPlatte basins.
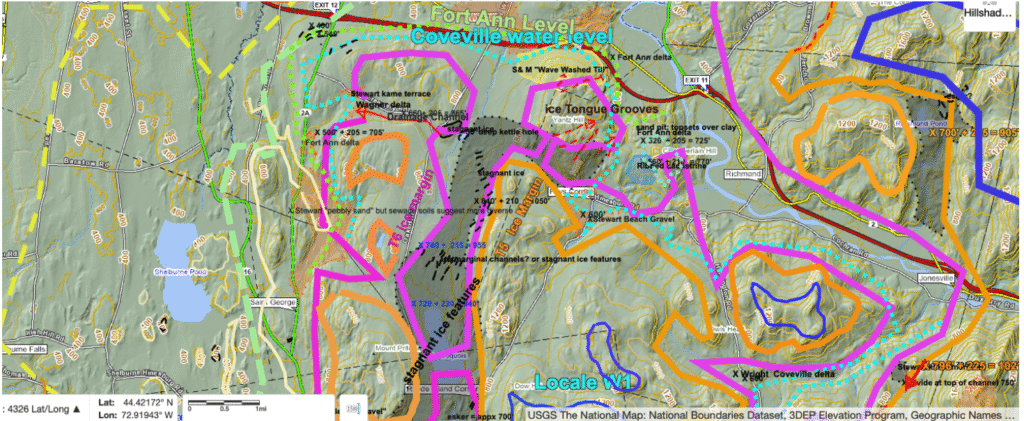
The following is a VCGI screen shot which illustrates the physiography and geologic features within the Middlebury Bench, including the Winooski Basin mouth, the LaPlatte Basin, the Little Otter Creek and New Haven basins, and the Middlebury area:
Again, this map was made prior to the recognition that the T7 and T8 margins extended southward along a long, convex ice lobe.
As a parenthetical note, the above map also shows the “Ice Marginal Lines” on the basin floor in the southwest corner of the map area. These are discussed in a section of the above report, but as discussed are believed to be an important part of the calving margin story. These lines became part of the evidence that compellingly led to the revision of the T7 and T8 margins.
Obviously this screen shot is cluttered with information making it difficult to read. Again, the T4, T5, and T6 ice margins are marked by the blue, orange, and maroon lines, respectively. The T6 margin is associated with Gillet Pond, and the LaPlatte and Little Otter Creek-New Haven ice sub-lobes which are associated South Hinesburg complex and the Bristol delta. The Winooski Basin is at the northern margin of the screen shot, with the Yantz Hill Ice Tongue Grooves marked as red arrows and “Wave Washed Till” feature marked in yellow.
The yellow lines have been added to trace the 400 foot(122 m) elevation contour lines which is close to the Fort Ann level(which does not precisely follow a topographic contour line owing to isostatic rebound, but is close to this level). As can be seen the yellow contour lines delineate drainage basins of the LaPlatte River, Lewis Creek, Little Otter Creek, New Haven River, Otter Creek, all within the Middlebury Bench, plus the Champlain Basin Trough area associated with the earlier phase of calving. Again, these are believed to have been occupied by ice streams associated with the calving margins in each sub-basin, though the evidence for a discrete ice stream in the Lewis Creek basin is unclear. Otter Creek, on the western part of the map, east of Snake Mountain, is not marked, but is believed to have been occupied by another ice stream. And to the west, west of Snake Mountain, is the low deep trough area west of the Middlebury Bench, which is believed to have been occupied by an early ice stream where an earlier phase of calving occurred.
The evidence suggests that each of the Middlebury Bench ice streams represented sub-lobes of the Champlain lobe, which fully occupied these basins at late T6 time when Lake Vermont lowered from the Coveville to the Fort Ann level and other possibly significant triggering events occurred. The evidence further suggests that as late T6 time progressed, recession of the calving margins took place in each of these basins along the frontal margins of each ice lobe, likely at correlative levels, though at this point more and better information exists with regard to the LaPlatte ice stream.
The following is an overview summary of the deglacial recessional history interpretation of these features:
- At T4-T6 time the LaPlatte sub-lobe tip stood at the substantial stagnant ice deposit near Starksboro, as related to the outwash plain linked to the Bristol Coveville delta. The ice rafted boulders in this deposit suggest that calving may have begun in Coveville time, but this is believed to have been minor and local.
- To account for the formation of the South Hinesburg and Bristol deltas, the latter associated with the ice margin at Starksboro, both at the Coveville level, it is suggested that the ice margin along the foothills between Bristol and South Hinesburg was highly crevassed to allow for the penetration of Coveville waters from the New Haven/Little Otter Creek basin into the LaPlatte Basin. This is consistent with and adds support to the concept that early Lake Coveville in early T6 time occupied a long narrow standing water corridor along the foothills.
- The South Hinesburg Coveville delta is linked to the drainage for Lake Mansfield, again a substantial water body in the upland interior of the Winooski and Lamoille Basins, following the drainage of the higher and larger Lake Winooski which drained across a divide into the Connecticut Basin. Again, these upland water bodies are mapped by Wright et al.
- In the foothills along the Green Mountain flank, generally east of South Hinesburg, is a series of Bedrock Grooves. As indicated previously these are interpreted as representing drainage along the margin of the active ice sheet, suggesting the progressive, generally northward recession of the active ice margin in T4-T6 time from higher toward lower levels. One of these Grooves is located at Gillett Pond, a long narrow trough which Wright interpreted as the outlet control for Lake Mansfield. As Wright suggested, further recession of the ice margin led to the opening of a lower level for Lake Mansfield, leading to his concept of an earlier Lake Mansfield I and a later slightly lower Lake Mansfield II. It is believed that both Lake Mansfield I and II related to the South Hinesburg Coveville delta, but the possibility that some of the Lake Mansfield drainage may have been related to a pre-Coveville higher and perhaps local proglacial lake in the uplands near South Hinesburg is not now established and requires further study.
- Another indication of the active ice margin is provided by the Ice Tongue Grooves at the northeast flank of Yantz Hill at the mouth of the Winooski Basin. As noted previously, these features are interpreted as indicating destabilization of the ice sheet, at least locally for the Winooski sublobe. Likewise, the “Wave Washed Till” deposit on the north flank of Yantz Hill is here interpreted as indicating subglacial drainage beneath the active ice margin, with drainage taking place in a southwesterly direction into the T6 stagnant ice deposit immediately south of Williston. As previously indicated, LiDAR imagery shows numerous features along the hillside above and within this deposit, including an esker, all of which are graded to Headless Deltas to the south in the LaPlatte Basin at the Fort Ann level. In essence, it is believed that in late T6 time, final drainage of Lake Mansfield II, basically by a non-catastrophic failure of the ice dam along an active ice margin, took place with drainage through an adjacent stagnant ice margin into Lake Fort Ann in the LaPlatte Basin, and that this was shortly followed by and associated with the development of Fort Ann deltaic deposits on the floor of the Winooski Basin, immediately at the base of and near Yantz Hill.
- The recession of the stagnant ice margin in T6 time continued northward to a slightly lower level, as related to the development of the stagnant ice margin at Oak Hill with its associated channel leading southwesterly to deltaic deposits also at the Fort Ann level, just prior to the incursion of Lake Fort Ann waters into the Winooski Basin.
- The identification of Headless Deltas, Ribbed Lacustrine deposits, and thickened bouldery lacustrine deposits in the New Haven/Little Otter Creek and LaPlatte Basins represent the development of a calving ice margins and progressive recession in these basins at this time.
- More generally, Ribbed Lacustrine, Headless Delta, and Thickened Bouldery Lacustrine deposits for the ice streams at the Fort Ann level, and other features as discussed below, are mapped on VCGI at diverse locations scattered around the Middlebury Bench, documenting what is believed to represent a broad, complex calving ice margin with irregularly shaped grounding lines related to the irregular Bench physiography, and with the floors of re-entrant basins which penetrate the Bench occupied by Champlain lobe ice streams. It is believed that the receding Champlain lobe developed a calving margin along a) the south-facing margin of the ice sheet near the south side of the Middlebury Bench, and b) along the eastern margins of the above described re-entrants whereby the narrow standing water corridor in Coveville time, became localized calving margins, which coalesced as recession progressed.
- Also more generally, the bouldery lacustrine and marine deposits and other features to the north of the Williston area, to the Quebec border, indicate that calving progressed northward and continued in T7 and T8 time. The T7 margin in the Colchester and Essex areas just north of Burlington is an example.
Thus, to summarize, the concept of a calving ice margin progressively emerged, with additional pieces of the puzzle falling into place, as outlined above. The re-entrant sub-basins, such as the LaPlatte and New Haven, were occupied by sub-lobes of the ice sheet where, when the water levels lowered from Coveville to Fort Ann, these sub-lobes served as ice streams associated with the formation of Headless Deltas, Ribbed Lacustrine deposits, and thickened and bouldery lacustrine deposits on re-entrant floors. This includes, fits with, and is supported by information previously reported by Stewart and MacClintock, Calkin, VanHoesen, Springston and Wright, and Springston and DeSimone, as discussed in the preceding. The evidence suggests and documents the calving ice margin recession in these sub-basins, from early T6 through late T6 to T7 time but as yet is insufficient to show correlative recessional positions in late T6 times between these basins.
As noted above, the idea that calving of the Champlain lobe ice margin took place is not new. However, VCGI and the mapping of ice margins helps to fit all these pieces together, showing the pattern and history of calving margin development and recession, including two phases of calving, their regional extent, evidence of destabilization, and the recognition that development of calving ice margins, once begun, likely led to the demise of the Champlain lobe.
As a final parting note on this discussion of how calving ice margin came to be recognized, I would add that one of the truly great pleasures in my return to glacial geology, if only briefly, is that the VCGI mapping and interpretation here served as reminder of how much fun it can be to explore and discover glacial history, in essence the basic process of hypothesis formulation and testing. The matter of calving ice margins is an example, as these certainly were not expected at the outset of this study. A further example of this, is that once the calving ice margins in the Middlebury Bench came more clearly into focus, the possibility of calving margins elsewhere was raised, as might be indicated by Ribbed Lacustrine, Headless Deltas, etc. This thought led to the Black Creek basin, a tributary of the Missisquoi Basin, which as discussed below, as it turns out, contains similar features. It is clear that the interpretations given here are the beginning and not the final word, that a better, more complete, and more correct understanding is yet to come with the benefit of further study.
This summary intentionally is cut short in that it does not include the evidence indicating that the lowering from the Fort Ann level to the Çhamplain Sea likewise was associated with renewed calving in T8 time.
Footnotes: