As stated above, whereas information regarding regional deglacial history, specifically meaning the changing positions of the receding ice margins, exists in neighboring area of New York, Quebec, and New Hampshire, a gap exists for Vermont. Filling this gap is important not just as an academic matter about deglacial history, but as well in terms of the modern concern for global warming. Information from these neighboring regions has been examined, leading to possible correlations.
The following is the same tabular summary of Vermont T times, levels, and ice margin positions as given above, which is here modified to show the suggested correlations, as discussed further below:
| Vermont Ice Margin Times and Levels | Elevations 1 Isostatically adjusted ice margin elevations using the Canadian border as the reference, with local elevations of features to the south of the border increased by an added amount determined by an isostatic slope of 5 feet per mile for the distance measured along a north south transect to the Canadian border. | Quebec positions (Parent et Occhietti et al) 2 ibid | Northeastern New York positions(Franzi et al) 3Franzi, D. A., Barclay, D.J., Kranitz, R., and Gilson, K., 2016, Quaternary glaciation of the Champlain Valley with specific examples from the Ausable River Valley; NYSGA, 29 p. | East central New York positions (De Simone and La Fleur) 4 De Simone, D.J. and La Fleur, R.G., 1985, Glacial geology and history of the northern Hudson Basin, New York and Vermont; NYGSA, pp 82-84. | New Hampshire (Thompson et al) 5 Thompson, W.B., et al., 2017, Deglaciation and late-glacial climate change in the White Mountains, New Hampshire, USA, Quaternary Research, V 87, pp 96-120. | Comments |
| T1 | 2700 – 3120 feet(823 – 951 m) | T1 and T2 times in Vermont are associated with Disconnections in the Lower and Middle Connecticut Basin in the Nunatak Phase, which generally precedes the ice sheet recession in Quebec. | ||||
| T2 | 2600 feet(793 m) | |||||
| T3 | 2000 feet(610 m) | Uncertain ice margin but older and higher than the Dixville moraine, and possibly the Frontier moraine | #2 | #1 | WMMS | The de Simone and La Fleur ice margin #1 position(red line on the markup of their map below) extends into Vermont and is reasonably close to the map position, elevation, and physiographic setting, as drawn in in Vermont on VCGI in this report. Further, the elevation of this margin at T3 time in Vermont, which is at 2000 feet adjusted elevation is reasonably close to the spot adjusted elevations shown for Franzi et al ice margin position #2. However, the correlation of Franzi et al’s #2 position is uncertain. As discussed in Appendix 3, the upper portion of the WMMS in New Hampshire is correlated with T3. |
| T4 | 1200-1400 feet(366- 427 m) | Dixville moraine | #7 | #12 | WMMS (Bethlehem Moraine Complex) | The de Simon and La Fleur ice margin #12 position(blue line on the above map) is reasonably close in map position, elevation, and physiographic position in Vermont as compared to the T4 margin as drawn on VCGI in this report. The elevation of this margin at T4 time in Vermont, which is at 1200-1400 feet(366 – 427m) adjusted elevation is likewise reasonably close to two of the spot adjusted elevations shown for Franzi et al ice margin position #7. This difference likely reflects the crudity of my method of spot elevation determination. Again this correlation is uncertain. Substantial VCGI evidence supports the correlation of the T4 margin with both the Bethlehem Moraine Complex and the Dixville moraine, as discussed below and in Appendix 3. |
| T5 and early T6 | 1000 -1100 feet(305-335 m) | Sutton moraine | #8, including Ellenberg Depot and Cadyville moraines | Not applicable | Not applicable | The spot adjusted elevation estimates for the Franzi et al position #8 at 850(259 m) and 900 feet(274 m) correspond with the T6 ice level in Vermont which is 800-1000 feet(243-305 m), but again this correlation requires further study. As noted above the adjusted crest elevation of the Ellenberg Depot moraine is about 954 feet(291 m), but Denny’s suggestion that the moraine rises about 200 feet(61 m), raises the possibility that this moraine may as will be in the T5 level. The Cadyville moraine again appears to be more like an Ice Marginal Channel type feature, ranging over a broad elevation range from 855 – 1105 feet(337 m), which spans the T5 and T6 elevations. |
| Late T6 and possibly early T7 | 800- 1000 feet(244 – 305 m) | Sutton moraine | Intermediate moraines | Not applicable | Not applicable | No spot elevation estimate was made for Franzi el al’s position 15. Instead, the apparent association of this ice margin position near Covey Hill is presumed to be associated with the lowering of Lake Iroquois to the Fort Ann level. It is possible that the opening of Covey Hill with drainage into Fort Ann occurred at a time when Fort Ann had already existed. However, it is suggested that the opening of Covey Hill which Franzi et al describe as rapid and catastrophic, fits with the interpretation in Vermont that the lowering of Lake Vermont from Coveville to Fort Ann levels was associated with Glacier Dynamic which was associated with the development of a calving ice margin in the physiographic bench area near Middlebury, which is suggested as taking place in late T6 time. This position of the Champlain lobe ice margin in late T6 time was near the south edge of the physiographic Bench and is regarded as more like a “Disaggregated “ type ice margin than a sharp narrow line type margin. Whereas the destabilizing event associated with the Coveville to Fort Ann transition was in late T6 time, the T7 margin that shortly followed thereafter with a well-defined flat margin is a convenient marker for correlating the Franzi et al #15 margin with the Vermont ice margin. The T6 margin is correlated with the Sutton moraine, but this requires further study. |
| T7 | 600 – 700 feet(183 -213 m) | Intermediate moraines | Not applicable | Not applicable | Not applicable | The T7 ice margin was diachronous, beginning with the lowering of Lake Vermont from Coveville to Fort Ann level in late T6 sand early T7 time associated with the calving ice margin in the Middlebury Bench area, followed by the opening of the Winooski Basin, the T7 ice margin position in the Colchester and Essex area, then the opening of the Lamoille Basin, and finally the progressive recession of the ice margin northward into Quebec with Fort Ann Lake Vermont occupying a long narrow corridor, leading to the opening for the incursion of the Champlain Sea. All but the early T7 margin likely postdate ice margin positions reported in New York by Franzi et al. |
| T8 | 500-600 feet(152 – 183 m) | Sutton moraine | Not applicable | Not applicable | Not applicable | As noted, the T8 margin appears to have formed after the Sutton moraine in Quebec, but requires further study |
All of these correlations are tentative and not definitely established. The correlation with New York is quite crude as compared with Quebec and New Hampshire. Their presentation is intended to give a sense of the possible configuration of the late glacial ice margins across the region, and thereby to encourage further research on this matter.
2. Quebec
As indicated above, the reported close relationship between the ice sheet margin and physiography in Quebec served as the inspiration for exploring the application of the “Bath Tub Model.” The correlation of ice margins between these two regions, as suggested by the above table, is relatively straightforward and can be summarized briefly.
Ice Marginal Channels at about 1400 feet(427 m) in the Memphremagog Basin, which are interpreted as the T4 time and active ice margin, can be widely traced across the basin to the Quebec border where they are correlated with the Dixville moraine in Quebec based on the elevation and alignment of these features with this moraine. The map presented previously above for T4 time shows the trace of the ice margin across the Memphremagog Basin into Quebec where it correlates with the Dixville moraine.As discussed below, the T3 margin in Vermont is correlated with the higher, earlier portion of the WMMS, which may correlate with the Frontier moraine in Quebec.
Likewise, an analysis of ice margin features In the Missisquoi Basin allows for the reconstruction of a very irregular ice margin at the T6 – T8 levels and times, with the T6 margin correlated with the Sutton moraine in Quebec. Again this correlation is depicted on the above T6 time map.
Thus, much of the Vermont deglacial history can be linked, again tentatively, with the deglacial history in Quebec. The closely spaced recessional ice margin features between T4 and T8 times in both the Memphremagog and Champlain Basins, suggest an incremental, progressive step-down recession for these same levels and times, which is likened to “rings on a slowly draining “Bath Tub.” These intermediate levels correspond with intermediate moraines identified in Quebec, but specific correlations with these intermediate times and margins has not been attempted. The suggested correlation of the T4 margin with the White Mountain Morainic System in New Hampshire and an associated readvance is intriguing. So far as is known, no evidence of such a readvance has been reported for the Dixville moraine in Quebec.
3. New York
Reported ice margin positions in NY, beginning with the older ice margin features and history in east-central New York from DeSimone and La Fleur followed by information to the north from Franzi, include the following:
1. DeSimone and La Fleur identify twelve ice margins in the area of the Hudson-Champlain divide, extending into southern Vermont, including the Vermont Valley, per their Figure 1 below:
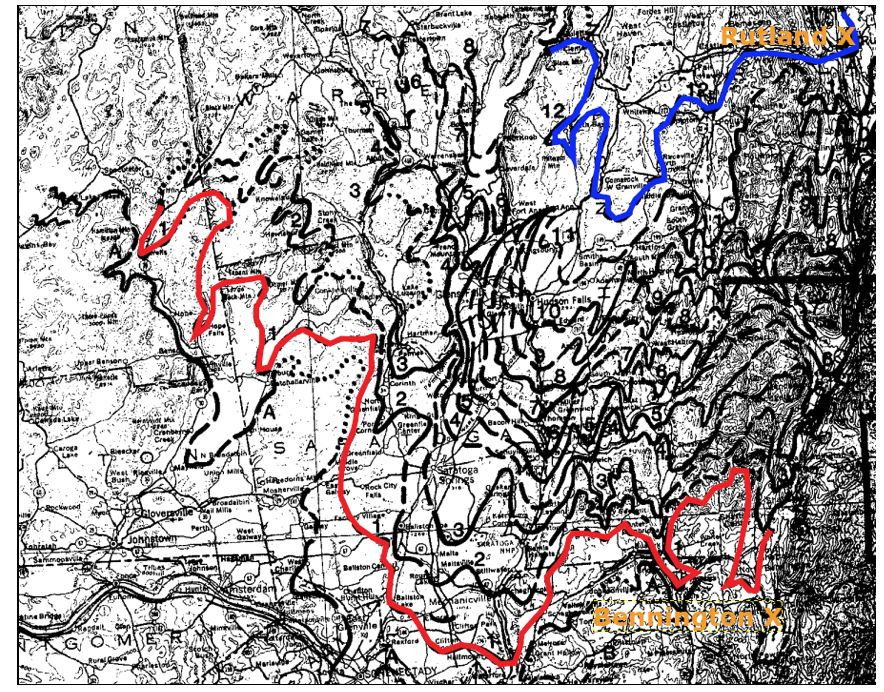
The details in Vermont are difficult to read owing to map scale compression. Positions 1 and 12 are highlighted here in red and blue, respectively, with Rutland and Bennington locations marked. As can be seen on their map, their position 1 shows a lobe of the ice sheet occupying the Vermont Valley in the Bennington area, followed by progressive northward recession in the Valley to position 12 in the Rutland area. This ice lobe is separated from the main Champlain Basin ice lobe by the Taconic Mountains with the ice sheet progressively younger positions receding northward at lower elevations around the nose of the Taconics. The delineation of T levels, times, and margins in Vermont was developed independently of any reference to information from neighboring regions, including the DeSimone and La Fleur margins, but the close association between the T3 and T4 ice margins with DeSimone and La Fleur 1 and 12 seems significant and bolsters the correlation.
The DeSimone and La Fleur margins show a remarkably close correspondence with physiography, reinforcing the viability of the Bath Tub Model and its usage here. The Vermont T3 and T4 ice margins correlative with DeSimone and La Fleur ice margins 1 and 12, respectively, as shown on the above map, suggest that the Champlain lobe was long and convex at these times, with margins located south of the regional drainage divide and likely pre-Coveville Lake Vermont time. The multiplicity of the ice margins as drawn by DeSimone and La Fleur suggest that the recession of the ice sheet was, like ice margin recession in Vermont generally progressive, incremental, and step-down in nature – like “multiple rings on a slowly draining bath tub.”
As discussed further below, the western margins of DeSimone and La Fleur ice margin positions 1 and 12 extend northward and may be correlated with Franzi et al’s positions 2 and 7, respectively, based on comparable elevations. However, obviously, this is speculative and uncertain and requires further study.
2. In the 1960s and 1970s Charles Denny mapped ice margins in northeastern New York in the northern Champlain Basin. Charlie and I were friends, and each visited with each other to review our progress. Whereas ice margins have since been more substantially delineated and defined by others, Denny’s Ellenburg Depot and Cadyville moraines are significant, and are both identified on Statewide maps presented previously above and included in the above tabular summary.
- The Ellenburg Depot moraine as described by Denny and evident on topographic maps is a distinctive topographic ridge with a crest elevation of about 950 feet(290 m) where it crosses the North Branch Great Chazy River. Denny indicates the elevation of the moraine crest rises to an elevation of 1100 feet (335 m). The distance from Ellenburg Depot to the Quebec border is about 6.7 miles (10.8 km), which gives an isostatic adjustment of 34 feet(10 m), suggesting the crest of the moraine is roughly at an adjusted elevation of about 984 feet(300 m), and possibly higher. This elevation correlates with the early T6 level and time in the Vermont chronology.
- The Cadyville moraine is identified as a moraine by Denny but on topographic maps is marked by features similar to features identified here on VCGI for Vermont as multiple Ice Marginal Channels. Denny does not specify the elevation for this feature but topographic maps suggest a wide elevation range of 750-1000 feet(229 – 305 m). Cadyville is about 21 miles(34 km) south of the Quebec border, giving an adjustment of 105 feet for a moraine elevation of about 855-1105 feet(261 – 337 m). This range spans the T5 and early T6 levels and times in the Vermont chronology, suggesting that the Cadyville moraine may overlap in time with the Ellenburg Depot moraine, with portions being slightly older. Again, this correlation by application of the Bath Tub Model is considered uncertain and hypothetical.
3. Van Hoesen, et al 6 Van Hoesen, J.G., 2016, A cartographic Ode to Chapman: A Revised Regional Depiction of Postglacial Landscape Evolution in the Champlain Valley. Geol Soc. America Poster Session. , present a map which shows the trace of three ice margins, marked by the gold colored lines on the Statewide map above. As can be seen on their map these ice margins are depicted as extending into Vermont suggestive of a flattened Champlain lobe margin. According to Franzi(personal communication), the extensions of these positions toward and into Vermont is uncertain and reflects the belief that the ice margin likely was calving. The issue of calving which relates to the configuration of the frontal tip of the Champlain lobe, whether long and convex or substantially flattened in shape is discussed below. The VCGI evidence presented here suggests a different paradigm-ic thinking, first in that ice margins were not like simple lines on a map, and second that the VanHoesen et al map reflects a mental model involving the flattening of the ice margins as they extend across the basin. As discussed above with regard to paradigm “Traps” this thinking is based on a south to north recessional flattened ice margin mental model, in contrast to a more lobate shape with both south to north and east to west ice margin recession.
4. Franzi, D. A., et al, 7 Franzi, D. A., et al., 2015, Quaternary deglaciation of the Champlain Valley with specific examples from the Ausable River Valley; NY State Geological Assn Guidebook;29 p. provide ice margin positions in northeastern New York, per their Figure 3, which shows multiple ice margin position:
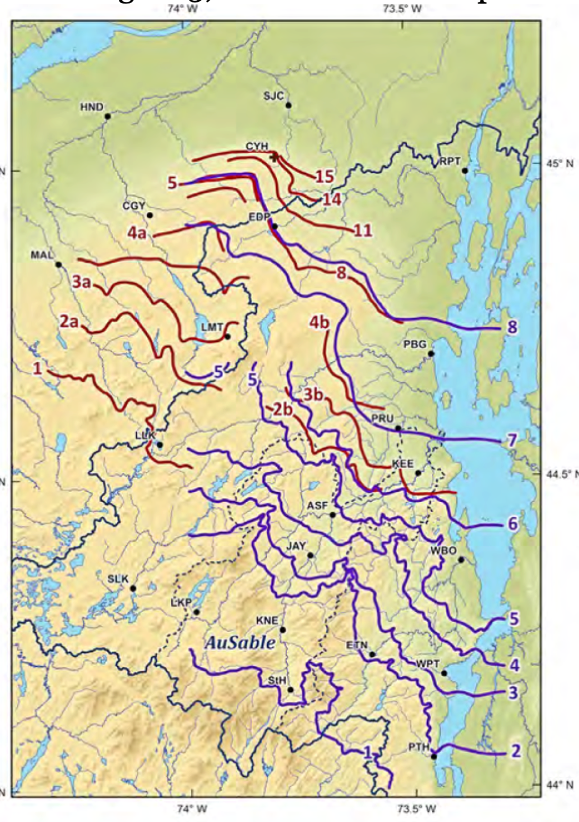
The red line ice margins are taken from Denny and the blue lines from Franzi et al. This map shows numerous ice margin positions. Franzi et al do not provide specific details about these ice margins, but these are believed to represent the correlation of scattered ice margin features across large areas of the State. Rather than attempt to explore the correlation of all of these margins with the Vermont deglacial chronology, Franzi’s ice margin positions 2,7, and 8, and ice margin position 15 from Denny, taken from their Figure 3, were selected as likely spanning the Vermont deglacial history elevation and time range, as discussed in the following.
Franzi et al’s Figure 3 gives a sense of physiography, showing generally northward receding ice margins suggesting a general, rough correlation with physiography, in the sense that a) the ice margin positions suggest lobes of the ice sheet which penetrated further southwestward in lower topographic areas, and b) the successive northward and younger ice margins tend to be at progressively lower elevations.
To get a better sense of the elevations of these ice margins, positions #2, #7, #8, and #15 were superimposed on the topographic map below. Selected locations on each of these ice margins were crudely used to obtain local spot elevations from the topographic map as shown by the blue colored elevations numbers.

These elevations generally show lower northward elevations but considerable variability which may reflect either actual variability or the crudeness by which local elevations were estimated. As discussed in the above tabulation, these elevations were used to correlate these selected Franzi et al ice margin positions with the Vermont chronology, as a possible, hypothetical correlation.
As indicated above, Franzi’ ice margin position #8 is correlated with the T5-early T6 margin. As stated in the deglacial history section, the T4, & 5, and T6 ice margins in Vermont indicate that the Champlain lobe extended southward, with the margin bifurcating around the nose of the Taconics, with one sub-lobe extending to the Proctor area(just north of Rutland) and the other sub-lobe extending southward on the floor of the basin to and perhaps beyond the Benson Landing vicinity. The T4-T5-T6 margins were part of the step-down sequence, with the early T6 level marked in places by stagnant ice deposits but commonly by deltaic deposits at the Coveville level. Thus, the early T6 ice margin was fronted by Coveville Lake Vermont.
In general, Coveville Lake Vermont in the vicinity of Proctor and along the foothills of the Taconic upland was relatively shallow. For example, in the Proctor area the level of Coveville was at an elevation of about 440 feet(134 m), as compared to the lake floor in that area which was at an elevation of about 400 feet(122 m). In general, deltas formed in Lake Coveville in this portion of the Champlain Basin tended to be shoaling deltas associated with broad, shallow waters. Thus, it is unlikely that conditions in in this area at the T6 ice margin were favorable for calving ice.
The Champlain Basin floor is not flat. To the west of the Middlebury Bench the Basin floor is much lower, with the physiographic “trough.” However, physiographic maps do not take into account the bathymetry of present day Lake Champlain. Bathymetric maps for Lake Champlain, as for example shown by one of the VCGI tabs and as well by research reports from Middlebury College studies, show that the trough on the floor of the Basin is marked by a quite pronounced thalweg of what locals refer to as the “deep lake,” which extends northward from the Ticonderoga area to a bench-like rise corresponding approximately with the Champlain Islands(specifically the Vermont Towns of North and South Hero, Grand Isle, and Isle La Motte). This physiographic difference in the Champlain Basin was significant in two somewhat contradictory and still puzzling ways. First, evidence exists suggesting that in T7 and T8 times the Champlain lobe extended far to the south, perhaps as may have been facilitated by the lower elevations of the westernmost and lowest portion of the basin floor. On the other hand, this portion of the basin floor, being lower, meant that the proglacial Lake Vermont along the south facing frontal margin was relatively deep, which favored a calving frontal margin. As discussed in the above report above for calving ice margins, it is believed that the trough and “Deep Lake” promoted a long, convex ice lobe projection, but with calving ice margin portions of this deeper basin area in early T6 time.
Accordingly, the trace of the ice margin is drawn on the Statewide map by a red colored dashed line as extending from the T6 margin at the base of the Taconic foothills northward so as to connect with Franzi’s position 8, with a flat margin associated with the inferred calving ice margin, with a grounding line inferred to be in the vicinity of the Champlain Islands. Of course, again, this margin is drawn schematically in as much as the exact position of this trace is unknown.
The best evidence for correlating ice margins extending across the Champlain Basin between Vermont and New York is when Lake Vermont lowered from the Coveville to Fort Ann levels. In New York, this time is approximately marked by Franzi et al’s ice margin position 15 near Covey Hill, associated with the breakout of Lake Iroquois to Fort Ann. In Vermont, this time is marked by the grounding line for a calving ice margin that developed in late T6 time and stood along the south side of the physiographic Middlebury Bench and the heads of the re-entrant basins within the Bench. The ice margin showing a possible connection between Franzi et al’s position 15 and the late T6 margin is drawn along the southern edge of the physiographic bench near Middlebury where, as discussed elsewhere, the evidence indicates a grounding line for a calving ice margin. This grounding line is traced northward along the western edge of the physiographic shelf to the St Albans vicinity where the margin turns westward to connect with Franzi et al’s position 15.
The Vermont T7 margin in the Colchester and Essex area is documented by ice margin features on the floor of the basin, At an early time these features were believed to mark the southernmost position of the ice margin in T7 time, consistent with a flat shaped calving ice lobe, with a calving marin thence extending westward across the basin. However, as discussed above the T7 margin is now traced southward, suggestive of a longer, convex ice lobe.
Finally, The Vermont T8 margin in Champlain Sea time likewise is now interpreted to project southward in the Basin as a long convex lobe, the western margin of which is younger than any of the Franzi et al Figure 3 margins.
To depart from the matter of ice margin correlation, it is noted here, as also discussed above, that Franzi et al similarly recognize the complex dynamics between the ice sheet and its setting, with major new concepts about this history and the interplay between the ice sheet and proglacial water bodies. More specifically, Franzi et al:
- Introduce a major revision of the deglacial history of proglacial water bodies, indicating that as the ice margin receded it opened an outlet major proglacial water body in the Ontario basin, to “catastrophically” lower and drain into the Champlain lowland where it merged with Fort Ann Lake Vermont.
- Revise the long established water level histories of Coveville and Fort Ann Lake Vermont, showing that these strandlines were “diachronic,” meaning that these strandlines formed in close association with the receding ice sheet and as a consequence represent spans of time and not narrow time lines, with different ages of different positions on these strandlines. Further, the lowering of these water levels was not a simple progressive step-wise progression but instead these water levels were altered by isostatic uplift, erosion of outlet channels, and other complexities.
- Recognize that the Champlain lobe frontal margin likely was altered by the development of a calving ice margin.
- Introduce new names for Lake Vermont water levels, as discussed elsewhere herein.
a. Introduction – White Mountain Moraine System
A comprehensive review of literature for New Hampshire deglacial geology has not been made, as being beyond the scope of this report, but Thompson et al 8 Thompson, W.B., 2017, Deglaciation and late-glacial climate change in the White Mountains, New Hampshire, USA, Quaternary Research, V 87, pp 96-120. give pertinent information about a portion of New Hampshire deglacial history bearing on Vermont. The “White Mountain Moraine System” ( WMMS) is identified as extending eastward from the Bethlehem and Littleton area across much of New Hampshire to the Berlin area, as multiple nested clusters of morainic segments marking progressive recessional ice margin positions in close association with an en echelon series of step-down local proglacial lakes. The moraines reportedly are composed of loose sandy till, but as well include masses of sand and gravel. The authors present stratigraphic information indicating that the WMMS was associated with a climatically significant readvance of the ice sheet. They suggest that this may correlate with a readvance reported previously by others in the Winooski Basin in Vermont , as discussed further both above and below.
The map below shows the trace of the upper elevation of the WMMS moraine clusters (red line), along the north flank of the White Mountains in the Connecticut Basin, taken from Thompson et al’s Figure 1, placed on a physiographic map to give a general sense of the WMMS location and regional physiographic setting.
Increasing terrain elevations are depicted by darker to lighter green and lighter to darker ochre colors. Also shown are arrows indicating ice movement directions related to the supply of ice to the Connecticut Basin from the Memphremagog Basin (the divide between these basins is marked by the yellow dashed line.
The arrows depicted on the above map give a very general sense of ice movement directions associated with ice lobes at about the time of the formation of the WMMS, as discussed further below. The mapping of ice margins which formed at different times during the ice sheet recession in Vermont deglacial history in this study delineates the location and configuration of discrete ice lobes, showing the progressive conformance of ice margins to physiography. As the ice sheet lowered it became increasingly confined by the terrain, by progressively smaller physiographic basins. The following table gives the elevations of the ice sheet margins at different T times, as discussed in the above Deglacial History section of this report:
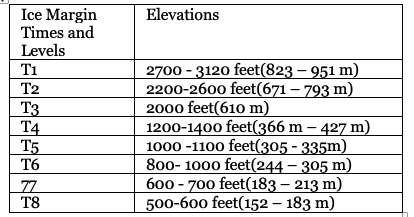
The elevations given on the table above are Isostatically adjusted ice margin elevations using the Canadian border as the reference, with local elevations of features to the south of the border increased by an amount determined by an isostatic slope of 5 feet per mile for the distance measured along a north-south transect to the Canadian border. This adjustment thus corrects for isostatic rebound since the ice margin features formed.
As discussed below, the WMMS is correlated with the T3 and T4 time, level, and margin, This correlation is based both on comparable elevations via the “Bath Tub Model, ” and as well the regional deglacial history setting and context, meaning the correlation fits with ice margin recession and readvance that makes sense and is reasonable. This reasonable fit corresponds with the concept of a “signature” by which deglacial history deduced by usage of the “Bathtub Model” is both supported but as well can be deduced independently from the model.
As a sidebar aimed at amplifying the significance of this signature:
As can be seen T3-T4 levels represent a significant elevation range. Again as discussed below, the highest portions of the WMMS are at about 604 m (1982 feet), descending to 353 m (1158 feet) – these are isostatically adjusted elevations. T3 and T4 time ice margins are mapped extensively in Vermont, showing similar, correlative ice margin patterns and relationships. For example:
1. In southern Vermont in the Vermont Valley T3 time corresponds with an ice margin including stagnant ice deposits mapped, on the Valley floor, including a deposit mapped by Stewart and MacClintock as the “Benington moraine.” These stagnant ice deposits occur on the Basin floor, in close association with associated and slightly higher Ice Marginal Channels which are interpreted as representing an active ice margin formed just prior to and associuated with the stagnant ice margin, as a “hybrid margin.” The Ice Marginal Channels are numerous and clearly delineate the margin of the T3 ice lobe. As discussed in more detail below stagnant ice margin deposits are extensive on the floor of the Vermont Valley, documenting the progressive step-down recession of the ice margin features northward to the Rutland vicinity where the T4 margin is identified. The T3 margin per se is mapped as extending northward along the western flank of the Green Mountains in the Champlain Basin to the Lincoln area, north of which the ice margin is believed to be in the Nunatak Phase. This step-down pattern is similarly continued to the north on the floor of the Otter Creek Basin through the T7 levels and times. Locales LC1 and CB1 provide more detailed information documenting the deglacial history in the Vermont Valley, all of which together establishes a signature pattern that fits with similar features across the State and including neighboring New York, Quebec, and New Hampshire.
2. In northern Vermont, for example, a similar step-down pattern representing the T3/T7 levels and times is mapped on VCGI in Locales L5 and L6 in the North Branch Lamoille Basin. Owing to the steep gradient of this basin, and its elevation range, the deglacial record in this relatively small area is remarkably broad, representing a surprisingly substantial range of Vermont deglacial history.
3. A similar “signature pattern is found in the Missisquoi Basin, again as discussed in detail for many Locales.
4. In the Memphremagog Basin the T4 margin represents the highest mappable ice margin, but higher Ice Marginal Channels at the T3 level are very numerous, clearly showing the development of ice lobes which extend southward across divides with the Lamoille and Connecticut Basins, as discussed extensively in the above report, as for example in the Regional Deglacial History summary overview and in more detail for the “Upper Connecticut Basin Locale.” The Memphremagog deglacial record is more pertinent to the WMMS, clearly showing that the ice sheet in the Upper Connecticut Basin, which includes the WMMS, was nourished by ice flow across divides from the Memphremagog, Lamoille, and Winooski Basins. This record is not repeated here , but is referred to here as a reminder of the Glacier Dynamics associate with ice flow related to the WMMS.
The evidence in the Memphremagog Basin is especially relevant to the Connecticut Basin and including New Hampshire and the WMMS owing to the close proximity and the evidence showing that the deglacial history in the Upper Connecticut Basin was closely related to ice flow from the Memphremagog Basin. In as much as Thompson et al suggest that the WMMS readvance may correlate with a reported readvance evidence in the Winooski Basin headwater area, the following gives a brief overview of T3 and T4 ice margins and associated deglacial history in that area, which essentially is just over the hill, so to speak, from the WMMS area. As previously stated whereas the ice margin at T3 time in northern Vermont is marked at numerous locations, mostly by Ice Marginal Channels, it is also marked by scattered stagnant ice deposits, as for example near col divides between the Winooski Basin and the Connecticut Basin, east of the Marshfield and Cabot areas, as shown on the following VCGI map:
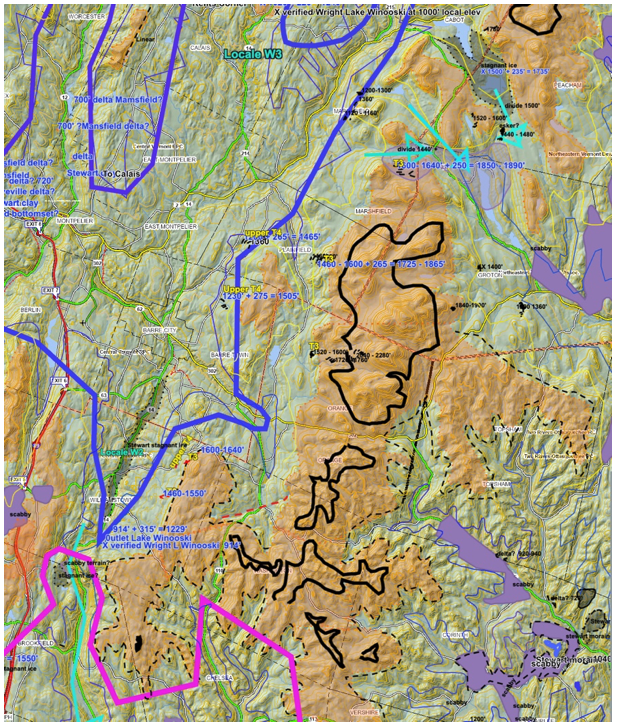
Ice margin features at the T3 level and time are marked (yellow numbers) on this map, which while not specifically demarcated by a T3 margin, suggest an ice margin at the T3 level lying against the western flank of a substantial upland at the headwaters of the Lamoille and Winooski Basin (this map only shows a portion of the Winooski Basin). The ochre color denotes terrain above 1600 feet (488 m) which at T3 time was a major nunatak. Most of these T3 features are Ice Marginal Channels but also include streak-like marks suggesting Drainage Lines formed by meltwater extending southward along the upland flank. The aforementioned T3 stagnant ice deposits at cols east of the Marshfield-Cabot area, include markings on LiDAR imagery which clearly indicate formation by an ice lobe which “stalled,” so to speak, when the ice flow across the col into the Connecticut Basin became insufficient to sustain active ice flow. It is clear that ice flow generally was eastward in the Winooski and Lamoille Basins at this time, and is an example of how ice movement directions can be inferred by VCGI mapping. The turquoise colored arrows indicate ice movement across these cols into the Connecticut Basin. Many of the col divides for ice flow into the Connecticut Basin are at lower levels, generally on divides between the Memphremagog and Connecticut Basins at T4 time.
As discussed previously, T4 time is mapped on VCGI as a “hybrid margin,” which includes an earlier, higher active ice margin, as marked by Ice Marginal Channels which are especially numerous in the Memphremagog Basin, and a lower ice margin marked by stagnant ice deposits, again including at many at the divides between the Memphremagog and Connecticut Basins. Referring to the above table giving the elevations identified as marking different T levels and times, the lowest and youngest moraines at the WMMS, as discussed below, are at an elevation of 353 m (1158 feet), which is taken as at the bottom of T4 level and end of T4 time. Interestingly,T4 stagnant ice deposits are mapped on VCGI in the Connecticut Basin just below Scabby Terrain which, as discussed elsewhere in this report, represents the “Disconnection” of the ice sheet in the Connecticut Basin and en masse stagnation in T4 time.
Thus, these observations suggest that the WMMS spans and represents times initially related to active ice in T3 time followed byrecession and en massestagnation in T4 time. This relates to a long standing debate which, as described by Thompson et al in their report on the WMMS, has been quite controversial. The VCGI mapping in the Vermont Connecticut Basin suggests that both views have merit in that the ice mass in the Basin was a “hybrid” type margin, with both an early active ice margin marked by Ice Marginal Channels. and a lower stagnant ice portion, including the “Saint Johnsbury Moraine” by Stewart and MacClintock and marked here by VCGI mapping as Scabby Terrain, closely associated with slightly lower stagnant ice deposits, including the “Passumpsic Esker” of Stewart and MacClintock. As discussed below, it is suggested that the ice lobe in late T4 time extended southward in the Connecticut Basin as an en masse stagnant ice mass to the Bradford Vermont area, where the Basin narrows, to an ice margin marked by a “moraine” identified by Stewart and MacClintock, in front of which VCGI mapping suggests an outwash plain graded to Lake Hitchcock.
The evidence as discussed further below indicates that the WMMS was related to a Connecticut Basin sublobe that extended eastward into the Ammonoosuc Basin, where the western portion of the WMMS is located. The eastern portion of the WMMS was related to southward ice movement, within the Connecticut lobe, related to local physiography.
Returning to the above VCGI map for the headwater area of the Winooski and Lamoille Basins, as can be seen, the T3 margin on the flank of the Winooski Basin headlands is marked, again at locations marked by the yellow colored labels, by Ice Marginal Channels and Drainage Lines. These features indicate that at T3 time the ice margin pressed against the terrain with substantial southward meltwater drainage. By T4 time (blue lines) the Champlain ice lobe had lowered and its margins were substantially more confined by the lower terrain, leading to the development of Lake Winooski. This map only includes a small portion of the Winooski Basin, but more generally by T4 time the ice sheet in both the Winooski and Lamoille Basins was restricted to the Basin floor, with long appendage-like sublobes extending northward and southward in the many tributary sub-basins. The progressive recession of the ice sheet in the Winooski and Lamoille basins from T4 to later T times is marked by step-down type ice margin features marking the local frontal tips in tributary basins, and as well by similar step-down ice margin features on the main Winooski and Lamoille basin floors, all reflecting recession in a reverse gradient setting. Local proglacial water bodies in these local tributary basins progressively coalesced, becoming Lake Winooski. Whereas the main basin floor recession is not as well marked in the Winooski Basin, ice margin features showing this step-down on the floor of the Lamoille Basin are remarkable. In general, the low gradients of the main basin floors served to stretch out ice margin features marking the recession:
- In the Missisquoi Basin the T7 ice margin is marked on basin floors at Richford and the T8 margin near Enosburg Falls, with older step-down T4 – T6 ice margins marking the floors of major tributary basins.
- On the floor of the Lamoille Basin the T5-T7 margins are marked by a succession of relatively continuous substantial step-down ice margin features, and likewise at T4-T6 levels in tributary basins.
- On the floor of the Otter Creek Basin, substantial stagnant ice deposits mark the T3 margin at Bennington, the T4 margin at Rutland, the T5 margin at Proctor, the T6 margin at Brandon, and (less substantially) the T7 margin at DeLong Hill, West Salisbury, and Leicester Junction.
The ice margins just described represent ice lobe tip frontal margins. This is in contrast to ice margin features formed along lateral ice margins on hillsides where the flow lines were oriented more or less parallel to the margin, which therefore tend to be smaller and less substantial. The T4 margin shown on the above map represents both frontal and lateral margins, including for the main Winooski Basin lobe and its tributary lobes. For example, the main Winooski basin lobe tip on the floor of the basin represents a frontal margin; unlike other major basins, specifically the Lamoille, Missisquoi, and Otter Creek basins, the lobe tip margin is not marked by ice margin features, presumably owing to subsequent erosion. To the south on the above map, a tributary T4 ice lobe extended southward in the Stevens Branch.
Again, it is notable that whereas the receding step-down frontal ice margins in the main basins and their tributary basins were occupied by progressively lower, local water bodies, in T4 time this recession led to regional Lake Winooski and then in turn to Lake Mansfield, the latter at two distinct levels related to ice margin recession and opening of lower outlets. The above map does not include the footprint or strandlines for these regional water bodies, but illustrations elsewhere in this report provide such information.
The presence of these water bodies, specifically Lake Winooski is significant because, as discussed further below, the WMMS is reported by Thompson et al as representing a readvance of the ice sheet, which is correlated with readvance evidence presented by others, also as discussed below, which it is suggested here took place before and during Lake Winooski time. The outlet for Lake Winooski was at the head of the Stevens Branch, as shown on the above map, where the level of Lake Winooski was controlled by drainage across the divide into the Middle Connecticut Basin.
As another sidebar:
As just noted, the WMMS is interpreted here based on VCGI mapping which relates to ice flow and pathways for ice movement from neighboring Basins into the Connecticut Basin as indicated by the mapping of ice margins. These include both lateral and frontal margins. The WMMS likely formed along a frontal T3-T4 margin of the ice sheet, where it butted against the substantial upland terrain to the southeast, which apparently favored moraine formation. Likewise, the T3 margin of the conjoined Winooski-Lamoille Basin lobes butted against substantial uplands in the headwaters of these basins, as marked by scattered ice margin features at the T3 level, examples of which are marked on the above map by ice margin features identified by yellow T3 labels. However, unlike the WMMS, this Vermont ice margin is not marked by moraines but instead as indicated above by scattered meltwater-related ice margin drainage features, specifically Ice Marginal Channels and Drainage Lines (the nature of these types of features is described more fully in the main body of the above report). The explanation for this difference is obviously important but at this point is not fully understood in terms of the associated Glacial Dynamics and Styles. This issue as well relates to the tendency for Ice Marginal Channels to preferentially form at certain specific locations, usually on north facing hillsides, specifically where the terrain is locally more protuberant. This is believed to be related to polythermal conditions, where drainage is restricted at the cold-warm boundary beneath active ice margins. Perhaps these represent “pivot points” as discussed below.
It is intriguing to speculate about why the ice sheet is marked by moraines at the WMMS in New Hampshire, and likewise at various locations in Quebec and New York, as compared to the general absence of such features in Vermont, but instead by stagnant ice and drainage features. The New Hampshire WMMS lies as a frontal margin against more steeply sloping, substantial upland terrain which is oriented more or less perpendicular to the ice sheet flow direction, but so too was the ice margin at the headwaters of the Winooski and Lamoille basins as discussed above. One thought is that perhaps this difference in ice margin features relates to large scale physiographic differences between the Champlain versus the Connecticut lobes, meaning the regional configuration of the “Bath Tub” and associated drainage of surface meltwater on the regional Laurentide ice sheet. Vermont ice margins in both the Memphremagog and Champlain Basin likely are located at the downgradient margin for drainage of a large area of the Laurentide ice sheet, including portions in Quebec, in contrast to the Connecticut Basin which was “protected” from such drainage by drainage divides which emerged at an early time in the Nunatak Phase of ice recession. Perhaps such thinking likewise may explain why moraines are found in Quebec and New York, the difference being that the Champlain Basin and to a lesser extent the Memphremagog Basin received much more substantial quantities of meltwater. This is illustrated by the many prominent Bedrock Grooves along the northwestern flank of the Champlain Basin. Also, the Shattuck Mountain pothole tract, which is located at a physiographic embayment where meltwater entrapment would be expected, likewise reflecting the very significant quantities of meltwater. In time, of course, as is well known, Vermont, more specifically the Champlain Basin, received drainage from a large area, including a large portion of the Ontario Basin in later, Fort Ann and late T6 and T7 times, prior to the Champlain Sea, but the point is that Vermont, again more specifically the Champlain and Memphremagog Basins, served as the “drain,” so to speak, for a large portion of the Laurentide ice sheet which may help to explain the absence of moraines.
This concept also applies to the moraines reported in southern Quebec just to the north of the Vermont and New Hampshire border where my reconnaissance (by biking and hiking) has shown that the moraines, as described by Parent et Occhietti and others, tend to be short segments lying against local upland knobs, such as for example the Sutton Moraine on the northwest flank of Mont Sutton. Physiography and associated drainage likewise accounts for the discontinuous nature of Quebec moraines. Shilts (1981), who mapped the Lac Megntic area in Quebec, refers to “pivot points” where the ice sheet margin was obstructed by local uplands. I see such pivot points as possibly being conceptually important, not just in terms of moraine formation, but as well for associated ice margin drainage. Ice Marginal Channels tend to preferentially form on north facing slopes, perhaps at pivot points. Further study of such pivot points and meltwater drainage would seem warranted.
Coming from my background in hydrogeology in the latter portion of my career, I am inclined to think in terms of groundwater models. It seems to me that the understanding of ice sheet Glacial Dynamics and Styles, as related to such meltwater and drainage differences as indicated by deglacial history deserve more study. My sense is that the consideration and examination of deglacial history in the context of flow nets with ice/meltwater equipotentials and associated flowlines, within, beneath, and adjacent to the ice sheet along its margins, would be beneficial.
Returning once again to the T3/T4 ice margin features as depicted on the above map at the head of the Winooski Basin, as just stated these include stagnant ice deposits at cols and as well Ice Marginal Channels and Drainage Lines. Several Drainage Lines are very substantial and traceable, with southward gradients, clearly indicating substantial meltwater drainage along the frontal ice Winooski lobe ice margin. This southward drainage extended along the Winooski Basin headlands into the Stevens Branch basin in T3 time across the regional divide into the Connecticut Basin, but in T4 time this drainage became trapped, initiating Lake Winooski. As discussed further below, Thompson et al’s suggestion that their WMMS readvance may correlate with readvance evidence reported by others in the Winooski Basin relates to the events in the Winooski Basin as just described in T3 and T4 time associated with the development of Lake Winooski in T4 time.
The preceding discussion pertaining to the WMMS presents information pertaining to ice flow direction, lateral, and frontal margins, as deduced from VCGI mapping of ice lobe margins and associated deglacial history. Of course, ice flow directions can also be deduced from striations and other ice movement indicators, as discussed by Stewart and MacClintock in their statewide report and in other reports by Cannon, Caulkin, and others, most especially in remarkable detail more recently by Wright and colleagues. VCGI mapping does not provide such details as striations and thus these are not directly dealt with here. However, such information is obviously important to the understanding of deglacial history. In general, my review of the published striation information: a) shows the progressively increasing influence of physiography through time (supporting the Bath Tub Model), and b) helps to delineate and distinguish frontal versus lateral ice margins. However, the striation story itself is complex, relating to the role of cold versus warm based ice, which in turn likewise pertains to deglacial history details such as just described.
b . Regional Perspective for the T3/T4 Vermont margins related to the WMMS and moraines in Quebec
Bearing in mind the preceding, the following is a portion of a map given by Parent et Occhietti (1999, Figure 2), depicting ice margins in Quebec immediately north of the border with Vermont and New Hampshire:
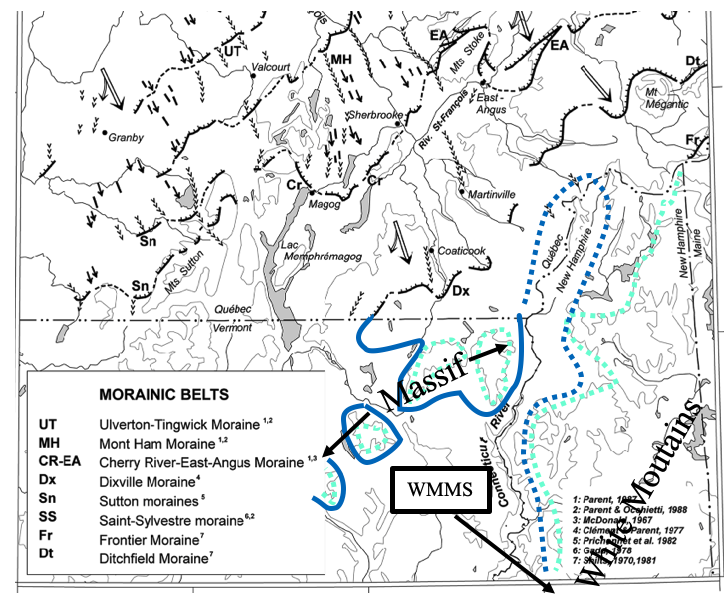
As discussed in the body of this report and as discussed further below, VCGI mapping using the ‘Bath Tub Model” shows that the Dixville moraine (DX) is correlated with the T4 margin, shown here schematically by the blue colored line extending southward from the Dixville moraine, into the Memphremagog Basin in Vermont. Again, the T4 margin is defined as a “hybrid margin” consisting of two portions, including an upper portion marked by Ice Marginal Channels indicative of active ice, and a lower portion marked by stagnant ice deposits.9 All ice margins likely were hybrid in nature, but the Memphremagog Basin was especially favorable for the development and record of such distinctions. This margin is mapped as extending southward in the Memphremagog Basin so as to abut against the upland “massif” front on the south side of the Basin, with narrow finger-like tributary sub-lobes penetrating the massif in the Clyde, Willoughby, and Barton Basins, extending across divides into the Connecticut Basin, and likewise in the Black and Upper Missisquoi Basins into the Lamoille Basin. These fingers indicate ice flow supply pathways to downgradient portions of the ice sheet, as indicated by the arrows marked on the preceding physiographic map.
The T4 margin is drawn schematically on the above map to suggest an ice mass at T4 time which is largely entrapped by uplands in the Connecticut Basin. The following is the same physiographic map as above, illustrating the physiography of the Connecticut Basin, from Bradford Vermont northward into Quebec, including the vicinity of the Quebec, Maine, and New Hampshire borders:
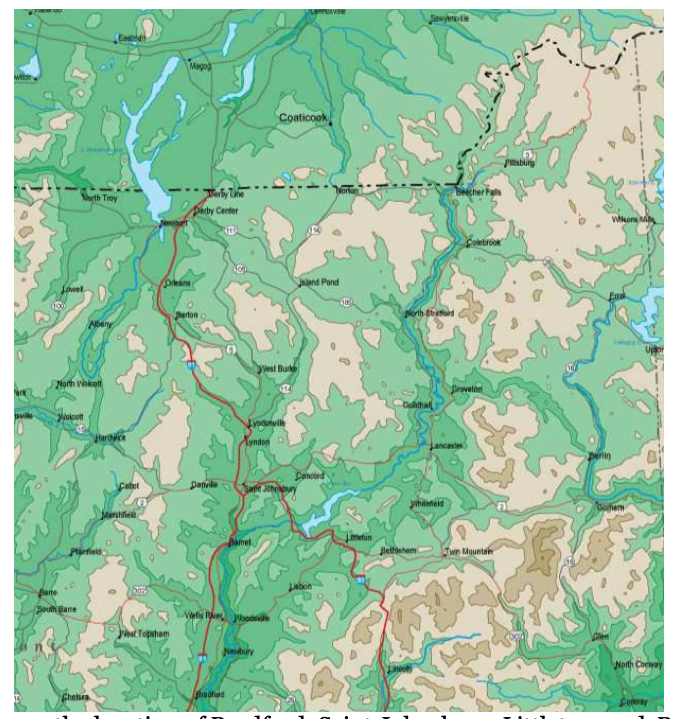
This map shows the location of Bradford, Saint Johnsbury, Littleton, and Bethlehem, and is presented here as it more substantially illustrates the physiography of the northern Connecticut Basin. As can be seen, the floor of the Connecticut Basin, as marked by the pale green color extends northward into Quebec, and is enclosed by uplands of the Appalachians, again corresponding with the delineation of the T4 margin as suggested above. As can be seen, the White Mountains served as a major barrier against the ice sheet, as did the uplands in Quebec.
As noted above, the higher and older T3 ice margin per se corresponding with the WMMS has not been mapped in northeastern Vermont. Again, as indicated in this report, the T3 margin is mapped as extending northward from Bennington along the Champlain Basin foothills to the Lincoln area, beyond which the T3 margin is believed to be in the Nunatak Phase in northern Vermont. However, T3 level and time features exist in northern Vermont exist, some of which have just been described. The mapping of northeastern Vermont was done at an early time in this project. A cursory examination of this area indicates that with further study it might be possible to identify, map, and correlate T3 features in this area as a discrete margin. In any case, the T3 margin is drawn by the turquois colored line on the above Parent et Occhietti map. The T3 margin was initially correlated with the Frontier moraine in Quebec, which is the higherst and oldest moraine on their map. According to Shilts (1981, p 48) 10 Shilts, W. W. ,1981, Surficial Geology of the Lac Megantic Area, Quebec, Geol Sur of Canada Memoir 397, 102 p. the Frontier moraine consists of a complex with multiple ridges ranging in elevation from 520 to 580 m. As discussed below the adjusted elevation of the eastern portion of the WMMS is estimated to be about 604 m. Thus, the T3 margin at the WMMS and the Frontier moraine appear to be at about the same elevation.
Franzi (personal communication in 2025) has suggested that a lobe extending southward in the Connecticut Basin from Quebec would necessarily require an ice surface gradient, and thus the correlation of the T3 margin at the WMMS with the Frontier moraine in Quebec in his opinion seems unlikely. However, regional isobases drawn by Parent et Occhietti (their Figure 5 as presented elsewhere herein), show a curvilinear isobase pattern, from nearly eastwest for the axis corresponding with the Champlain Basin, to northeast-southwest for eastern Vermont, New Hampshire, and and Quebec in the Sherbrook area. Thus, with this in mind the correlation of the T3 margin as at the WMMS with the Frontier moraine in Quebec seems reasonable.
Accordingly, while imprecise, the correlation of the T3 margin at the WMMS with the Frontier moraine complex in Quebec near Lac Megantic, east of Sherbrook, is suggested. Owing to the small scale of this map, the T3 and T4 margins can only be drawn schematically. As repeatedly stated in this report, these ice margins represent the recession of the ice sheet, not its advance into these basins. The WMMS reportedly represents a significant readvance. Whether or not any evidence of a readvance for the Frontier moraine is unknown, but is not reported by Shilts (1981).
Again, the T3 and T4 margins were formed when the ice sheet pressed against the substantial White Mountain uplands in New Hampshire. The above map of the T3 margin suggests that at T3 time the ice mass in the Connecticut Basin was still connected with and fed by the Laurentide ice sheet , but that this ice mass became “Disconnected” when the ice level and margin receded to T4 time, again as depicted on the above Parent et Occhietti map. This interpretation fits with and is consistent with the interpretation given above that the T4 ice sheet extended across the narrow divides from the Memphremagog Basin into the Connecticut Basin, with a hybrid margin marked by ice marginal channels indicative of active ice, and associated with slightly lower stagnant ice features, and as well the Scabby Terrain in the Connecticut Basin. Thus, this interpretation fits well with the physiography as shown on the regional maps above, consistent with the “Bath Tub Model.”
c. Detailed information about the Memphremagog and Connecticut Basin Connections
More detailed information about the ice margins and deglacial history in the Memphremagog Basin, extending into the Upper Connecticut Basin as mapped on VCGI can be provided by the following side bar:
Substantial information related to the deglacial history of the Upper Connecticut Basin is given by the VCGI mapping reported here, which appears to relate to the White Mountain Moraine System. The following map presents a screen shot of the VCGI map for northeastern Vermont.
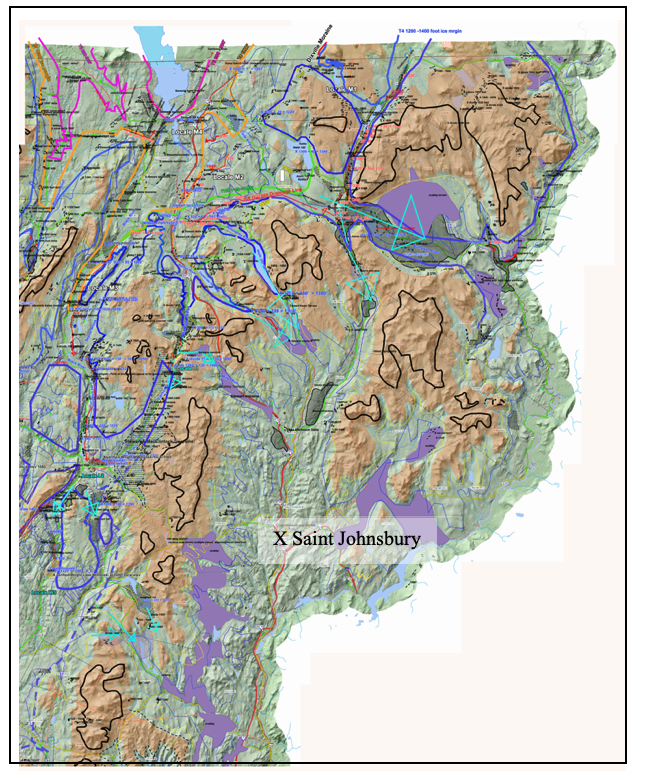
The Quebec border is on the upper margin of the map and the Vermont/New Hampshire border is along the Connecticut River on the right side. The City of Saint Johnsbury again is located for reference. Moore Reservoir, which is near the western end of the “Bethlehem Moraine Complex” and the White Mountain Moraine System, is visible at the elbow along the State margin. The ochre colored areas designate elevations above 1600 feet(488 m), and the black contour lines trace the 2000 foot(610 m) contours. These elevations are present-day and have not been adjusted for isostatic rebound, but nevertheless give a reasonably good sense of the physiography in late glacial time. In general, the upland areas represent the aforementioned massif which extends across the Memphremagog Basin.
As discussed above, the northern Connecticut Basin is substantial upland terrain. The floor of the Connecticut Basin in this area is relatively high and narrow. The Upper Connecticut and Memphremagog Basins share a mutual physiographic divide marked by multiple low cols. As marked by stagnant ice deposits and drainage features, these cols served as ice sheet flow pathways for ice supply from the Memphremagog Basin into the upper Connecticut Basin. The turquois colored arrows on the above map identify the ice flow pathways at these cols.
The purple colored areas on the above map mark Scabby Terrain Tracts, which generally occur at a slightly higher elevation and in close association with stagnant ice deposits on the floor of the Upper Connecticut Basin, again as discussed above. The Scabby Terrain Tracts are interpreted as having formed when the ice sheet in the northern Connecticut Basin became “Disconnected” from the parent ice sheet in the Memphremagog Basin, owing to the thinning of ice to thicknesses when and where active ice flow across cols was not sustained. As can be seen, the Connecticut Basin narrows southward to the Bradford vicinity, as is also the case for the White Mountains.
Also as discussed above, the Scabby Terrain features correspond remarkably closely with a “moraine” mapped by Stewart and MacClintock, described as among the best that they have seen in all of New England. According to their description, this feature is composed of a sandy textured till, here interpreted as an ablation type till, which interestingly compares with a similar description given by Thompson et al for their morainic System. For reasons given in this VCGI report, the evidence given indicates that Scabby Terrain, which is found as tracts in multiple locations in Vermont, is a unique deposit associated with “Disconnections,” as described in recent glaciological literature. Whereas I have thought of Scabby Terrain as being a stagnant ice margin feature, it is possible that it represents the transition of the active ice margin to a stagnant ice margin.
Again as noted above, the Scabby Terrain grades downward at lower elevations into stagnant ice deposits on and close to the floor of the Upper Connecticut Basin. The Scabby Terrain tract and the stagnant ice deposits together are here interpreted as having formed in late T4 time, when the thickness of the receding ice sheet diminished such that ice supply across col divided with the parent ice sheet in the Memphremagog Basins, again as marked by the turquois colored arrows on the above VCGI map, was no longer sustained, resulting in en masse stagnation of the ice mass in the Upper Connecticut Basin.
And again, the T4 ice margin in the Memphremagog Basin is described as a hybrid ice margin, with the upper limit marked by Ice Marginal Channels as an active ice margin at an elevation of about 1400 feet (427 m) formed in early t4 time, in close association with stagnant ice deposits at elevations of about 1200 feet (366 m) formed in late T4 time.
d. WMMS Moraine Elevations and Correlative T margins and times
As indicated by Thompson et al, the trace of the White Mountain Morainic System as shown on the above physiographic map represents the upper and southern boundary of multiple clusters of moraine segments, which likely were not all formed at the same time. This trace was superimposed on a topographic map below to give a sense of the approximate elevations of the trace at different locations, and to get a better understanding of the associated topography. The determination of elevations was done roughly, only to give a crude estimate of elevations along the System trace. However, these elevations were compared with elevations given on Thompson et al Figure 2, which confirmed that the elevations given below are approximately correct. Thompson et al’s Figure 2 also shows individual moraine segments, associated with multiple clusters. The “Bethlehem Moraine Complex” is the westernmost cluster of moraine segments, close to the border with Vermont in the Littleton-Bethlehem area. It appears that these moraine segments occur over a broad elevation range in each cluster from the high elevations on hillsides as demarcated by the above trace, downward toward and close to basin floors. Thompson et al report that the moraine crests in the westernmost cluster, range in elevation from 420 m on the hillside to 280 m near the Ammonoosic Basin floor.
As can be seen the trace generally follows the physiography except for the dashed line portion. Also as shown, the elevations of the trace, which marks the uppermost boundary of multiple moraine clusters, tend to decrease westward, suggesting by the Bath Tub Model that the formation of moraine segments began earlier in the eastern portion of the System, followed by northward and westward recession, with later development of the western portion near Littleton and Bethlehem. In fact, this is corroborated by the Thompson et al’s map Figure 2 showing recessional ice margin positions for the trace.
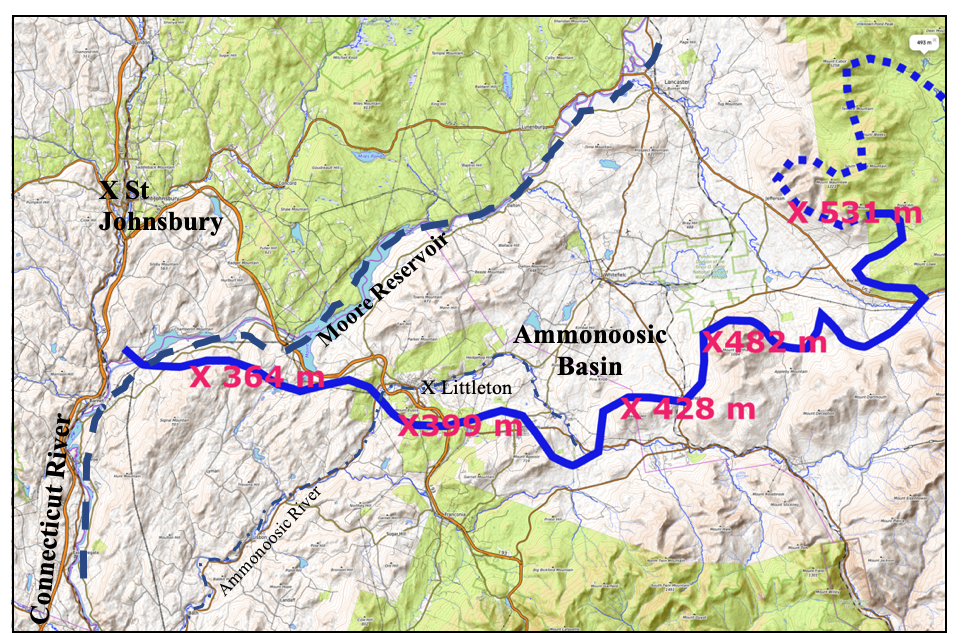
These elevations were compared to the T time and level chronology using the “Bathtub Model” as presented in Section III above, by adjustment of the elevations to take into account isostatic rebound at the rate of 5 feet per mile (0.95 m/km) for the distance to the Quebec border, assuming east-west isobases. 11 The issue of isobase orientation is a complication in these calculations, as discussed elsewhere herein. The approximate distance to the Quebec border is about 48 miles (77 km), which gives a correction factor for isostatic rebound of 240 feet (73 m). Thus, we have:
This indicates that the Moraine System for the eastern portion depicted on the above map may have begun to form in T3 time, with the recession of the ice margin to the Littleton-Bethlehem area perhaps in early T4 time, followed by recession with moraine formation continuing through late T4 time.
As noted above, T3 time represents the earliest time and highest margin in the Lobate phase in southern Vermont, corresponding for example with the Bennington “moraine” of Stewart and MacClintock, preceded by Disconnections in the Lower and Middle Connecticut Basins in T1 and T2 times. Thus, if correct, the higher portion of the White Mountain Moraine System represents the beginning of the recessional Lobate Phase history for much of Vermont. This makes sense in that the White Mountains in New Hampshire represent a significant upland barrier. In contrast, in Vermont the Champlain Basin presented lower physiographic terrain which allowed the ice sheet to extend much further to the south, which of course defines the Champlin lobe.
Again, in the Memphremagog Basin, the highest ice margin mapped on VCGI is at the T4 level and time, marking the top of the Lobate Phase. As just stated in the preceding, these features are mapped along the northern margin of the massif which extends across the Basin, with long fingers of ice associated with the overdeepened tributary basins, which penetrate the massif, such as the Clyde, Barton, Willoughby and Black basins. As noted, re-examination of the VCGI mapping in the Memphremagog Basin, which was the first area examined, early in the VCGI mapping, suggests it might be possible that some of the high level ice margin features identified in this Basin may be at the T3 level. This interpretation would make sense in that the mapping for the entire State shows a remarkable sensitivity to physiography, with ice margins commonly abutting against more substantial upland terrain, in contrast to the more spread out, distended ice margins on basin floors owing to the lower gradients.
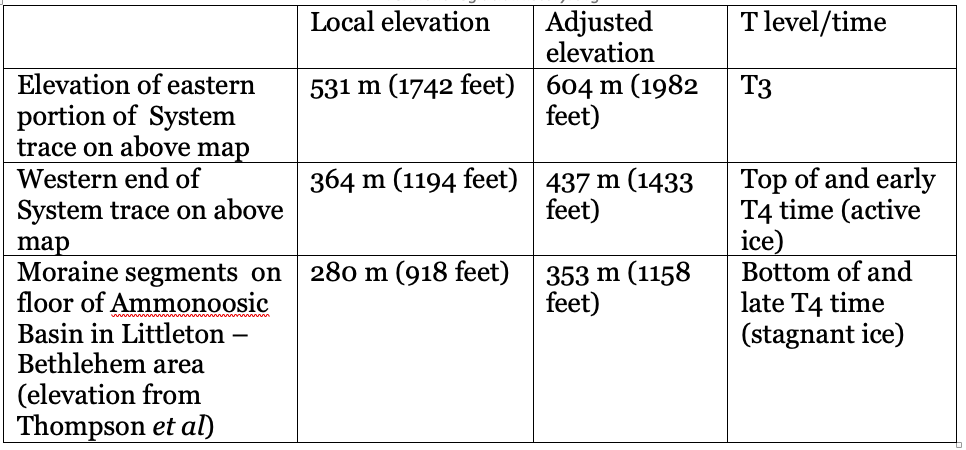
Whereas VCGI maps in Vermont generally do not provide information across the border on the New Hampshire side of the river, by an apparent coincidental digital fluke, LiDAR and topographic information is shown on VCGI imagery for a very small portion on the New Hampshire side, near the western end of the Bethlehem Moraine Complex, on the hillside east of Moore Reservoir , on the north side of the Ammonusic Basin mouth. The following are screen shots, on the left from VT’s VCGI map, which in this case has a tab turned on to show surficial geology as mapped on the State Surficial Geology map, and on the right from NH’s online “Granit” LiDAR imagery:
The water body shown on both screen shots is the Moore Reservoir on the Connecticut River. Both screenshots show the same ice margin features, which in this present (VCGI) report are referred to as “Ice Marginal Channels.” Again, for reasons given elsewhere in this report, these Channels are interpreted as marking ice margins of active ice. The Granit LiDAR imagery more clearly and substantially delineates these features. On the Vermont VCGI screenshot, the Ice Marginal Channels are marked by dashed black lines and are somewhat less visible owing to the usage of the surficial geology tab, which suggests the Ice Marginal Channels likely are formed in till (the ochre colored area).
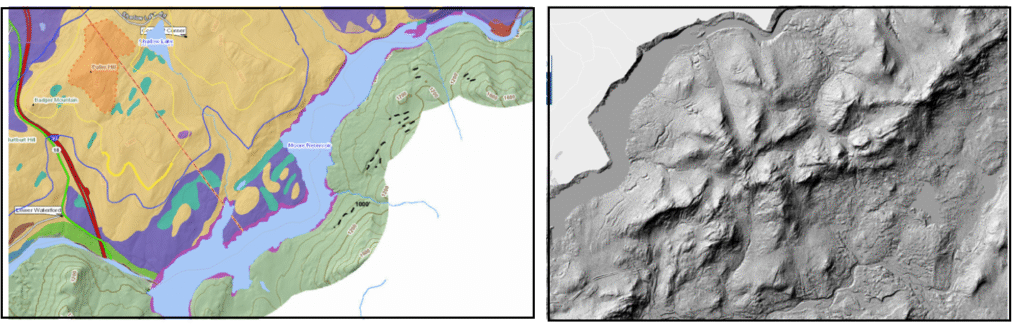
The following is a closer, enlarged view of these Channels, again from online Granit LiDAR imagery:
As can be seen this shows more definitive evidence of ice margin positions between the red dashed lines, with both Ice Marginal Channels and streak-like tonal patterns. This suggests ice margin recession, like, per the oft repeated phrase in this report, “multiple rings on a slowly draining bathtub.” The Channels range from a high elevation of about 1400 feet(427 meters), to a low of about 1000 feet(305 m). The streaks resemble and may be “Steps” but the information is insufficient to establish that the features are associated with topographic risers and steps. In essence, the Ice Marginal Channels and “streaks” (or Steps) suggest and represent an ice lobe in the main Connecticut Basin, which extended across a low divide into the Ammonoosic Basin, as part of the White Mountain Moraine System. All of these features likely mark the receding ice margin from an elevation of about 1700 feet(518 m) to about 1000 feet(305 m), which is close to the full range of moraine segment elevations of the White Mountain Moraine System as shown above.
Thompson et al (p. 98), identify stratigraphic evidence of a readvance which they believe to be associated with the WMMS, but express uncertainty and the need for caution in regard to the correlation of the readvance evidence with specific morainic clusters in the WMMS. Whereas the VCGI mapping here suggests that the WMMS is generally correlative with T3 and T4 margins, levels, and times in Vermont, the VCGI mapping methodology is blind to subsurface stratigraphic and/or structural information, and therefore can not firmly establish this correlation. Thompson et al recognize the difficulty associated with differentiating more substantial readvance evidence from “normal” possible ice margin recessional oscillatory pulsations evidence, both of which may generate similar stratigraphic and structural features.
As indicated above, Thompson et al suggest the possibility of a correlation with a reported readvance in the Winooski Basin in Vermont. Various reports present evidence in the Winooski Basin interpreted as indicating a glacial readvance in this basin, including for example Larsen,1987,12 Larsen, F.D., 1987, History of glacial lakes in the Dog River Valley/central Vermont, in NEIGC Guidebook for Field Trips in Vermont V 2, pp 214-236., Wright, 2015, 13 [Wright, S.F., 2015, Extent of the Middlesex Readvance in the Winooski River Basin,northern Vermont; GSA Abstracts, V 47,p Wright, Springson, and Van Hoesen, 2015, 14 Wright, S.F., Springston, G. E, and Van. Hoesen, J.G., 2015, Ice Retreat and Readvance across the. Green Mountain Foothills: Bolton and Jericho, Vermont, NYSGA, pp 327 – 352 and Wright, 2020.15 Whereas these authors do not specifically relate such evidence to mapped ice margin positions, the exposures generally occur within the footprint of proglacial Lake Winooski which is here correlated with the T4 margin, but some sites are at slightly higher levels, likely within the T3 level. Thus, it is possible that the WMMS readvance may correlate with readvance evidence in the Winooski Basin in T3 and T4 times, but if so the margin connecting the two areas likely would have been quite convoluted, essentially as shown by the regional trace of the T4 margin as given below. The possible correlation of the readvance with T3 time leading to T4 time and the development of Lake Winooski is significant in that the evidence indicates that the ice sheet was rapidly penetrated by standing waters of Lake Winooski along its perimeter. This resulted in the Disconnection of large ice masses in deep Basins along the western margin of Lake Winooski, which may or may not have remained temporarily active but are marked by Scabby Terrain which suggests en masse stagnation. Along the eastern margin of Lake Winooski , as at Locale W3 in the northwestern headwaters of the Winooski Basin, ice masses were left remaining and isolated in deep kettle holes by the rapid recession of the ice. It is possible and appears likely that the step-down ice margin recessional pattern with expanding and coalescing proglacial lake waters leading to the development of Lake Winooski may have been a destabilizing Glacial Dynamic. The nature or condition of this destabilization, if correct, is largely unknown and in and of itself deserves further study. It is possible that the receding ice margin became oscillatory in nature, which might account for the wide distribution of locations of exposures where stratigraphic evidence suggests a readvance. Recent glaciological literature reports suggest that proglacial water bodies may cause significant instability effects, including ice margin oscillations. 15For example: 1) Carrivick. J.L. and Tweed F, S., 2013, Proglacial lakes: character, behaviour and geological importance; Quaternary Science Reviews, V 78, pp 34-52; 2) Merritt. J.W. et al, 2024, A detailed investigation into the legacy of glacial readvances and ice-dammed lakes around Sellafield, West Cumbria: Implications for 3D modelling, hydrogeology and ground engineering; Proceedings of the Geologists’ Association; Volume 135, Issue 6, , Pages 695-743
The Winooski Basin ice margin was of course a sub-basin appendage of the Champlain lobe. The T3/T4 margins are mapped on VCGI extending southward in the Champlain Basin into the Vermont Valley, past Rutland to the Bennington area, both locations where Stewart and MacClintock identified significant moraines. My VCGI mapping identified these features as stagnant ice deposits. The distinction as to whether or not these deposits are moraines versus stagnant ice features is a semantic nomenclature matter which is not significant in terms of using these features as ice margin markers. However, such stagnant ice deposits by definition do not indicate the presence of active ice. In terms of active ice margins, it is noted that Ice Margin Channels, which again are here interpreted as having formed along active ice margins, are numerous along the flanks of the Vermont Valley, just below the elevation of the T1 and T2 ice margin. Thus, these may correlate with the WMMS readvance, which would suggest the readvance occurred in T3 time. However, again owing to the lack of subsurface stratigraphic or structural evidence, such a correlation is uncertain.
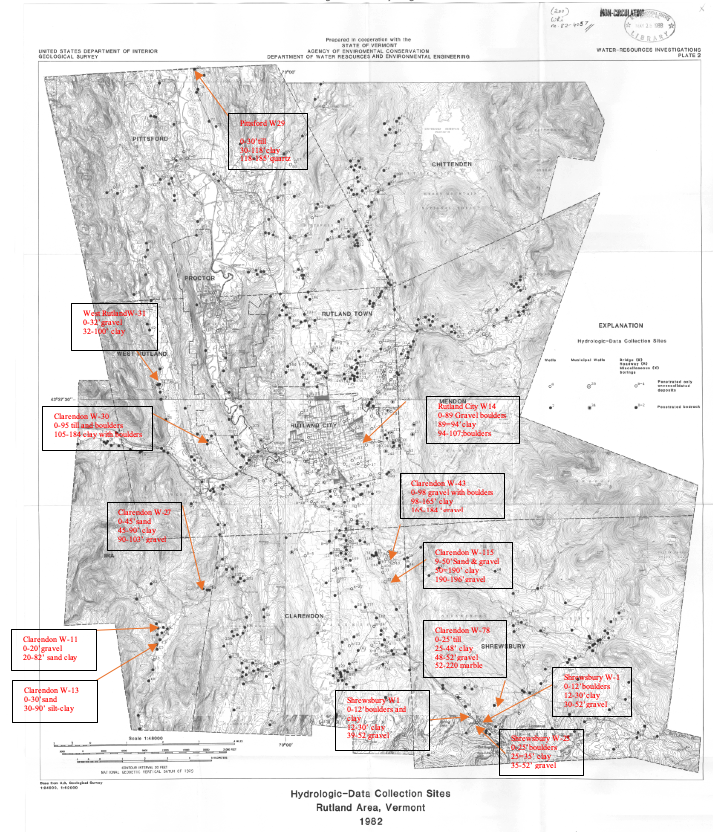
In the Rutland area a USGS study by Wiley and Butterfield 16 Willey, R. E. and Butterfield, D., 1983, Ground-water resources of the Rutland area, VT; US Geol. Sur Water-Resources Investigations 82-4057, 38 p.[\mfn] presents well and boring logs in that area. The following is a map from their report showing the locations of selected borings, focusing on well logs which indicate possible glacial materials overlying lacustrine material, which if correct would support a possible readvance in the Rutland area. The well and boring logs were mostly developed by water well drillers and others without geologic training, but include some information suggestive of more qualified personnel. In general, these logs are not regarded as fully reliable and are not dispositive with regard to the issue of a readvance. However, some information exists, as shown on the map, which is consistent with and supportive of the possibility of a readvance. In the interpretation of evidence, such as presented here in the Rutland area, it must be remembered that given the step-down nature of the ice margin in close association with proglacial lakes the presence of lacustrine materials beneath associated glacial deposits does not necessarily indicate readvance but instead merely may reflect local oscillations. Further study of this issue is needed. South of Rutland in the Vermont Valley and neighboring areas reports by others likewise indicate the presence of buried sand and gravel beneath till and or lacustrine material. For example, Jerris (1991) 16Jerris, R. M., Hydrogeology of the Bennington and Shaftsbury area, Vermont; Williams College Bathchelors Thesis; 89 p.
The most comprehensive report on the surficial geology of the region including southwestern Vermont is by De Simone and La Fleur 1985, ibid. As noted above these authors delineate ice margin positions for the receding ice sheet which correspond remarkably well with the ice margins found here in this present study. It is not clear from their report whether or not they found any stratigraphic evidence of sand and gravel buried beneath or in association with lacustrine sediments or till, or structural evidence of ice margin oscillations. However, The authors state (p. 88) that they found no evidence supporting a readvance in this area, specifically making reference to the previously reported Luzerne readvance, and adding that “there is no evidence that these (referring to their twelve ice margin positions) are readvance positions,” though they make reference to “minor surges.”
Unlike the WMMS which formed where the ice sheet abutted against a substantial upland the T3 and T4 margins in the Vermont Valley formed in a low gradient setting which effectively tended to distend the ice margins. In fact, as discussed elsewhere, ice margin features show a more or less continuous, progressive step-down type recession of stagnant ice margins between Bennington and Rutland, over a distance of about 55 miles (88 km). This suggests prolonged and sustained recession from T3 to T4 time, with the simplest interpretation being that the readvance, if present, occurred in early T3 time as marked by the Ice Margin Channels, as a hybrid T3 margin. As such, whereas the T3 and T4 features in the Vermont Valley do not establish a firm correlation with the WMMS, the circumstantial evidence is compatible with such an interpretation. The Vermont Valley should be an optimal location to find readvance evidence, if it exists.Of course, this presupposes that the ice margin everywhere behaved monolithically, which Parent et Occhietti in Quebec and others for the Laurentide ice sheet more generally have shown is not the case.
Thus, in sum, the evidence raises the possibility of evidence in Vermont which might correlate with the WMMS and associated readvance , but all of this deserves and requires further study. The magnitude of the recession, prior to the readvance is unknown. As indicated above, in the Vermont Valley, subsurface well and boring logs, in both the Bennington and Rutland areas , include evidence of till overlying gravel and or lacustrine material. It is possible that the recession and subsequent readvance may be represented by this record. If so, this would suggest a readvance over a distance of about 50 miles, perhaps more, which would indicate a very substantial, major recession and readvance event Of course, the low gradient of the Vermont Valley might serve to magnify any ice margin position changes as compared to other locations in Vermont and as well the WMMS area. However, alternative interpretations are possible, as for example, that the ice margin in the Rutland and Bennington areas may have been oscillatory in nature during its recession. In all of my mapping in the 1960s and 1970s I found no subsurface stratigraphic evidence which would suggest multiple tills suggestive of a major readvance . Also, the reports in New York by De Simone and La Fleur and in Quebec by Parent et Ochietti do not indicate evidence of a major readvance associated with the T3/T4 correlative ice margins. But, again, further study of this issue is warranted.
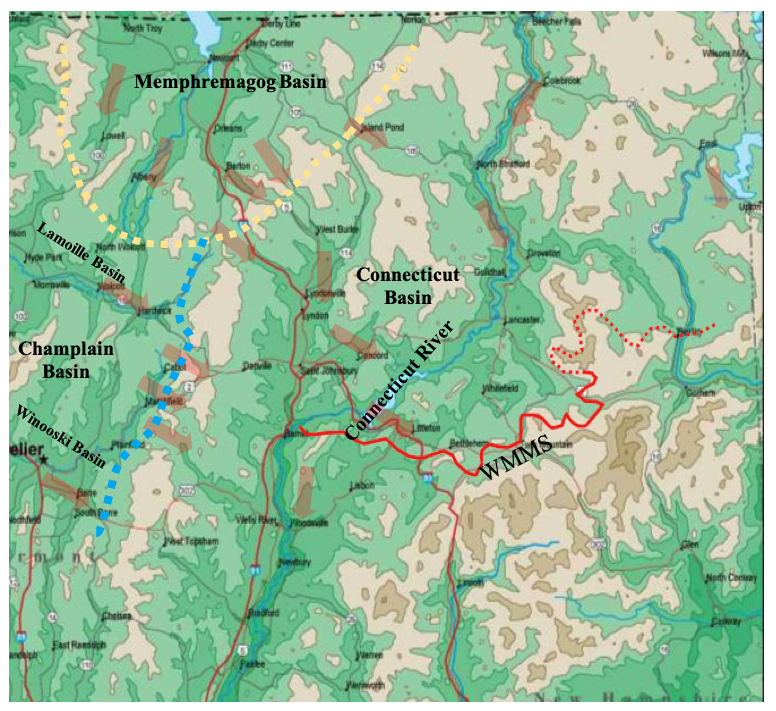
To give a larger sense of the possible spatial relationship of Thompson et al’s “White Mountain Moraine System” to the regional physiographic setting and deglacial history in Vermont, the physiographic map here shows the above trace representing Thompson et al’s WMMS, added as a short appendage to a regional map as presented elsewhere in this VCGI report.
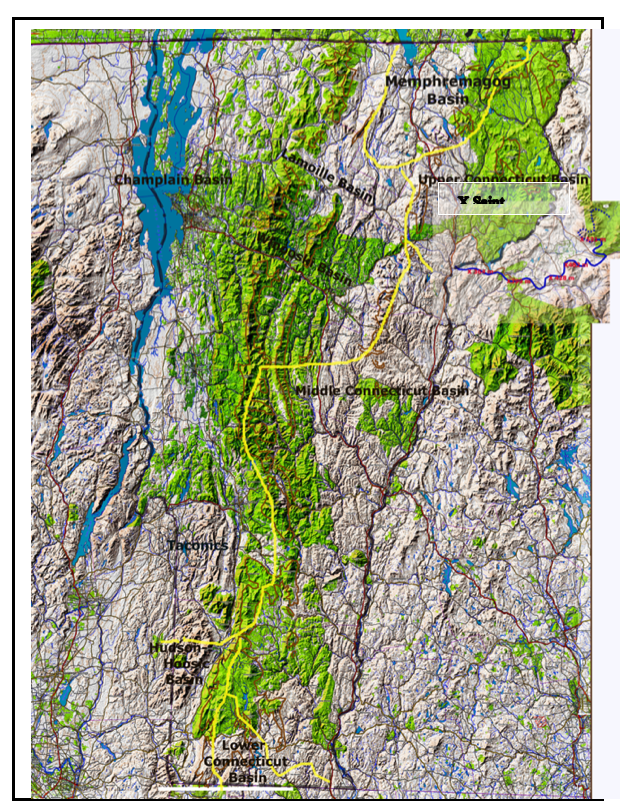
This map shows the Vermont State boundary relative to New Hampshire and the major drainage basin boundaries in Vermont designated by the yellow lines.The WMMS is within the Upper Connecticut drainage basin. The Vermont city of Saint Johnsbury is located on the map for further locational reference (the word “Saint Johnsbury” is partially cutoff).The White Mountain Moraine System is accommodated by the projected eastern extension on the above map. As can be seen, the WMMS and related features are within the Upper Connecticut Drainage Basin which extends southward to the Bradford Vermont vicinity.
The following map shows T4 time ice margins in Vermont, marked by the blue line and the associated ice sheet coverage marked by blue shading. Whereas a similar map drawn for T3 time would be more appropriate, as just noted the VCGI mapping has thus far been interpreted to indicate that northern Vermont was in the Nunatak Phase in T3 time. Further study might reveal correlative T3 margins in northern Vermont. However, this T4 map gives a general sense of the spatial relationships that likely existed in T3 time.
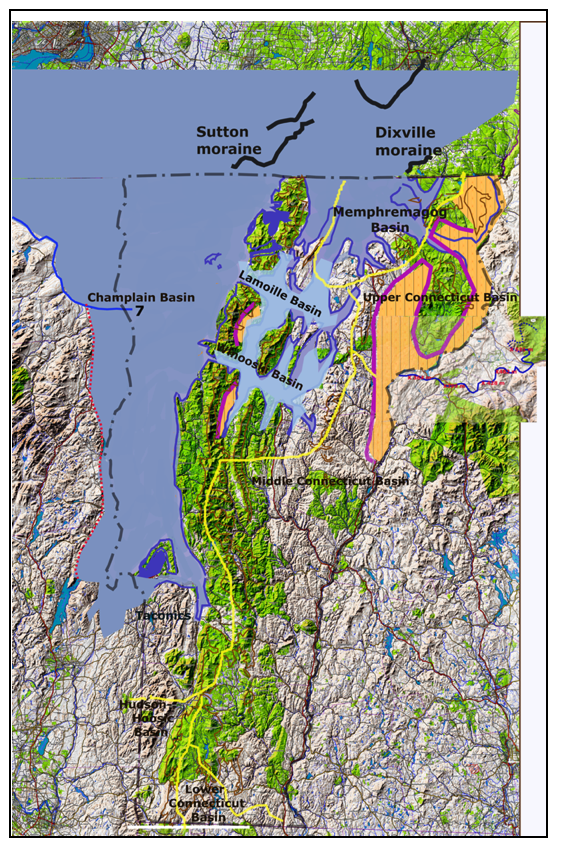
In T3 time, Lake Winooski and the en mass stagnant ice masses west of the Lake Winooski footprint, and the area of en masse stagnation in the Upper ConnecticutBasin would not yet have formed. Instead the T3 margin in the Upper Connecticut Basin likely would be represented by an active ice lobe extending southward to the Bradford area. This lobe would then have stagnated en masse in T4 time, as would the areas west of the Lake Winooski footprint, corresponding with the areas designated on the map by the orange coloration.
As discussed above, based on the adjusted elevations, it is here suggested that the eastern portion of the White Mountain Moraine System correlates with the T3 margin, which is the oldest T level and time within the Lobate Phase in Vermont, and the western Littleton-Bethlehem Moraine Complex portion of Thompson et al’s “White Mountain Moraine System” correlates with the T4 margin in Vermont. The above described T3-T4 Ice Marginal Channels and “streaks”at the mouth of the Ammonoosic Basin, which are interpreted as associated with active ice margins, fit with Thompson et al’s evidence of a readvance of active ice, followed by recession leading to the Disconnection and mass stagnation in the Upper Connecticut Basin as marked by Scabby Terrain and stagnant ice deposits below the T4 margin. Thus, it is suggested that the readvance described by Thompson et al, took place in conjunction with ice streams extending predominantly southward from the Memphremagog lobe, and perhaps as well but less so from the Champlain lobe’s Lamoille sub-lobe, followed by ice sheet lowering leading to en mass stagnation.
Again, the purple line and orange shading on the above map represent the ice mass which stagnated en masse following the readvance. This map suggests that the ice mass associated with the White Mountain Moraine System and subsequent en mass stagnation extended southward to the Bradford area where the Connecticut Basin is narrowed by uplands in both Vermont and New Hampshire, and where the VCGI evidence suggests an ice margin and associated outwash plain graded to a Lake Hitchcock delta. Stewart and MacClintock’s surficial geology tab shows a “moraine” just up valley from Bradford in the Waits River drainage, near South Corinth, which is mapped on VCGI as Scabby Terrain. A “pebbly sand” terrace deposit which may be an outwash plain is shown on the State map as extending downgradient from the South Corinth “moraine,” plausibly grading into a deltaic sand deposit at an elevation of about 720 feet(219 m) which corresponds with Lake Hitchcock.
The lighter, pale blue shading on the above map represents Lake Winooski which formed at T4 time, which was associated with Disconnection of ice masses in multiple deep valleys on the west side of the Lake.
The White Mountain Morainic System readvance here interpreted as correlated with the T3 and T4 margins suggests possible readvances associated with the Dixville moraine and an older, higher, but as yet undetermined ice margin in Quebec, the Rutland and Benninton “moraines,” the T1-12 ice margin positions of De Simone and La Fleur, and reported readvance evidence in the Winooski Basin by Larsen, Wright, and others. However, this assumes that the entire T3-T4 margin behaved uniformly across the region which may not be the case. Again, De Simone and La Fleur specifically note that they did not identify any readvance evidence.
Thompson et al in their review of previous literature, and as well in other published reports regarding New Hampshire surficial geology, make reference to a long simmering debate in New Hampshire, and more specifically the Connecticut Basin, about whether the recession of the ice sheet in this area took place by en masse stagnation versus systematic progressive recession of a well-defined ice margin. The interpretation given here suggests a combination of both of these ice margin types and conditions, with recession of an active ice margin associated with the upper trace of the WMMS giving way to en masse stagnation.
Footnotes: