The physiography of the eastern flank of the northeastern Champlain Basin, generally north of the Lamoille Basin, includes irregular foothill terrain with relatively substantial topographic relief, along the steep western flank of the Green Mountains. This physiography favored a relatively unique ice margin environment and therefore distinctive “Style,” whereby the ice sheet margins were relatively compressed into a narrow zone in the foothills and against the relatively steep mountain flank which favored erosion along the active ice margin, resulting in numerous deep and substantial Bedrock Grooves. A variety of ice margin features document the ice margins in this area, but Bedrock Grooves are the major features. In general, the Grooves formed in linear weakness zones in the bedrock.
Bedrock Grooves are especially numerous and prominent along the T6 800-900 foot(244 – 274 m) ice margin, much less so at the older and higher levels. This may be explained by and attributed to the increasing amounts of meltwater at lower levels, or perhaps by other explanations.
The following gives an overview of the four Locales along the flank of the basin, beginning with the northernmost near the Quebec border and progressing southward.
a. Locale CV1: Lucas, Stanhope, Loveland, and Guillmettes Pond sub-Basins
This Locale includes four small drainage basins, all tributary to the Lower Missisquoi Basin, immediately south of the Canadian Border, on the south side of the Lower Missisquoi Basin, on the northwest flank of Jay Peak. Ice sheet margins in this area would be expected to abut against the mountain front resulting in southward drainage along the mountain front, marked in favorable locations by erosion features and as well by stagnant ice deposits and other features, which is in fact is the case.
The VCGI map below gives an overview of this Locale:
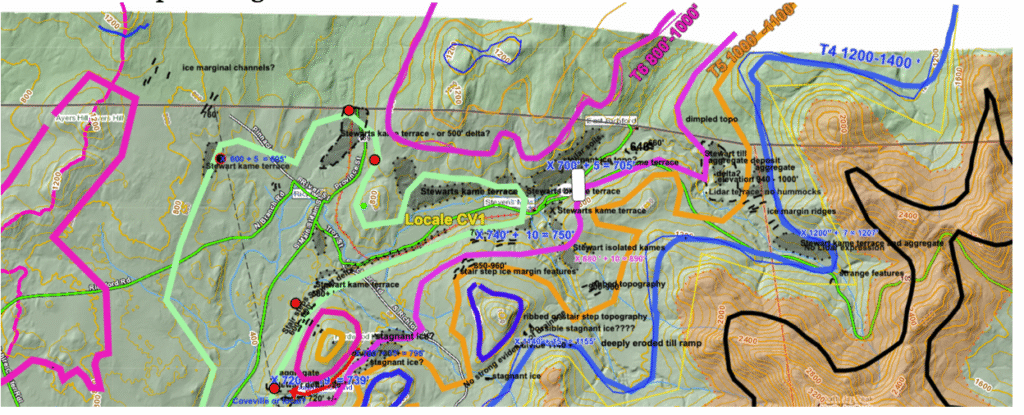
Markings are as previously described, with ochre color representing terrain above 1600 feet, the heavy black line as the 2000 foot(610 m)contour, and the T4, T5, T6, and T7 ice margins, as previously explained. The Lower Missisquoi River occupies the Basin floor near the villages of Stevens Mills, Richford, and East Richford. The Canadian Border is near the northern boundary of the VCGI map area, as marked by the thin line extending through East Richford.
In as much as the geologic interpretations are not legible at this scale, the following gives enlarged screen shots and explanations for each of the four sub-Basins in Locale CV1.
- Lucas Brook
This screen shot shows a variety of features, including the following, proceeding from older, higher to younger and lower:
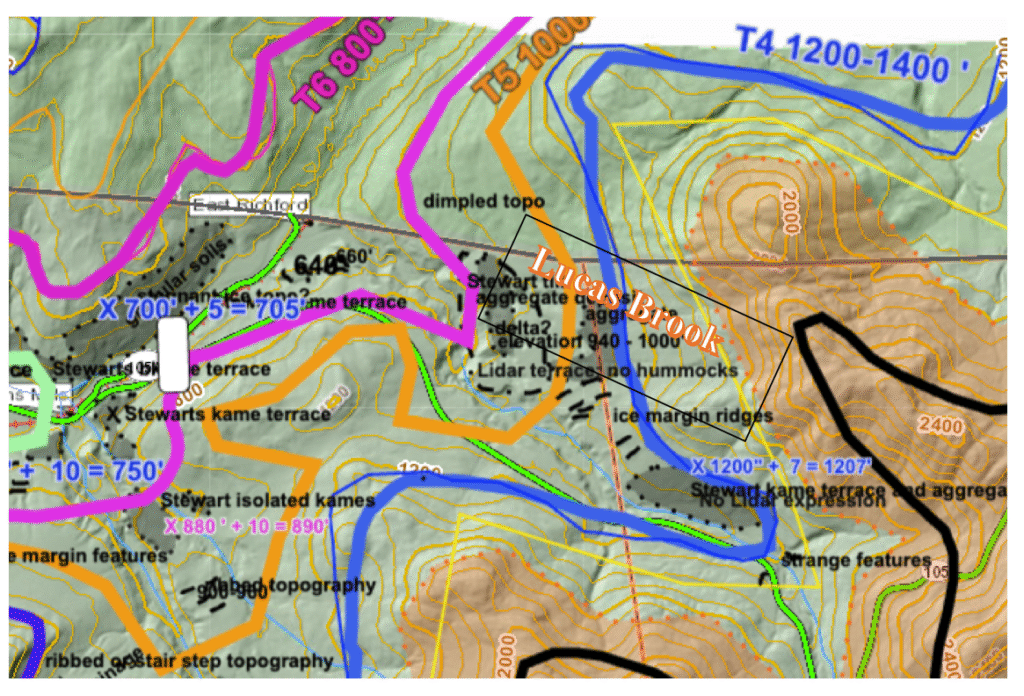
- “Strange features:” Most evident on enlarged LiDAR imagery, this area shows a variety of humanoid “disturbance” but as well shows ridge segments in an area mapped on the State surficial geology map as till ground moraine. These segments may represent erosional remnants of a very small morainic ridge or perhaps a protalus rampart at an elevation range from about 1200 – 1280 feet.
- Just below the T4 ice margin is a stagnant ice deposit, marked by the shaded area on the VCGI map. This feature exhibits constructional topography but not typical, strong, or obvious kame and kettle topography.
- Just below this deposit are a series of six transverse ridges, up to about 1/3 mile in length and apparently about 4-5 feet in height, identified as “ice margin ridges” on the VCGI map. Again, these are in an area mapped on the State map as till. These ridges are believed to mark the receding ice margin but the mechanics of formation remain uncertain.
- At an elevation between the T4 and T5, and T5 and T6 ice margins are two terraced deposits as evident by topographic contours and LiDAR imagery, indicated as till on the State map, but including granular material on the aggregate and sewage favorability tabs. These are regarded as ice margin features, possibly kame terraces or kame deltas.
- Along the Missisquoi Valley floor, just below the juncture of Lucas Brook, is a stagnant ice deposit, as shown on the State map, and as well supported by other VCGI tabs attributed to the T6 ice margin.
Taken together, these features on Lucas Brook can be regarded as supporting the identification of ice margins at discrete levels as indicated, but more generally suggest a progressive lowering of the ice sheet and recession of the margin, again “like rings on a slowly draining “Bath Tub”,” indicating a steady, incremental lowering of the ice surface and retreat of the ice margin across theT4-T6 range of the Lobate Phase history.
2. Stanhope Brook

The details of this area are similar, though not identical, to those in Lucas Brook, and are not repeated here. However, the divide on the western side of the basin with Loveland Basin is noteworthy. A small area of uneven constructional topography as evident on enlarged LiDAR imagery indicates small hummocks(?) of gravel, with gravel excavation pits, suggesting possible kamic deposits. Further, the soil sewage favorability map shows more granular and permeable soils on the walls of Stanhope Brook Basin, extending southwestward into the saddle divide with Loveland Brook. These observations support the ice margin close to the T4 level and time extending across the divide, but whether or not this included free water drainage whereby this saddle might be referred to a Bedrock Groove is unclear. Nevertheless, LiDAR imagery shows topography which would be consistent with such drainage. This area clearly would require further field examination to better establish the nature of the ice margin in this area.
3. Loveland Brook
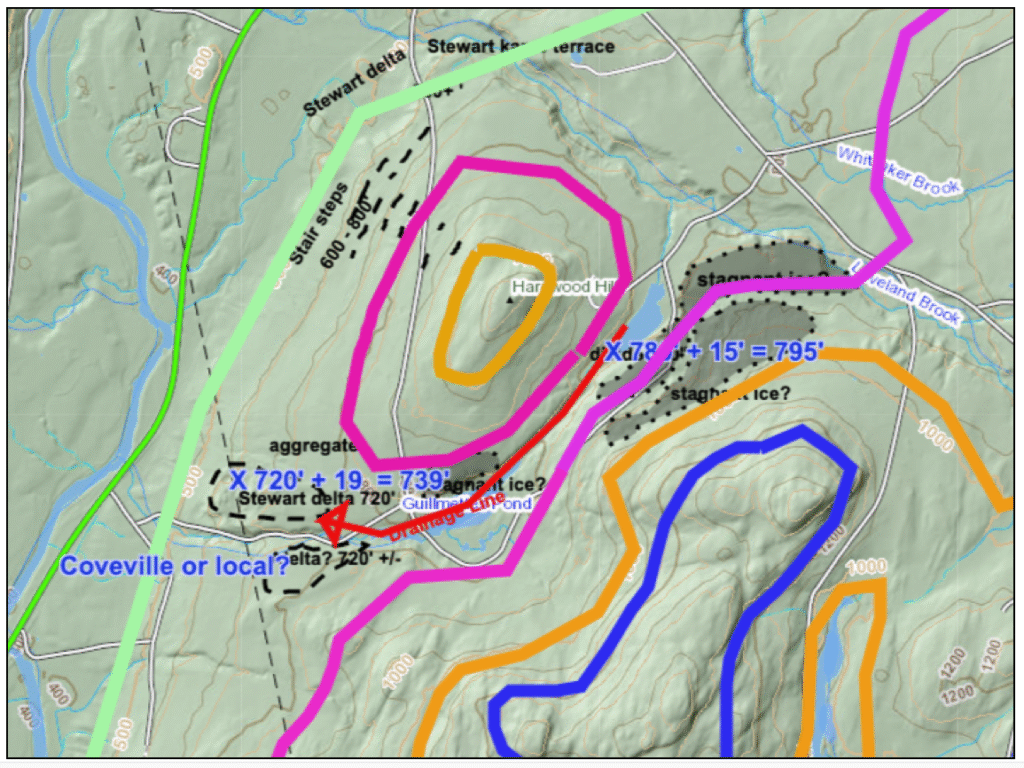
The significance of this area pertains to features in two locations, one in the divide area southeast of Hardwood Hill and the other on the northwest flank of Hardwood Hill. The topographic contours show Hardwood Hill as a bedrock knob, separated from the mountain side, as shown on the above topographic map, with a drainage divide at an elevation of 780 feet which separates Loveland Brook basin from a neighboring basin to the southwest.
A Drainage Line(red arrow) is marked, extending across the divide, in a pronounced, narrow, linear groove in which Guillmettes Pond and another unnamed pond are located. This is interpreted as a Bedrock Groove eroded by meltwater drainage along the T6 ice margin. The floor of the groove ranges in elevation from about 760 feet to slightly higher, mostly sloping southwestward, with a divide slightly above 760 feet. Stewart mapped the terrain in this area as glacial till ground moraine. Whether or not deposits associated with drainage are present is unknown.
On the upgradient side of the groove Stewart mapped a small kame terrace. LiDAR imagery indicates another small deposit likely to be a stagnant ice deposit is also present. Also, a stagnant ice deposit at the 800 foot(244 m) level is identified near Guillmettes Pond The groove extends downgradient in the southwesterly direction across the divide, to several deposits, including an accompanying Gilbert-type delta-like deposit(mapped by Stewart and MacClintock as a delta), which is supported by LiDAR and the aggregate tab on VCGI. LiDAR imagery shows sand or gravel excavation in this deposit and also suggests hummocky terrain possibly indicative of stagnant ice. Thus, this may be a kame delta deposit. If these features in fact are deltaic, a ponded water level at a local elevation of about 720 feet, and adjusted elevation of about 739 feet is indicated. This is above the level of Fort Ann. As indicated on the map, this feature was considered to possibly represent Coveville Lake Vermont, but is now regarded as a local proglacial water body.
The northwest flank of Hardwood Hill is mantled by till ground moraine as mapped by Stewart and MacClintock, per a VCGI tab. The maps below shows this area from VCGI in LiDAR “hillshade mode”( left) and in LiDAR “slope angle mode”(right):
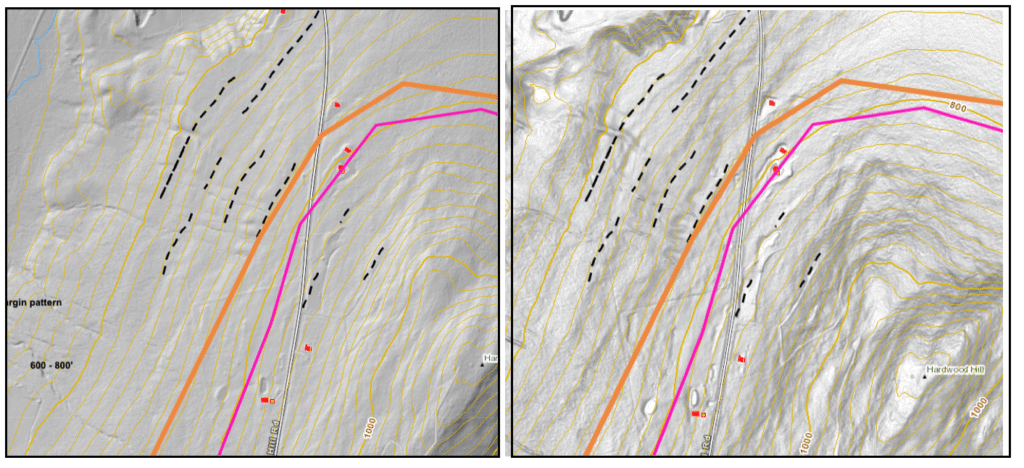
The LiDAR imagery obviously picks up humanoid features such as roads, ponds etc. The dashed lines mark slight topographic benches on the hillside. These are interpreted as “stair step” features marking the ice margin recession from about 900 feet to 600 feet local elevations, being slightly more pronounced at the 840 foot(256 m) level. The LiDAR imagery shows tonal difference, reflecting changes in slope with the benches in lighter grey and separating risers in darker grey. The LiDAR imagery also shows textural differences, with a “sand paper texture. ” This textural difference is more evident at larger magnification as shown below:
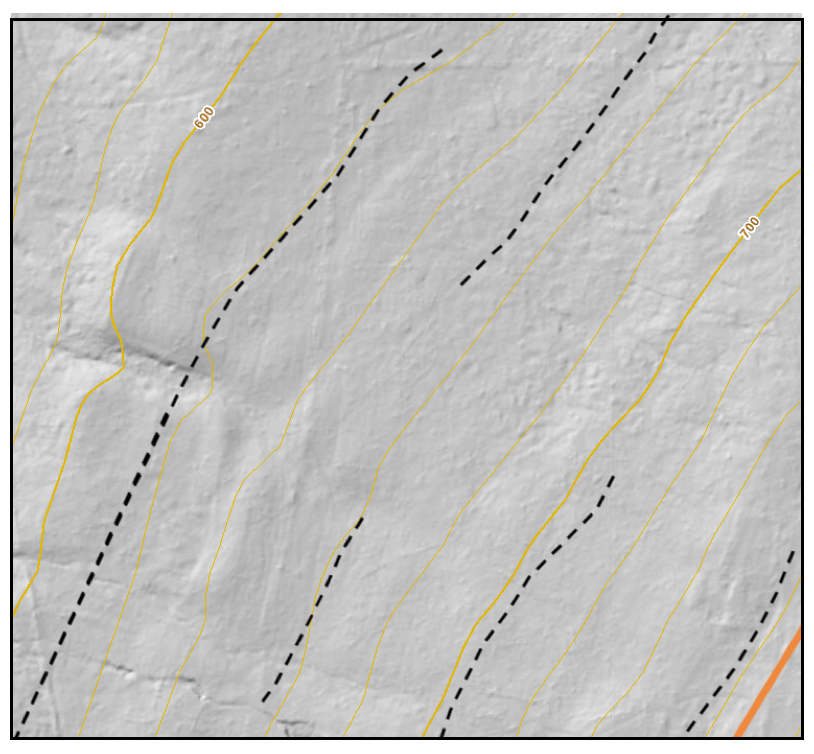
The explanation for this LiDAR signal is uncertain. It may reflect(both figuratively and literally!) the actual textural nature of till with included larger erratics. In many locations in Vermont, such sand paper texture on LiDAR imagery in ground moraine gives way to a smoother texture associated with stagnant ice and other fluvial deposits, which is believed to reflect the different LiDAR signatures of till versus water formed deposits. However, the matter of LiDAR signals as such deserves further study.
b. Locale CV2: Trout River Basin
The Trout River Basin extends southward along the flank of the Green Mountains, across a divide with the North Branch Lamoille River Basin near Belvidere Pond in Locale L5, as shown on the following map:
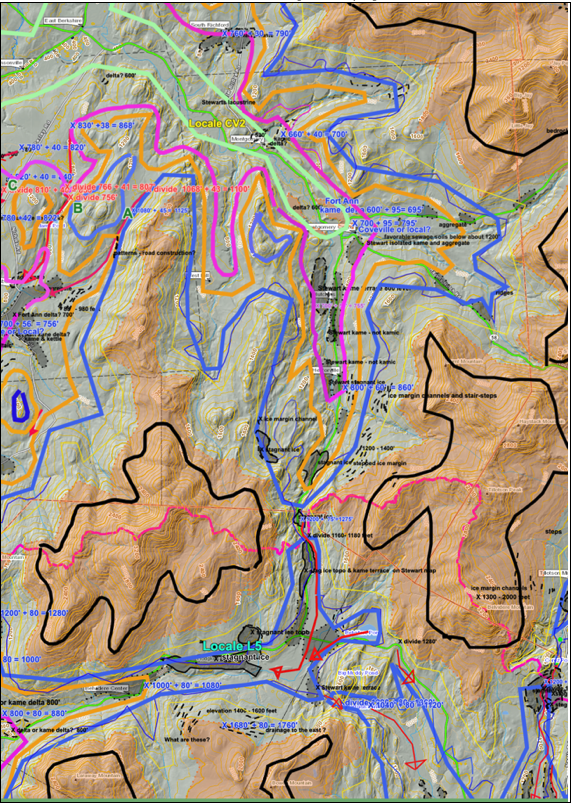
Ice Marginal Channels and stair-steps in the southern, headwater portion of this Locale and as well in the adjoining Lamoille Locale L5 to the south are numerous and very impressive, documenting the progressive recession of the ice sheet from local elevations of about 2200 feet to about 800 feet, and clearly defining receding ice lobes in both Trout River Basin and North Branch Lamoille Basins.
As shown, stagnant ice deposits mark the T4 1200-1400 foot(366 – 427 m) level on both sides of the divide, indicating commingling of ice across the divide, which is at a local elevation of 1160-1180 feet(354 – 360 m), adjusted elevation 1235-1255 feet(376 – 383 m). The State surficial map identifies these as kame terraces and isolated kames. LiDAR imagery shows considerable kamic topography.
Detailed LiDAR imagery suggests drainage southward across the divide from the stagnant ice deposit on the north side of the divide. The red arrow at the divide marks a Drainage Line which originates within the stagnant ice deposit on the north side, then crosses the divide, and extends southward in a broad alluvial channel and possibly as well on the surface of kame terrace deposits, suggesting southward drainage of meltwater across the divide at T4 1200 foot(366 m) time. Downgradient, this Drainage Line occupies and forms a flat floored drainage trough in the upper reaches of the North Branch Lamoille Basin.
As in Locale L5 in the North Branch Lamoille Basin, multiple Ice Marginal Channels and closely spaced valley fill stagnant ice deposits along the Trout River Basin floor north of the divide in Locale CV2 indicate the progressive lowering of the ice sheet and northward recession of the margin for shrinking ice lobes at the T4 1200-1400(366 -427 m), T5 1000 foot(305 m), and T6 800-900 foot(244 – 274 m)elevations as marked on the Locale CV2 map – again, the progressive incremental rings on a draining “Bath Tub” story. The older, higher stagnant ice deposits tend to be hummocky, in contrast to the lower deposits which tend to include flat topped surfaces. For example, the T6 ice margin at an elevation of about 800-900 feet is identified on the State map in part as an isolated kame and in part as a kame terrace. LiDAR imagery shows flat terrace-like portions which may be eroded remnants or may instead be portions of the stagnant ice deposit which are bounded by ice blocks. Alternatively, these flat portions may represent localized ponding, essentially as kame delta features, or some combination of all of these. The possible kame delta portions are at elevations which likely represent local upland water bodies confined to this basin.
Further down valley, in the vicinities of Montgomery and Montgomery Center are stagnant ice deposits with much more substantial, flat terraced portions. These flat portions are so large, mostly without kamic features, as to lead to the interpretation that these are kame deltas, but this is a subjective judgement. A single isolated depression with ponded water suggests the presence of a remnant ice block, suggestive of the association of the deposit with stagnant ice. Obviously, field work in this area is desirable for confirmation of details, but in any case, the T7 ice margin is indicated, with the adjusted elevation of these kame deltaic surfaces at about 700 feet, which is close to and may correlate with the Fort Ann Lake Vermont level. In fact, the T7 margin in many places is associated with Fort Ann deposits, representing the progressive northward opening of a narrow water body along the “Disaggregated” ice margin into Quebec, in time leading to the Champlain Sea.
Interestingly, the T7 margin is immediately downvalley from and adjacent to stagnant ice deposits representing older, higher features, including kamic, kame terrace, and/or kame delta portions at adjusted elevations close to 800 feet which corresponds with the T6 ice margin. This again reflects the progressive stair-step retreat of the ice margin in its ““Bath Tub”.
c. Locale CV3 Tyler Branch Basin
Tyler Branch is the next drainage basin to the south along the Green Mountain front, as shown on the Locale location map. Drainage in the upper reaches of this basin bifurcates with Tyler Branch in the northern portion, with the village of Gilbert’s Tannery and Bogue Branch in the southern portion. The VCGI map below shows features in this basin for this Locale:
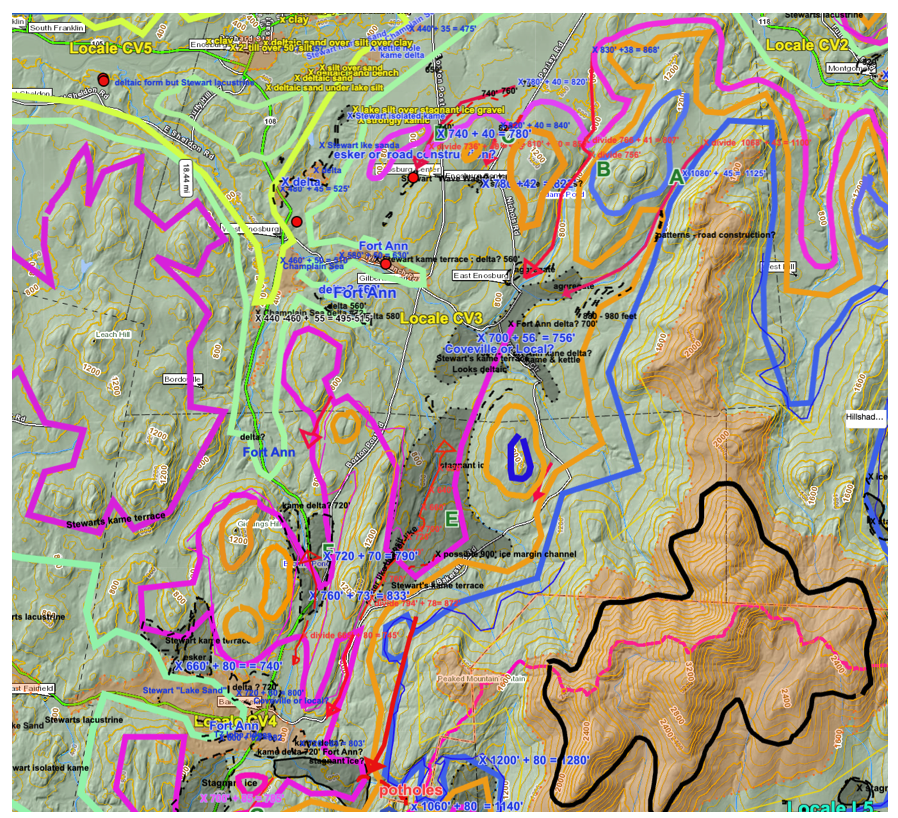
Bedrock Grooves are a major feature in this Locale, as a characteristic Style of the ice margins in the northern Champlain Basin in the foothills and along the relatively steep flank of the Green Mountain front range. Bedrock Grooves in this Locale are marked by Drainage Lines, as shown by red arrows on VCGI in well defined, distinct channels which extend across local divides. The presence of such pronounced channels, especially at and across divides, is an indication that glacial meltwater drainage was involved in the formation of these features. In addition, as discussed below, many of the Grooves are associated with ice margin features which further supports this interpretation. Again, these Grooves likely reflect structural weakness lineations in the bedrock terrain, which were preferentially enhanced by meltwater drainage at elevations corresponding to the receding ice margin.
Multiple Grooves reflect the presence of an ice lobe in Tyler Basin, with interfluvial meltwater flow across divides into the Basin from the north and exiting the Basin to the south.
To facilitate the following discussion of the features in this Locale, individual Grooves are labeled by green colored letters on VCGI, per the following:
Grooves A and B: Grooves A and B are channel-like features that extend across the divides as shown. Groove A is the highest and likely oldest of the Bedrock Grooves on the north side of the Basin. No ice margin features such as stagnant ice deposits are associated with these Grooves. However, as discussed previously in Locale CV2, evidence in the Trout River Basin documents ice masses at and below the T4 1200-1400 foot(366 – 427 m) ice margin level, which likely served as the meltwater source for drainage across the divide resulting in Grooves A and B.
Both Grooves A and B extend downgradient toward and into surficial deposits identified as kame terrace on the State map, but with flat top surfaces consistent with deltaic features at an elevation of about 750 feet, including a closed topographic kettle-like basin. These deposits are regarded as kame deltas, which corresponds with the T6 ice margin and a local ponding level.
Groove C and D: As shown, Grooves C and D are associated with a stagnant ice deposit related to the T6 ice margin. Groove D grades into a deposit identified as “wave washed till” on the State map, at an elevation corresponding with the local level.
Groove E and F: These Grooves represent meltwater drainage from the T6 ice margin, associated with Drainage Lines which extend southward across divides into another low area in the Bakersfield area, in Locale CV4. In the immediate vicinity of the divide at Groove E, LiDAR imagery suggests a mini-esker-like deposit, which likely is associated with the more substantial stagnant ice deposit nearby to the north. The presence of the esker in the Groove, at the divide, supports the interpretation of the Grooves as meltwater erosion channels. As discussed in Locale CV 4, the southerly directed drainage associated with these Grooves is, again, associated with deposits at a local lake level, as discussed below.
On the western side of Locale CV3 are features associated with the T7 ice margin and the Fort Ann level, but these are not so well represented as to merit discussion. It is notable that the ice marginal features at this Locale represents primarily the T6 ice margin and T7 ice margins, with little evidence of the T 5 and T4 ice margins. This presumably indicates that the local terrain in this Locale was not favorable for the formation of features at these levels, as a matter of Styles. It is possible that the Bedrock Grooves were initiated at higher levels associated with these ice margins, and were subsequently deepened in T6 time.
d. Locale CV4: Black Creek near Bakersfield
Black Creek is a long, low tributary extending southeastward from the Missisquoi River across the foothills, with its headwaters near the Lamoille Valley, immediately south of Locale CV3 and north of Locale L6. Along most of Black Creek’s length Stewart and MacClintock mapped substantial silt-clay deposits, indicative of standing water(above the level of the Champlain Sea and therefore likely including Lake Fort Ann deposits). Near the Green Mountain front, Black Creek curves into higher elevations near Bakersfield, at this Locale.
As discussed above in the section of this report presenting calving ice margin features, it is noted that the evidence indicates that the ice margin recession in the Black Creek Basin indicates that caving likely occurred in this Basin in T7 time, as indicated by Ribbed Lacustrine, Headless Delta, and bouldery lacustrine deposits. Further, it is recognized that the Black Creek Basin was favorable for calving owing to its location and orientation, with sufficiently deep waters for calving. Locale CV4 is just upgradient from the calving margin on Black Creek.
Also, as discussed above, it is suggested that the kame delta deposits in the Bakersfield area are just downgradient from the Shattuck Mountain Pothole Tract, which may or may not be related to drainage in this Tract, depending on contrasting interpretations given by Cannon versus Wright. Locale CV4 is downgradient from the Tract.
And likewise, Locale CV4 may be part of the recessional history associated with the Ice Tongue Grooves at the mouth of the Lamoille Basin, which is just to the south of this Locale.
The following is the VCGI map for Locale CV4:
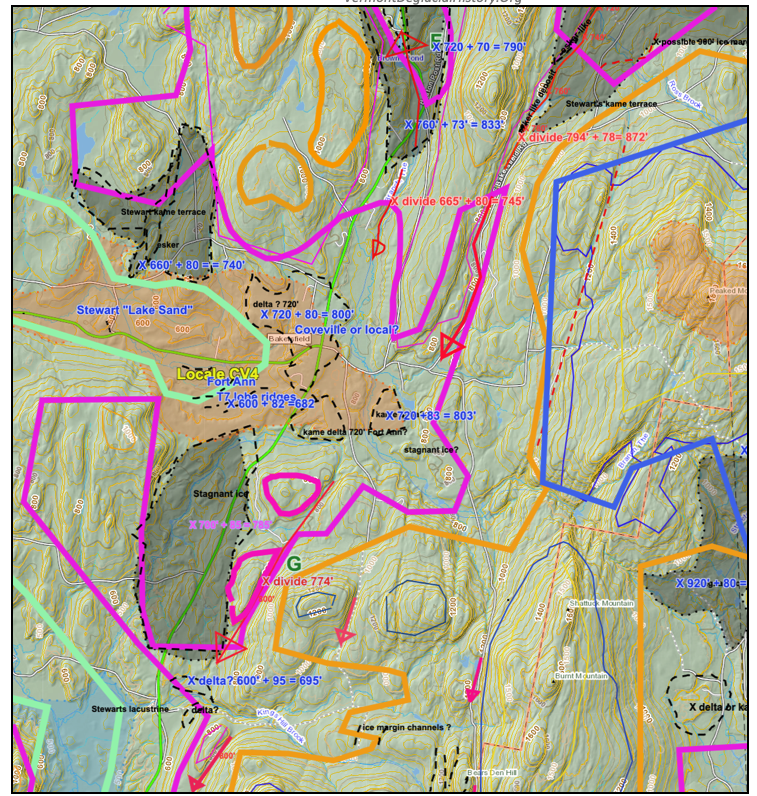
Two stagnant ice deposits, one generally north and one south of Bakersfield, mark the T6 800-900 foot(244 – 274 m) ice margin, with the margin following the topography at this level with finger-like extensions into the drainage ways associated with Bedrock Grooves. The two aforementioned Ice marginal grooves E and F to the north in Locale CV3 indicate drainage along the T6 ice margin from the north into the stagnant ice mass near Bakersfield and likewise, a Groove south of Bakersfield labeled G marks drainage out of the Bakersfield basin along this margin.
As shown on the State map, deltaic sand deposits are extensive in the Bakersfield area. The elevations of these deposits mark progressively lowering stairstep levels. The highest deltaic level, at the village of Bakersfield is at a local elevation of about 720 feet(219 m)(an adjusted elevation of 803 feet(245 m)), which corresponds with the T6 margin, and as shown is downgradient from Grooves E and F. It is likely that that these deltaic deposits were formed in ponded water by drainage from Grooves E and F along T6 ice margin. The elevation of these deltaic deposit likely corresponds with a local proglacial lake associated with the T6 ice margin.
West of Bakersfield, lower deltaic(?) deposits at a level corresponding with Lake Fort Ann show lobate patterns, which are interpreted as marking the frontal margin of the T7 600-700 foot(183 – 213 m) level ice lobe This deltaic deposit likely is an ice marginal, kame delta feature at an adjusted elevation of about 682 feet(208 m), which again corresponds with Lake Fort Ann.