The VCGI map for this Locale, which again extends over a long distance, is presented below in two screen shots, on the left for the portion of the VCGI map from the Rutland area to the Middlebury area, and on the right from Middlebury to the Burlington area:
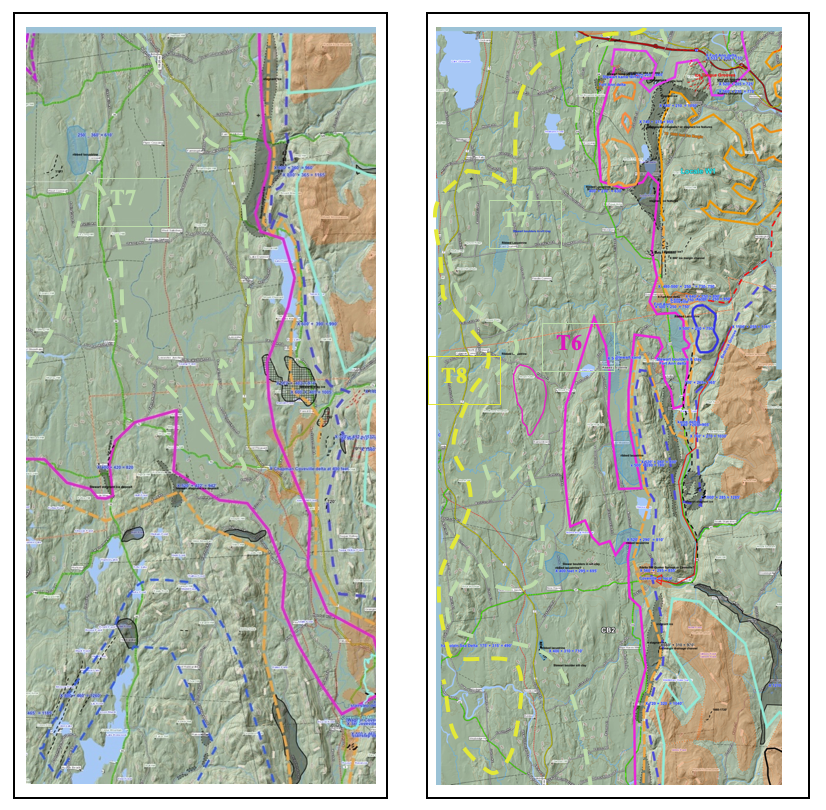
The VCGI maps shown here are not the latest interpretation, but give a general sense of the deglacial history as presently understood. As of the “final” (?) writing of this report, the T6 (maroon), T7 (sage green), and T8 (yellow) margins have been modified slightly from those shown above. The T6 -T8 margins are important as they relate to Coveville, Fort Ann Lake, and Champlain Sea strandlines and the initiation of calving. The delineation of these ice margins is challenging and uncertain, owing to their close spacing, especially with regard to both the step-down sequence in the foothills and the configuration of the receding margin of the ice lobe that occupied the floor of the Otter Creek Basin. More detailed mapping, including field mapping, in this area is needed and likely to lead to changes in the interpretations given here.
Locale CB2 overlaps with Locale CB1 at the mouth of the Vermont Valley and with Locale W1 at the mouth of the Winooski Basin. The above screen shots show the eastern margins of the Champlain Lobe: T3(turquoise), T4(blue), T5(orange), T6(maroon), T7(sage), and T8(yellow). Gray shaded areas designate stagnant ice deposits, and russet colored areas indicate both deltaic deposits and uplands above 1600 feet. The deltaic deposits which occur in close association with the T5 and T6 ice margins are predominantly kame deltas formed in close association and proximity with the ice margin. As noted above, the T3 margin in Locale CB2 extends along the foothills to the vicinity of Lincoln, north of which the T3 ice margin was in the Nunatak Phase marked by Ice Marginal Channels in the uplands.
The T4-T6 stagnant ice deposits in the foothills occur in close proximity, in a descending, terrace-like, step-down sequence of multiple levels, showing the progressive lowering of the Champlain lobe margin, which again makes it difficult to precisely demarcate and distinguish these margins. The same applies to these margins on the Otter Creek Basin floor. The proglacial lakes in this step-down sequence initially likely were local as controlled by the irregular terrain of the foothills in conjunction with local ice margin dams and outlets. The evidence suggests, as might be expected, that these local lakes had a very complex history related to the irregular terrain, local ponding, and changing outlets, which have not been mapped in the VCGI mapping. The T6 margin is associated with Coveville Lake Vermont. As discussed in the text, the lowering of Lake Vermont from the Coveville to the Fort Ann level was associated with calving of the ice margin in the Middlebury Bench, beginning in late T6 time and continuing in T7 time, with another phase of calving associated with the T8 ice margin along the Champlain Sea.
As noted above, until a late time in the VCGI mapping it was believed that the T7 margin only extended southward in the Champlain Basin to the Essex and Colchester area where two eskers at the T7 level are graded southward to a Fort Ann delta at the mouth of the Winooski Basin. It had then been thought that the T7 margin extended westward from the Essex /Colchester area, across the Basin toward New York as a calving margin. Similarly, the T8 margin had been mapped as restricted to the Missisquoi Basin. As discussed in the text above, this thinking fit with my then prevailing paradigm-ic bias about the general south to north recession of the ice margins through time. However, as discussed elsewhere herein , evidence was found indicating that the T7 and T8 ice margins extended further south than originally thought, as more substantial convex lobe in conjunction with calving.
The evidence for calving and its associated history is presented in detail in the main text of this report and is not repeated here, and in fact much of the evidence can not be seen on the above maps owing to scale limitations. The above CB2 map was drawn at an early time, before many of the calving features were recognized. Owing to the tediousness involved in creating VCGI maps for presentation here this particular map has not been updated from the most recent version of VCGI, but again the above map gives a general sense of the T6 – T8 ice margin positions.
As just suggested, the delineation of the receding ice margins for the ice mass which occupied the floor of the Otter Creek Basin is important, but challenging. As of the latest incarnation of interpretations I am beginning to see that the recession of the T4 – T8 ice margins was progressive, with intriguing but spotty evidence for these ice margins. The delineation of these ice margin needs further work. Perhaps rather than delineating ice margins as individual lines on a map it would be more correct to recognize, for example that T6 , T7, and T8 times would be better delineated as broad zones. The following is the “latest” VCGI mapping for a portion of the Otter Creek Basin (superceding a portion of the above VCGI map, generally in the region from Proctor to Vergennes. However, in writing this I recognize that this area is so intriguing that perhaps further study may result in additional modifications of this “picture.”
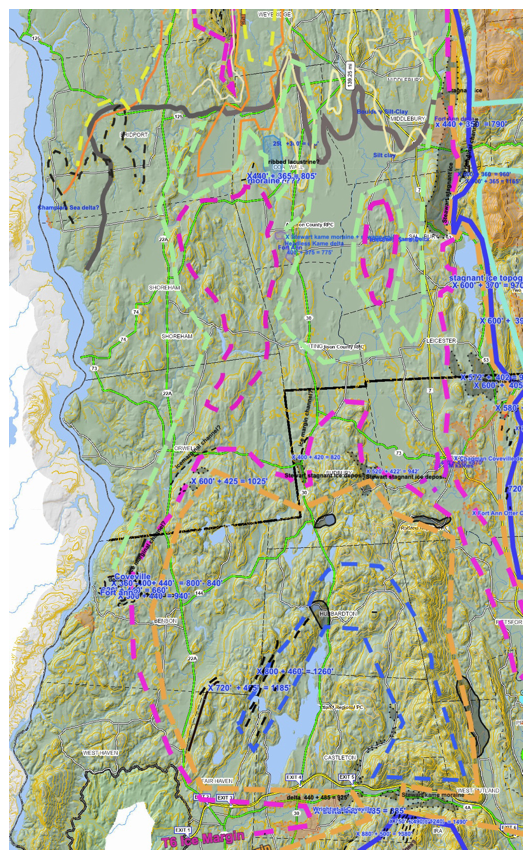
In presenting this map I would note the following:
- The T6 margin (maroon line) is drawn to extend southward to the Proctor area (just off the map) where the margin is marked by kame delta features at the Coveville level.
- In the Brandon area, Lidar imagery shows multiple arcuate ridges on the floor of the Otter Creek basin, which approximately correspond with kame moraine delineated on the Stuart and MacClintock map. These are likewise identified at T6 ice margin features. Thus, the T6 margin is represented by multiple features on the floor of the Otter Creek basin, representing a broad recessional zone within T6 time along a convex lobe. Also, Chapman and others have identified the Coveville delta at Brandon, which is closely associated with and fringing the T6 margin. Thus, these deltas are interpreted as kame deltas. Several sand or gravel pits are in this area, meriting study to determine if any collapse structures or other evidence of stagnant ice presence exists, in close association with deltaic deposits.
- The placement of the T6 margin, shown on the above map as extending across the floor of the Otter Creek Basin in the Brandon area raises the question as to the position of the T7 (sage green) margin. The T7 margin is identified at Delong Hill and West Salisbury features, including deltaic and stagnant ice deposits, at the Fort Ann level, interpreted as marking the initial development of a calving ice margin, which is slightly south of the boulder silt-clay deposit depicted on the State map. In the Cornwall to West Cornwall vicinity are ridge-like features identified on LiDAR which are preliminarily interpreted as possible moraine-like ice marginal features. The elevation of these ridges is between the T6 and T7 margins.
- The position of the T7 lobe tip on the floor of the basin is as yet uncertain. It is drawn on the above VCGI map as located between Cornwall-DeLong Hill-West Salisbury and Brandon, but thus far no specific evidence documenting this lobe tip position has been found.
- Finally, the linear “Ice Marginal Lines” on the Champlain Basin floor just northwest of Snake Mountain are interpreted as marking the T8 (yellow) margin, at the Champlain Sea, marine limit. These are inferred to have been associated with a calving ice margin. The thin orange colored line was drawn to trace the Champlain Sea marine limit strandline. The position of the T8 lobe tip on the floor of the Otter Creek basin is as yet uncertain. Champlain Sea deltaic deposits at Weybridge are inferred to be kame deltas associated with the T8 margin. Obviously any marking of the lobe tip on the basin floors may now be buried by later ponded water sediment.
Whereas all of these features and associated interpretations deserve further scrutiny, together they give a sense of the recessional history of an Otter Creek Basin lobe.
Footnotes