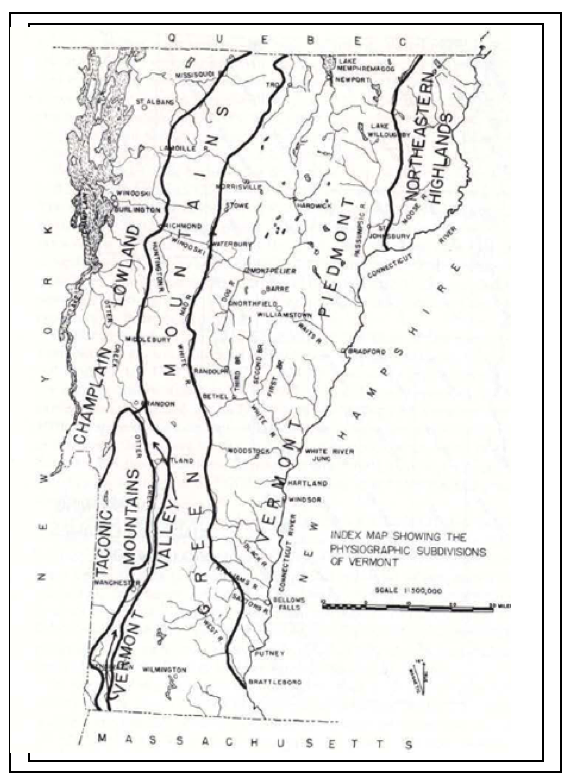
This Locale encompasses the southern Champlain Basin from the Massachusetts and New York borders northward to the northern end of the Vermont Valley in the Rutland and Proctor area. This Locale spans a range of time in the deglacial history, from T3 to early T6, with the T6 margin occurring in association with early Coveville Lake Vermont features. Before discussing VCGI findings it is helpful to first consider information on the physiography of the southern Champlain Basin and review previous research, per the following.
The map below 1 From online source: https://neiwpcc.org/program-partners/lcbp/ presented previously, gives a general overview perspective on physiography of the Champlain Basin, in particular headwater areas in this Locale. As can be seen on this map, the southern Champlain Basin bifurcates into two portions, specifically the lower Lake Champlain Basin floor and the higher Vermont Valley, the latter again a colloquial term for the relatively deep valley extending southward from the Rutland area to the Bennington area, separated from the main Champlain Valley to the west by the Taconic Mountains. The southernmost extent of the Vermont Valley is in the Hudson-Hoosic drainage basin, the divide between the Hudson and Champlain Basins in the Vermont Valley being near Manchester. The inset map above gives regional perspective, showing the relationship of the Basin to the Quebec and Ontario provinces to the north and to New York State to the west.

Stewart and MacClintock, 1969, Figure 3 likewise portrays the physiography of this area. Their map similarly shows the narrow Vermont Valley as an extension of the “Champlain Lowland,” between the Taconics and the Green Mountains.
De Simone and La Fleur(1985) 2 https://ottohmuller.com/nysga2ge/Files/1985/NYSGA%201985%20A10%20-%20Glacial%20Geology%20And%20History%20Of%20The%20Northern%20Hudson%20Basin,%20New%20York%20And%20Vermont.pdf reported on the surficial geologic deglacial history of the Champlain/Hudson divide area, in New York and southwestern Vermont. Their report presents a deglacial history, including portions of southern Vermont, which is remarkably similar and compatible with the findings found here. The authors do not use the terms Bath Tub Model or specifically suggest elevation as a guide. They delineate progressive ice margin positions based on ice margin features, but their ice margins generally follow physiography. Referring to the Taconic Highlands, which separate the Champlain-Hudson basin from the Vermont Valley, the authors state(page 87) under a heading entitled “Deglacial Style:”
Taconic Highland deglaciation was characterized by a thinning ice cover that exposed till-veneered hills and also by active ice tongues in those valleys oriented parallel to the direction of ice flow. Ice tongue margins retreated sporadically through intervals of rapid retreat, slow retreat, and halted retreat. Topographic control determined the location of distinctive kame moraine sediment bands along the base of moderate to high relief slopes against which an ice tongue impinged for a significant interval. Minor kame moraine segments and isolated kames and eskers record pauses of shorter duration. Reset-type fan or deltaic sediment was deposited from retreating ice margins into local impoundments temporarily dammed by sediment and/or ice. Outwash sequences were deposited in more freely drained valleys. Heads of outwash are recognized on the basis of morphology, profiles of depositional gradients, and textural relationships in the sediment. Abandonment of ice from a valley segment was topographically controlled and had no necessary effect on the retreat of adjacent ice tongues. Hence, continuous stagnation zones were not uniformly present along the ice front.
This quote is provided here: a) as it supports the usage of the Bath Tub Model, suggesting that the ice margins 1-12 identified by the authors were formed by sufficiently thin ice with ice margins which conformed with the terrain; and b) describes the step-down sequence as was common across Vermont. These ice margins correspond with the T3 and T 4 margins mapped on VCGI.
Further, they state(page 88):
No stratigraphic evidence for a major readvance … was observed. All reconstructed ice margins are apparently recessional and record intervals of slowed or halted retreat. Ice positions 1 and 10 approximately coincide, respectively, with the limits of the Shelburne and Burlington drift borders in the Vermont Valley. There is no evidence that these are readvance positions(Larsen 1972; Wagner et al 1972; DeSimone 1985). Minor ice surges probably occurred as indicated at Clifton Park(Dineen et al 1983) and in the Argyle valley(DeSimone 1985).
This quote is significant, in that as discussed elsewhere herein, the evidence indicates that the T3 and T4 margins may correlate with the White Mountain Morainic System in New Hampshire which reportedly was associated with a readvance. However, as noted, glaciers and ice sheets commonly show localized portions which are stable, advancing, and retreating, at the same time, and thus the absence of advance evidence at the equivalent T4 time in New York is not necessarily problematical.
DeSimone and La Fleur’s Figure 1, as shown below, depicts their twelve ice margin positions in the area of the Hudson-Champlain divide, extending into southern Vermont in the Taconics and Vermont Valley area:
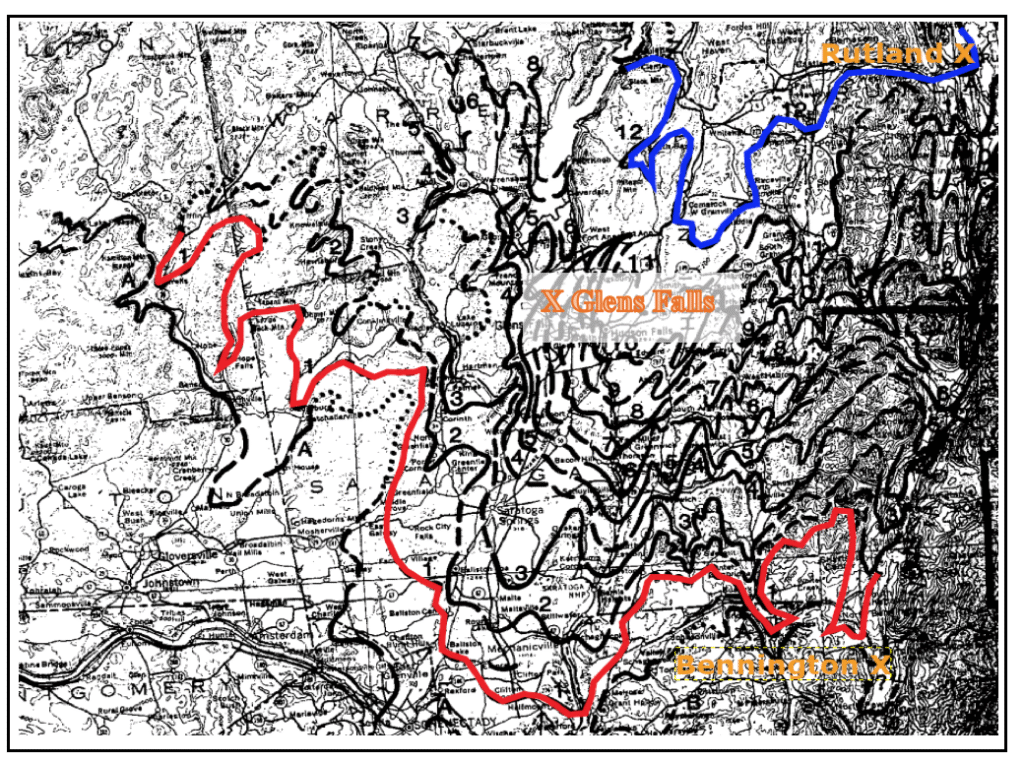
For location purposes, Glens Falls, New York, which is close to the Hudson/Champlain drainage divide is located near the center of their map area.
The details in Vermont are difficult to read owing to map scale compression. Their positions 1 and 12 are highlighted here in red and blue, respectively, with Rutland and Bennington locations marked. As can be seen on their map, their position 1 shows a lobe of the ice sheet occupying the Vermont Valley in the Bennington area, followed by progressive northward recession in the Valley to position 12 in the Rutland area. Their multiple positions between their positions 1 and 12 suggest a recessive pattern which is consistent with the evidence indicating a step-down recession in the Vermont Valley(and elsewhere in Vermont in as much as step-down recession appears to have been a universal pattern of recession in Vermont more generally). This ice lobe in the Vermont Valley is separated from the main Champlain Basin ice lobe by the Taconic Mountains with the ice sheet’s progressively younger positions receding northward, at lower elevations around the nose of the Taconics. Again, positions 1 and 12 are correlated with ice margins T3 and T4 of this VCGI report.
DeSimone and La Fleur also identify local and regional proglacial lakes, with the receding ice margin uncovering progressively lower outlets allowing for the northward expansion of lakes, notably leading to proglacial Lake Vermont extending across the Hudson/Champlain divide. This association between the ice margins and proglacial lakes likewise is similar to the step-down pattern found many places in Vermont. The authors(page 104) specifically correlate their ice margin position 12 with moraines mapped by Stewart and MacClintock(1969) at Castleton and West Rutland, which they believed predated Lake Coveville in Vermont.
Reference to the Shelburne and Burlington drifts by DeSimone and La Fleur in the quote above pertains to Stewart and MacClintock’s mapping. As previously stated, S & M identified three drift sheets in Vermont, as shown on the map below, based on till fabric and striations, including in order from oldest to youngest:
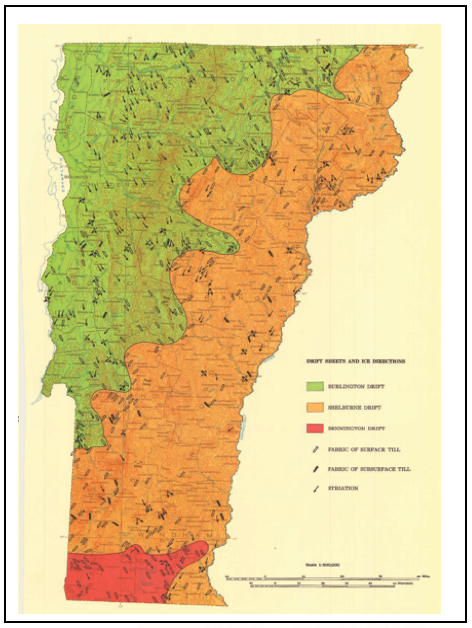
- Bennington drift – covering all of Vermont and New England with ice flow from the northwest to southeast.
- Shelburne drift – covering all of Vermont except the Bennington-Brattleboro area, with ice flow from the NE to the southwest.
- Burlington drift – covering parts of the Champlain Basin, with ice flow from the northwest.
The last of the above quoted passages is essentially indicating that in their opinion, based on their findings in New York and southwestern Vermont, Stewart and MacClintock’s three drift sheets may represent a single glaciation, which fits with the Bath Tub Model as explained below.
The following map is Stewart and MacClintock’s Figure 13 from their State report:
S & M’s intent for this map was to show the directional evidence supporting their interpretation of separate drift sheets, but as can be seen, S & M’s Figure 13 could alternatively be explained by, and fit with, a Bath Tub Model, as becomes more apparent by a closer inspection of the location of till fabric and striation sites in relation to the physiography. In any case, S & M did not delineate deglacial ice margins in Vermont.
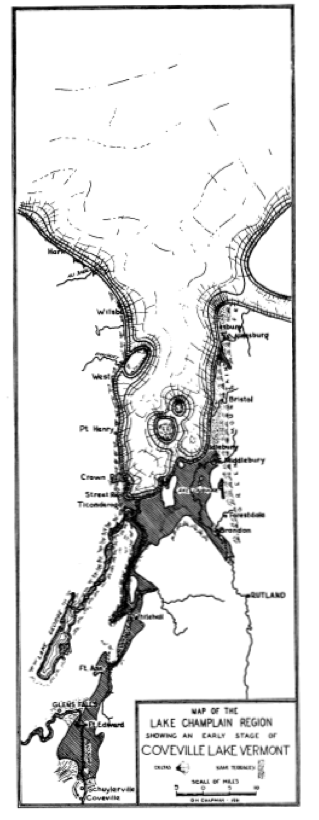
With regard to the proglacial water history in the Champlain Basin, as previously discussed, Chapman presented strandline profiles showing the Coveville and Fort Ann stages of Lake Vermont, and multiple Champlain Sea levels, and as well presented maps showing the shorelines of these water levels. The following map shows one of Chapman’s illustrations, showing the Coveville Lake Vermont strandline and an ice margin in early Coveville time. As can be seen, Chapman’s map shows Coveville Lake Vermont extending into the northern reaches of the Vermont Valley in the CB1 Locale. and continuing around the nose of the Taconics where it continues further southward in the main Champlain Basin lowland.
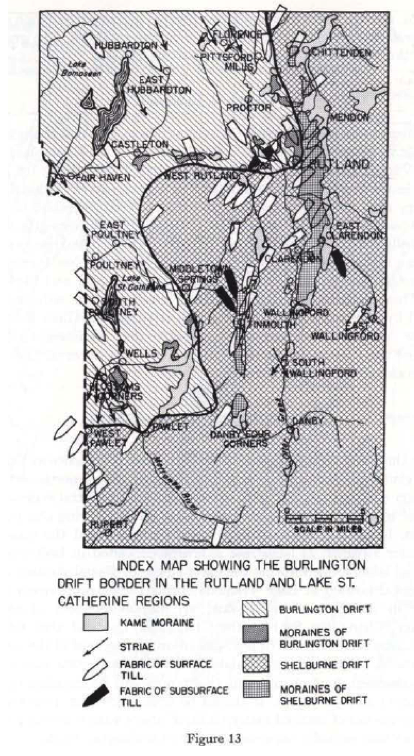
More recent, elegant, and detailed mapping of regional proglacial lakes in Vermont by Springston, Wright, and Van Hoesen, 2020,3 Springston, G., Wright, S., and Van Hoesen, J., 2020, Major Glacial Lakes and the Champlain Sea, Vermont: Vermont Geological Survey Miscellaneous Publication VGSM2020-1, Scale 1:250,000. https://anrgeodata.vermont.gov/datasets/3ac85a78f51e48a49914c28608a04895_187/explore?location=43.608738%2C-73.159787%2C is presented on an online interactive map. Strandline profiles and the basis for strandline identification are not given. The following screen shots from their map show their Coveville Lake Vermont(left), and a closeup(right) showing the Coveville strandline in the Proctor and Castleton areas, similar to Chapman’s mapping:
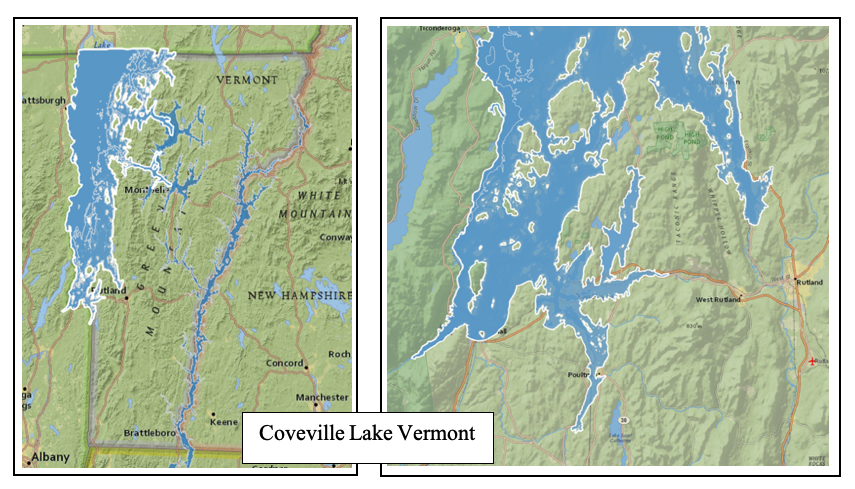
The close up screen shot on the right in the Rutland area shows an embayment from the west, up the Castleton Valley, to the vicinity of the village of Castleton, where S & M and VCGI mapping indicate a delta, likely marking the Coveville level. The screen shot also shows Lake Coveville extending up the Otter Creek Valley into the Vermont Valley near Proctor, just north of Rutland, likewise identified by S & M and VCGI mapping as marked by a Coveville delta.
c. VCGI Mapping for Locale CB1
With the preceding information regarding the physiography and previous studies in this Locale, we can now turn to the VCGI mapping. The following is a composite screen shot for Locale CB1 from the VCGI map of the Vermont Valley and northern Taconics, which encompasses the T3 – early T6 ice margins. The T3 ice margin is marked by the turquoise green colored line, the T4 margin by the blue colored line, the T5 by the orange colored line, and early T6 by the maroon colored line. 4 With the preceding information regarding the physiography and previous studies in this Locale, we can now turn to the VCGI mapping. The following is a composite screen shot for Locale CB1 from the VCGI map of the Vermont Valley and northern Taconics, which encompasses the T3 – early T6 ice margins. The T3 ice margin is marked by the turquoise green colored line, the T4 margin by the blue colored line, the T5 by the orange colored line, and early T6 by the maroon colored line.
This is a composite of multiple VCGI screenshots
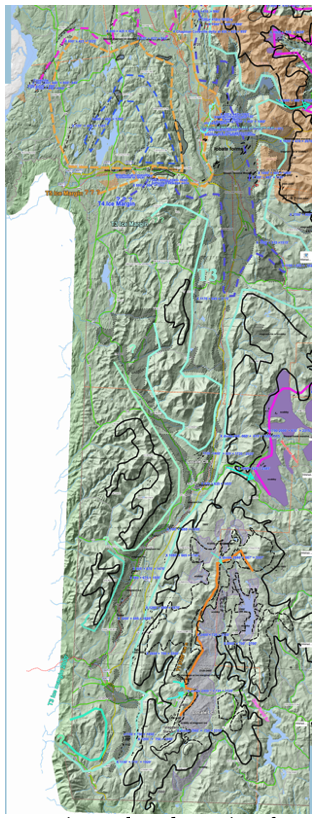
As such, it is a long and narrow map. As can be seen on the map, the T3 ice margin(turquoise green line) delineates the margin of a long narrow lobe in the Vermont Valley. The head of this lobe is marked by a substantial stagnant ice deposit at Bennington, at the 2000 foot(610 m) adjusted elevation level. Lateral margins of this T3 lobe are marked by Ice Marginal Channels, which are numerous, documenting the margin of the T3 lobe in the late Nunatak and early Lobate Phase. The eastern T3 lateral margin extends northward from the Bennington area to the Rutland area and beyond, as far north as the Lincoln area(in Locale CB2), north of which the T3 margin is above the Lobate Phase and marked by Ice Marginal Channels in the Nunatak Phase. Prior to T3 time, this lobe, at a higher level, served to feed downgradient ice masses in the Connecticut Basin in T1 and T2 times.
On the floor of the Vermont Valley between Bennington and Rutland are numerous, discontinuous stagnant ice deposits, extending over a distance of more than 60 miles, indicating the progressive step-down recession of the Vermont Valley lobe tip, from a T3 elevation of about 2000 feet in the Bennington area to an early T6 elevation of about 800-900 feet in the Rutland area. 5 Again, this step-down progression is similar to the mapping by De Simone and La Fleur. Stewart and MacClintock(1969) identify the Rutland and Bennington deposits as moraines, which In their report they describe along with their St Johnsbury moraine, as being exceptional, the only moraines they found in Vermont. The Bennington and Rutland “moraines” are not identified and so named as such here in order to avoid terminology issuesw, but VCGI mapping confirms these as substantial and significant deposits. These deposits occur at progressively lower elevations in the Lobate Phase, northward on the floor of the Vermont Valley, indicating progressive, incremental recession through time, in a manner likened to “multiple closely spaced rings in a slowly draining ‘Bath Tub’.” Numerous eskers occur on the floor of the Vermont Valley at multiple elevations. In general, these have ridge peak elevations which occur at progressively lower elevations northward, and likewise individual eskers have peak elevations which are graded northward, suggesting progressive northward recession of multiple stagnant ice margins with northward drainage as controlled by the regional gradient of the floor of the Vermont Valley. Whereas, as noted above, a divide exists in the Manchester area separating the Champlain Basin drainage from the Hudson-Hoosic Basin, the VCGI mapping does not identify evidence of discrete, distinct glacial or drainage features associated with this divide. However, it is possible that more detailed mapping or literature review of previous works might shed additional information in this regard.
On the floor of the Vermont Valley in the Rutland and Proctor area, LiDAR imagery suggests very significant lobate patterns consistent with the recession of the lobe tip in that area. The following screenshot is from relatively recent VCGI mapping, showing the details in this area:

Stagnant ice deposits, marked here in gray, occur at a high elevation up to nearly 2000 at the T3 level in the Mendon Basin, immediately east of and above Rutland. These descend continuously downward to the west, past Rutland, to about 1000 feet near Castleton at the T5- T6 levels, again suggestive of progressive, incremental ice margin recession akin to closely spaced rings in the “Bath Tub” from the T3 to T5 level. In other words, the VCGI margin features document both the northward recession of the lobe tip in the Vermont Valley, and as well the westward recession of the lateral margin. This south to north and east to west recessional pattern is important, especially with regard to the shape of the Champlain lobe at a late time.
The T3 -T6 margins marking the boundaries of the lobes, in the Vermont Valley and main Champlain Basin to the west, are consistent with physiography, and as well with the above ice margins described by De Simon and La Fleur, as previously discussed, suggesting a long, convex ice lobe in the Champlain Basin and in the Vermont Valley, with the ice margins wrapping around the northern nose of the Taconic upland. VCGI mapping on the nose identifies scattered stagnant ice deposits and apparent, nested Ice Margin Lines, Drainage Lines, or Bedrock Grooves, or some combination thereof, marking the recession of the ice margin on the nose of this upland. However, the geologic origin of these linear features is uncertain. Sewage soil maps on VCGI indicate different soil types with more permeable granular soils along the dashed lines, perhaps indicating that these may reflect drainage along the receding ice margin in this area.
The margins of the ice lobe at T5 and early T6 times are in close proximity with proglacial lake deltaic deposits near both Proctor and Castleton, with multiple, progressively lower stairstep kame deltas and kame terrace levels, likely representing local upland lakes along a receding and lowering stagnant ice margin, followed by recession which allowed entry of Lake Coveville waters, again as marked by deltaic deposits at the Coveville level, consistent with Chapman’s elevations and the mapping by Springston et al as described above. It is likely that the Coveville level deltas near Proctor and Castleton were formed in close proximity in time and space to the T6 ice margin, which is consistent with Chapman’s observation that the receding ice margins were constantly “bathed” by waters of Lake Vermont.
Whereas Chapman’s map shows the ice margin in Coveville time with a significant gap between the ice margin and the Coveville strandline, VCGI mapping indicates a close association of the ice margin and this strandline.As discussed in the main body of this report, it is believed that Coveville Lake Vermont occupied a narrow, more or less open water “corridor” along the highly crevassed “Disaggregated” ice margin.
Footnotes: