Whereas the above report presents the basic evidence used in support of the findings in a relatively detailed way, VCGI, with its LiDAR imagery and as well many other tabs, provide an enormous amount of even more detailed information. This appendix is intended to provide a summary overview of such evidence for various “Locales” around the State. Whereas I have endeavored to edit the information in order to make its meaning clear, unlike the main body of the above text I have not fretted about polishing the writing.
The generation of maps for these Locales from VCGI is mechanically challenging. As discussed above, VCGI’s maps are not scalable, meaning that reducing the scale of output maps so as to fit on a printed page generates an unreadable mass of overlapping lines and text. Further, because data are entered in digital layers, the order of which cannot be controlled, VCGI maps give an unreadable mish-mash which can only be made clear using VCGI maps at larger scale, beyond the scale suitable for presentation here. Whereas the generation of suitable maps can be accomplished by the usage of specialized software, doing so entails a significant cost and learning curve. Instead, a low budget method was utilized, enabling my focus here to be on understanding the geology without having to learn and master the GIS technology. This involved stitching together of screen shots taken from the online VCGI map, which is a tedious, time-consuming process. Methods have been developed for automating the stitching process, but for the kind of information available on VCGI these methods are limited. 1Ordinarily, it should be possible to provide a link to the VCGI site where the mapping was done, whereby the reader would be able to see the final map for the entire State of Vermont. However, as noted above, VCGI intends to update their software with a new, improved version, which will be incompatible with the present version. Thus, unfortunately the present VCGI map will no longer be available when this update is done. At some point before VCGI makes the transition, I may make a composite screen shot of my VCGI map for the entire State. This is a tedious job, again owing to VCGI scaling issues. But if done, a link to such a map can be provided, enabling the reader to examine my entire map and the basis for all the findings reported here.
Of course, the mapping on VCGI was done progressively across the State, starting in the Memphremagog Basin, as part of a learning process whereby my understanding of the deglacial history evolved. As a consequence, the screen shots for the Locales had to be revised and updated repeatedly as this learning process progressed. This is such a tedious, time consuming process that the screen shots for some Locales have not in all cases been updated except where critical evidence would otherwise be lost.
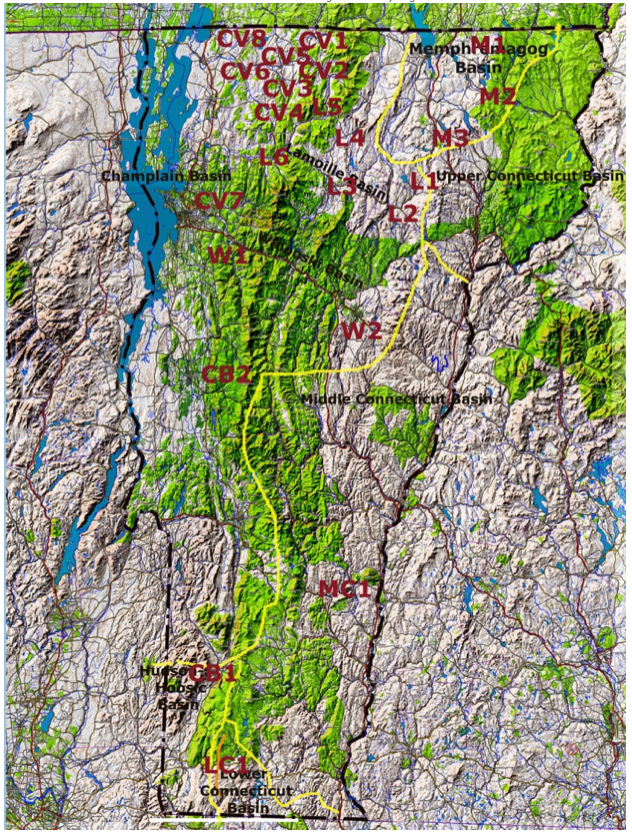
The map below shows the locations of these Locales. In order to give the viewer a sense of the physiography on this map, whereas VCGI’s map depicts topography at a close up scale, the sense of the terrain is significantly diminished on VCGI maps showing the entire State. Thus, the base map for this Locale map is from an online source. 2 https://en-ca.topographic-map.com/map-z4c3q/Quebec/?center=44.99106%2C-72.41132&zoom=15&overlay=0&base=2&popup=44.99257%2C-72.4072
Various features were mapped on the VCGI “Project Sheet,” as shown on Locale maps in the following discussion. These include:
- Physiographic guides: To give a better understanding of the physiography, which is necessary to get a sense of the “Bath Tub”, a variety of markings were highlighted across large parts, but not all of the State on the VCGI Project Sheet: a) The 2000 foot(610 m) contour in many places is marked by a black line. b)Ochre shading shows upland areas above 1600 feet(488 m), again in many but not all areas. c) Thin yellow, blue, and violet colored lines in places are used to demarcate the 1400 foot(427 m) and 1200 foot(366 m) and 800 foot(244 m) contours. d) In some places within the Middlebury Bench the 400 foot(122 m) and 500 foot(152 m) elevation contours and the trace of the Champlain Sea marine limit strandline from Chapman(1937), Wagner(1972) and Springston and Wright(2020) 3 https://geodata.vermont.gov/datasets/VTANR::glacial-lakes-and-the-champlain-sea/explore?location=44.488776%2C-72.268845%2C9.00 maps were added.
- Local versus “adjusted elevations” – Local elevations, meaning taken from VCGI contours, are marked directly next to many ice margin features. Adjusted elevations for isostatic corrections to show feature elevations relative to the Canadian border as a reference point, as explained elsewhere in this report, are shown, generally in larger blue font, with the local elevation and + number representing the adjustment based on the 5 feet per mile(0.95 m/km) gradient and the north-south distance between the feature and the Canadian border.
- Ice margin features, as identified and discussed in the above text.
The following presents VCGI findings for individual Locales.