Note: Much of the following was written and included in my January 2026 report but I made changes based on my April 2026 Addendum, including the addition of Epiphany #6.
According to Meriam-Webster, an “Epiphany is:
“A usually sudden manifestation or perception of the essential nature or meaning of something; an intuitive grasp of reality through something usually simple and striking. An illuminating discovery, realization, or disclosure.”
Near the end of my VCGI mapping I had an “Epiphany,” actually several epiphanies, one leading to another. 1In a sense, – quite simple and striking.. Epiphanies, it seems, for me come at late times in the thinking process, at a time when I have the benefit of retrospective reflection about the many puzzle pieces. In a sense, Epiphanes are part of the maturation process of basic thinking, not unlike paradigm development. The following is a review of several important late epiphanies.
a. Epiphany #1: T3-T4” and Late T7 Signatures”
Epiphany #1 occurred when I revisited the evidence for the White Mountain Moraine System (WMMS) in New Hampshire, with the realization that the moraines and associated readvance evidence reported by Thompson et al, correlate with many features mapped on VCGI in many locations throughout Vermont,with many pieces fitting together to tell a substantial story. For example, Ice Marginal Channels and associated “streaks” at the mouth of the Ammonoosuc Basin mark an ice margin at the T3 and T4 level and time correlative with WMMS features, for an ice lobe in the Upper Connecticut Basin extending southward to the Bradford, Vermont vicinity where drainage features appear to be graded to Lake Hitchcock. Further, VCGI mapping evidence indicates that the ice supply for this Connecticut basin lobe was from a) ice flow across cols along the physiographic divide between the Lamoille and Connecticut Basin at the T3 level and time, and likewise more substantially b) ice flow across col divides between the Memphremagog and Connecticut Basins at the T4 level and time. When the ice thicknesses across these divides diminished and no longer was able to sustain active ice flow, the ice sheet in the Upper Connecticut Basin stagnated en masse, as marked by Scabby Terrain, and was followed by the development of Stewart and MacClintock’s St Johnsbury moraine and Passumpsic esker, both of which are regarded by them as substantial and significant features.
Further with regard to Epiphany #1 was the realization that the T3 and T4 margins are mapped and correlated extensively across Vermont, with a recurrent pattern of Ice Marginal Channels on hillsides immediately below which at lower elevations are substantial stagnant ice deposits. This pattern offers a “signature” to greatly aid and support the VCGI mapping throughout Vermont, independent of the usage of the Bath Tub Model. In the Memphremagog Basin, Ice Marginal Channels are especially prominent so as to clearly delineate ice lobes in the major five finger-like tributary basins (including the upper Missisquoi Basin). These features at the T3 and T4 levels are correlative with WMMS features Whereas the T3 margin per se is not mapped in the Memphremagog Basin, this ice margin position, level, and time is substantially and well-marked by numerous Ice Marginal Channels, including above and descending downward to T4 ice margin levels. Further, in the Memphremagog Basin the T4 margin is identified as a “hybrid” type margin, with active ice marked by Ice Marginal Channels at the upper T4 level and stagnant ice deposits at a slightly lower T4 level, with the evidence showing recession of the active ice margin to the next lower and younger T5 position, level and time, while ice remained in the T4 margin stagnant ice deposits, showing continuing drainage graded toward the new T5 ice margin position. This evidence in the Memphremagog Basin indicates overlapping temporal and spatial relationships between the T4 to T5, and the T5 to T6 hybrid margins , referred to as a Style described as “Everything, Everywhere, All at Once , and Continuing,” Further, the T4 margin in the same basin is correlated with the Dixville moraine just across the international border. Thus, T3 and T4 times in the Memphremagog Basin are identified as part of a pattern which fits with the White Mountain Moraine System, presumably associated with the readvance as identified by Thompson et al.
A similar pattern is identified in the Champlain Basin, marking the recession of a long convex shaped Champlain ice lobe. Ice Marginal Channels and stagnant ice deposits in the Vermont Valley at Bennington, and similar features at Rutland, at the T3 and T4 times, levels, and positions, respectively, mark the recession of this lobe tip. As part of the pattern, the evidence in the Vermont Valley indicates a progressive step-down recessional sequence marked by progressively lower and younger ice margin and associated proglacial lake features, giving way in early T6 time to Coveville Lake Vermont at the mouth of the Vermont Valley. Again this pattern fits with the step-down recessional pattern identified at the WMMS by Thompson et al. Further, as discussed elsewhere in this report, evidence is found at both the Bennington and Rutland vicinities, which would be consistent with a readvance as at the WMMS. Bennington and Rutland are about 50 miles apart, which would indicate a very substantial readvance. Of course, the low gradient of the Vermont Valley floor might serve to distend the ice margin recessional pattern as compared to the relatively steep slopes at the WMMS, but a readvance of this magnitude is not plausible and deserves further study.
Similarly, the T3 and T4 margins are marked by Ice Margin Channels and associated stagnant ice deposits with a similar step-down recessional pattern for conjoined ice tongues associated with the Champlain lobe in the headwater areas of the Winooski and Lamoille Basins. As noted above, T3 time, level, and margin features, including Ice Marginal Channels and stagnant ice deposits in these basins show a step-down sequence from cols along the divides with the neighboring Connecticut Basin. This pattern gives way first to Lake Winooski and subsequently Lake Mansfield, as mapped by Wright et al, who likewise present evidence of a readvance. VCGI mapping in this area shows that the readvance evidence lies mostly within the footprint of Lake Winooski which is here mapped as marking T4 time, with some readvance features at a higher, earlier level, corresponding with T3 time. As reported elsewhere herein, continued recession in the Winooski Basin is marked by T3 to T7 features in the Winooski and Lamoille Basins, giving way first to Coveville and then Fort Ann Lake Vermont in the former and to Fort Ann in the latter.
Further to the north in the main Champlain Basin is a similar pattern of ice margin recession marked by Ice Margin Channels, Bedrock Grooves, stagnant ice deposits, and associated step-down ice margin and proglacial lake features from the T4 to T7 level.
Finally, a similar recessional pattern is mapped on VCGI, in the Missisquoi Basin, giving way first to Fort Ann Lake Vermont and then the Champlain Sea, with evidence that the T8 margin represents a readvance of the ice sheet of the Champlain lobe in Champlain Sea time. The margin of the T8 lobe extended southward in the main Champlain Basin as a long, convex lobe, with readvance evidence as reported by Wright in the LaPlatte Basin and by Connally in the Bridport vicinity.
Thus, “Epiphany #1,” which again occurred near the end of the writing of this report, recognized the presence of a widespread, recurring pattern, marked by Ice Margin Channels and associated stagnant ice features in many places across Vermont consistent with a readvance associated with T3 and T4 time. Whereas in the Connecticut Basin at the end of T4 time the Connecticut lobe stagnated en masse, elsewhere throughtout Vermont the ice sheet proceeded in a step-down recession. In essence, the WMMS readvance represents the earliest time in the Lobate Phase in Vermont, which was then followed by a step-down recession This “signature” ice margin pattern represents the beginning of this recession across Vermont which can be readily identified by the combination of the lowest Ice Marginal Channels lying immediately above substantial stagnant ice deposits. This pattern can and has been mapped, essentially independently, both with and without reference to elevations in the Bath Tub Model. Of course, this logic may entail a degree of circular reasoning, in that T3 and T4 ice margins identified by usage of the Bath Tub Model are now being said to independently confirm the Model. However, the fact remains that T3 and T4 and subsequent recessional pattern is so recurrent, with Ice Marginal Channels so obvious and prevalent at these levels, that the Signature concept has merit. This raises a question about the nature, formation, and history of the T3 and T4 Ice Marginal Channels, which segues into Epiphany #2.
b. Epiphany #2 – Ice Marginal Channels formed by and associated with a Readvance
Epiphany #2 is more in the form of a hypothesis deserving further study. It has to do with the nature and formation of Ice Marginal Channels themselves at T3 and T4 times, and the recognition that these formed immediately after the readvance as just described. At an early point in my VCGI mapping I recognized Ice Marginal Channels as important deglacial history ice margin markers and as well indicators of ice margin dynamics and associated meltwater drainage. Ice Marginal Channels are perhaps the most common, numerous, and striking of all ice margin features found in this VCGI mapping of Vermont. These are described in the section of this report above dealing with ice margin features.
Obviously I am not the first to discover and puzzle about Ice Marginal Channels, though different names are used and different theories about their nature, origin, and mode of formation are suggested in the literature. A very substantial literature about such channels and the larger subject of glacial hydrology exists, both within glaciology for present day glaciers and ice sheets, and as well for Pleistocene history studies. A full exploration of this literature is far beyond the scope here.
Beyond their identification and mapping, I puzzled about how such features formed, which thanks to my revisit to the WMMS suggests a possible explanation. One of the questions I pondered was why these Channels are preferentially located on sloping hillsides, usually on the south and east sides of ice lobes, and especially at prominent convex terrain protuberances? This pattern of occurrence is so common that as my VCGI mapping progressed I began to instinctively look preferentially in such places for the presence of Channels, and in many cases in fact identified Ice Marginal Channels in these locations. And why are Ice Marginal Channels always relatively pronounced, but always and only short segments. And why are they characteristically sinuous, with a distinctive wavy form? If these are erosional in nature where is the eroded material? I also recognized that whereas these Channels are the most common and obvious features in such locations, in many places LiDAR imagery also shows associated “streak-like” tonal patterns, which are as yet less well understood. These “streaks” seem to be related to meltwater drainage at the ice margin, but the details about such features are not at this point fully understood. My sense is that such “streaks” deserve further study.
It seems that convex hillslopes in plan view, especially “corners” where ice lobes rounded such corners or passed from a larger basin into a smaller tributary basin, including very small scale topographic irregularities, were especially important. Shilts, who worked and reported on the deglacial history of the Lac Megantic area of Quebec, refers to “pivot points” which may relate to this issue. Ice Marginal Channels are distinctly different from “Ice Tongue Grooves,” the former marking contours and the latter extending down slope, but both may be meltwater features related to such pivot points (if the latter are in fact bona fide features).
As discussed above in the Ice Margin Feature section of this report, I believe Ice Marginal Channels formed along ice margins, specifically beneath the ice, close to the margin, by the action of meltwater, and in association with active ice. To expand on this:
- That they are related to, and mark ice margins seems obvious to me, especially in the Memphremagog Basin where, as discussed in this report, they are so numerous as to give a clear delineation of ice lobe footprints. However, lobate shapes are also numerous and obvious in other Basins.
- That they formed by meltwater erosion to me seems obvious by the very shape or form of the channels – they can not possibly have formed depositionally, or by mechanisms other than meltwater erosion.
- That they relate to active ice and not stagnant ice margins also seems obvious to me. In my first two years of graduate school I had an experience when I was stuck in the “quagmire” of the Kaskawulsh glacier’s stagnant ice margin. As is well known, stagnant ice margins are complex features with a haphazard array of deposits with a complexity, basically a mess of ice, water, mud, and crevasses, that is hard to exaggerate. The terms “kame and kettle topography” or “hummocky” hardly do justice to the irregular and chaotic geomorphic character of stagnant ice deposits. In my opinion, Ice Marginal Channels are far too uniform in shape, and could not possibly have formed in association with stagnant ice.
- That they formed beneath ice margins and not alongside margins likewise seems obvious. Surface water streams have characteristic geomorphic forms and patterns. Ice Marginal Channels always and only are short sinuous segments which in this respect are unlike free-flowing surface water features.
- That they formed close to the margin, so as to mark the margin, and did not form deeper within the ice, closer to the interior, more central basin floors of the ice lobes, is likewise obvious. Ice Margin Channels only formed on hillsides, and never on basin floors. They descend down hillslopes in multiple nested patterns, in many cases approaching basin floors and associated stagnant ice deposits, but never are mixed with stagnant ice deposits on basin hillsides or floors.
- That they only formed parallel or subparallel to topographic contours is likewise obvious, which is important as they must therefore mark lateral ice lobe margins. In many places Ice Margin Channels can be seen to have gradients indicating drainage in directions as would be expected along ice lobe margins, toward lobe tips.
- That these formed predominantly at the south or southeast sides of basins suggest meltwater directed on the ice sheet surface and/or within or below the ice sheet, directed toward downgradient locations by hydraulic head distributions within and/or beneath the ice, toward terrain barriers.
- That these Channels are short segments, with characteristic wavy sinuosity, almost always on localized topographic convexities is taken as indicating confined conduit flow at the base of the ice sheet where such terrain convexities projected upward, as obstructions.
- That they occur almost always in nested series on hillsides across a range of elevations is again significant, indicative of progressive ice margin recession and ice surface lowering.
Taken together these observations lead to a hypothesis (such hypothesizing admittedly being a reasoned form of speculation), that Ice Marginal Channels represent confined flow within and beneath the ice sheet at receding ice margins in reverse gradient settings, with polythermal conditions, where ponded water drainage formed erosional channels on the terrain at the base of warmed ice. Further, that such features represent “outlet channels” for the impounded and confined subglacial waters, in a sense analogous to channels formed at outlets for proglacial lakes. As noted above, this suggests that the receding ice sheet at this early time likely was both a polythermal “sandwich” with warm ice above and below an intervening cold ice layer, – and as well polythermal warm ice at the margin, with cold ice laterally in the interior. Further, the occurrence of these channels in sets of multiple features represents progressive ice margin lowering and recession. With time as deglaciation progresses, again as noted above, the warming of the ice sheet apparently became complete, which explains the absence of Ice Marginal Channels at ice margins formed late in the deglacial history.
As part of my “Epiphanization,” I thus concluded that that Ice Marginal Channels represent “inverted polythermal” ice environments, with the base of a “cold” ice sheet becoming warmed along its margin. This thought lingered and festered. The recognition that the Ice Marginal Channels formed shortly after the WMMS readvance , led to the heart of Epiphany #2, that Ice Marginal Channels may have been favored by the WMMS readvance, whereby the readvancing cold ice sheet over previously deglaciated and warmed terrain may have served to warm the basal portion of the ice sheet in a manner favoring Ice Margin Channel formation. This is not to suggest that all Ice Marginal Channels necessarily formed in this manner. Some Ice Marginal Channels occur above the T3/T4 level which is correlated with the WMMS and its readvance. It is possible that the higher and earlier Ice Marginal Channels were formed by an early readvance, earlier than the moraines at the WMMS, or that the readvance itself was earlier than T3/T4 time. Alternatively, perhaps the nature of the Laurentide ice sheet recession in this region was generally oscillatory in nature, whereby oscillations which are less substantial than a bona fide readvance may have served to warm basal ice for the formation of earlier and higher Ice Marginal Channels. Clearly, this concept needs further study.
c. Epiphany #3 – Vermont Deglacial History here is late glacial time
Epiphany #3 came from piecing together the evidence that a) the T3/T4 margins in Vermont correlate with the WMMS and a readvance which Thompson et al, report as taking place in Older Dryas time, which is dated as about 14.0- 13.8 K.A., and b) that the T8 ice margin likewise marks a readvance that took place after the initial development of the Champlain Sea at the marine limit. 2The dating of T8 as being at a later Champlain Sea time, after the initial opening of the Sea, is documented by till and ponded water sediment on the upper surface of Champlain Sea deltas in the Missisquoi Basin. Whereas the Champlain Sea strandline is diachronic, representing different times at different places, in general the age of this time, as reported by Cronin et al,3 Cronin T., et al, 2008, Impacts of post-glacial drainage events and revised chronology of the Champlain Sea Episode 13-9 KA; Paleogeography, ,Paleoclimatology, Paleoecology ; V. 262 Issues 1-2, PP. 46-60 is approximately 13 K.A.. Taken together, therefore , Epiphany #3 is the realization that the totality of the recessional record mapped here on VCGI represents a very late glacial time span, and further that the recession of the ice margin from T3/T4 to T8 time was brief and therefore that recession must have occurred quite rapidly. As stated elsewhere this observation is quite surprising, but is supported by evidence for calving ice margins, Disconnections, Disaggregated ice margins, and other evidence of destabilization of the ice sheet associated with meltwater in a reverse gradient setting, all of which is generally reecognized as being associated with rapid ice margin recession.
d. Epiphany #4 – Evidence related to older deglacial history before T1 – T4 time
Epiphany #4 stemmed from a recent chance encounter with Paul Bierman, who is on the UVM faculty and in a sense succeeded me when I left UVM. Paul provided me with a copy of a paper he recently co-authored with others. 4 This is a pre-print paper, dated July 29, 2024, entitled: In situ Cosmogenic 10Be and 26Al in Deglacial Sediment Reveals Interglacial Exposure, Burial, and Limited Erosion Under the Quebec-Labrador Ice Dome, which is available at the following online url address: https://doi.org/10.5194/egusphere-2024-2233. In their report, the authors present findings from a study of beryllium and aluminum isotopes, documenting multiple Pleistocene glacial events associated with the Laurentide ice sheet over a long period of time. According to Paul, he and others are now planning a similar study of the Vermont Pleistocene. Obviously, as has been long and well known, the glaciation of southern New England entailed earlier times, but the Bierman paper suggests multiple glaciations. Thus, the Vermont deglacial history given here represents the tip of the iceberg, so to speak.
This present VCGI study focuses on ice margin features which as it turns out, as just underscored in the preceding Epiphanies, surprisingly represent only very late glacial time, very approximately from about 14,000 years BP to 13,000 years BP. Thus, this is an incomplete record of even the last glaciation. T1 and T2 times are associated with Disconnections of the ice mass in the Connecticut Basin, with T3 time representing the first, earliest, highest ice margin for the deglacial history record for the Lobate Phase. The high elevation Ice Marginal Channels identified on VCGI maps mark lowering ice sheet margins in the preceding Nunatak Phase. But obviously, the ice sheet extended further south, prior to these early times, with lobate ice margins only appearing later. Bierman’s paper raises questions for me as to what took place in Vermont prior to the time represented by the findings given here, where is this early record, and what is the nature of this record, if any record exits at all?
The following sidebar represents my thoughts about Bierman’s findings and suggested possible lines of inquiry which may prove suitable for further study:
It is likely that evidence of earlier glacial times in Vermont, prior to the earliest ice margins as recorded by depositional evidence here, is represented stratigraphically by glacial till, and by erosional evidence, neither of which are examined in this VCGI study. In other words, in early glacial times when the ice lobe margins were still south of Vermont, the ice sheet in Vermont presumably was eroding the terrain and depositing till beneath the ice sheet.
With regard to glacial till, this gets to the issue of how and when during glaciation glacial till is formed, specifically lodgement type till, which is a larger topic beyond this VCGI study. However, the evidence as discussed in regard to the Ice Marginal Channels formed in T3/T4 time in association with the White Mountain Moraine System readvance suggests that these features were formed with warm basal ice in an inverted polythermal “sandwich,” and that this is represented by the till identified by Thompson et al as indicative of the readvance. This suggests that glacial till in the region may have been deposited by warm ice, as has been suggested in the literature, as discussed above as one of my “epiphanies.” As such, it is possible, therefore, that the early part of the last glaciation in Vermont is recorded by lodgement-type glacial till. Stated another way, the record of early glacial history associated with the last glaciation of Vermont may be found in such till , and perhaps more specifically in lower, older portions of such deposits.
Whereas, again, neither glacial till nor erosional evidence per se are specifically examined in this VCGI study, the evidence from this present study provides information bearing on earlier glacial times, where further study by isotopic analysis by Bierman’s methodology may be fruitful:
- Overdeepened Basins: As described above, the tributary basins in the Memphremagog Basin are over-deepened and occupied by deep lakes, with ice margins at the T3/T4 level similar to the Valley Heads Moraines similar to the Finger Lakes of New York. The origin or mechanism of over-deepening appears to be related to the ice flow in the Memphremagog lobe becoming constrained by the bedrock topography.
Likewise, the “Deep Lake” portion of the Champlain Basin floor represents an over-deepening, as depicted on a bathymetric map already given and discussed previously above. This over-deepening likewise may be caused or attributable to the constraint of bedrock topography, by bedrock uplands on the Vermont and New York sides of the basin serving to constrain ice flow in the Champlain lobe. To underscore and emphasize the nature and significance of this over-deepening, the following is a portion of the previously shown bathymetric map for Lake Champlain:

The over-deepened basin floor is illustrated by the blue colored shading. With regard to the southern end of the overdeepened trough, fundamentally this corresponds with a “necking” of the physiographic Champlain Basin floor, as can be seen on the following physiographic map, which likewise has been presented previously:
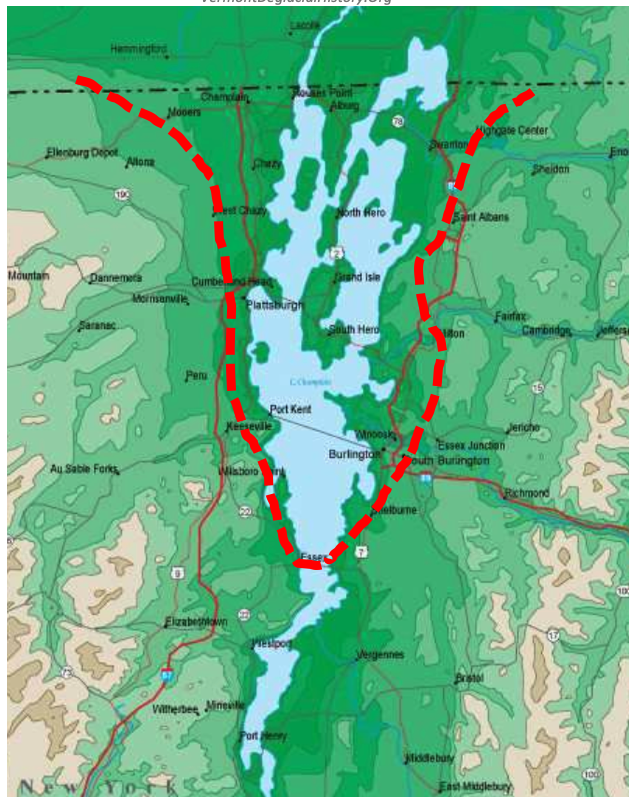
The red line appended to the above map marks the approximate boundary of a low portion of the basement floor which fundamentally represents bedrock controlled terrain with only a relatively thin surficial cover veneer. The apex or “neck” of this basin “funnel” is southwest of Vergennes, and in fact Thompson Point represents a bedrock projection which extends westward toward bedrock uplands across the Lake in New York, effectively representing a bedrock controlled physiographic basin mouth. And likewise, bedrock controlled Adirondack foothills mark the tightening “neck” of this funnel nearby in New York. It is believed that this funnel caused ice flow to accelerate in this funnel, although the over-deepened basin is located upgradient of the “neck,” which suggests complex physical flow dynamics.
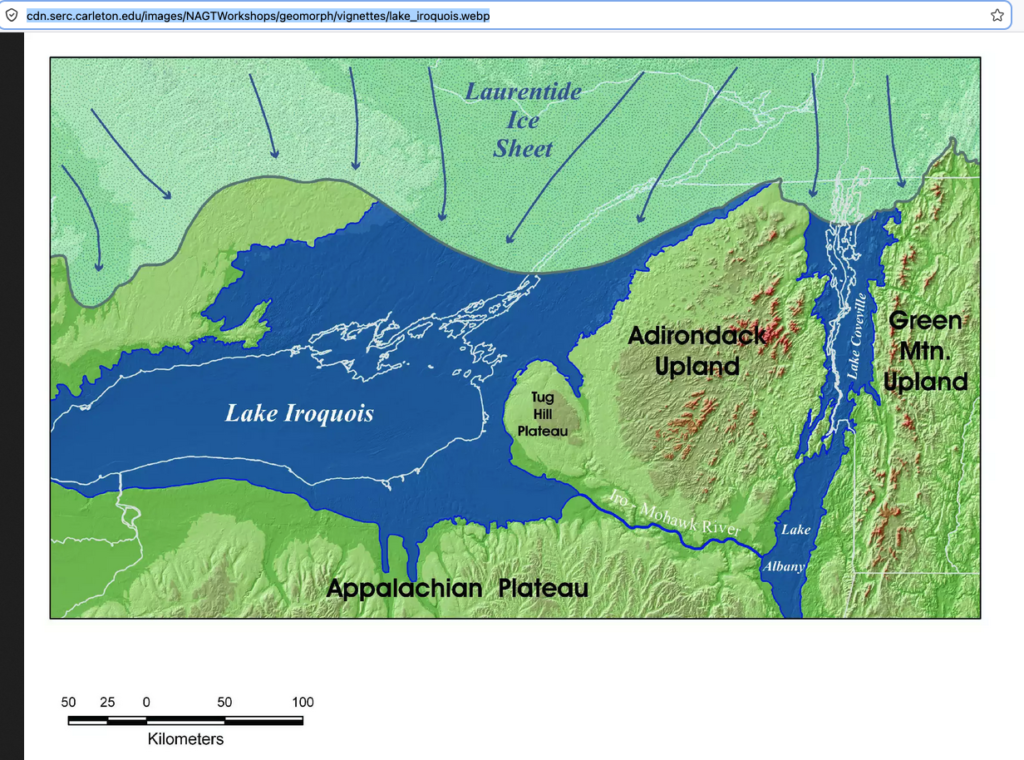
Also as presented and discussed above, various researchers have identified and delineated suggested or inferred ice margin positions in the Champlain Basin. For example, the maps below are from two separate reports by Franzi et al, the map on the left from Figure 2 in a report by Franzi et al,5 Franzi, D.A., et al, 2016, Post-Valley Heads Deglaciation of the Adirondack Mountains and Adjacent Lowlands, as modified from a previous report by Ridge , 2003. and the map on the right from Figure 3 in a different report by Franzi et al: 6 Franzi, D.A. et al, 2015, Quaternary Deglaciation of the Champlain Valley woith specific examples from the Ausable River Valley, 29 p.

To be clear, whereas the above maps show a close correspondence between ice margins and physiography, essentially in conformance with a “Bath Tub Model,” it is not suggested here that the ice sheet associated with these ice margins at the time of their formation had anything directly to do with the over-deepening per se. Rather, these margins are shown here only to illustrate the close correspondence of the ice sheet to physiography. It is believed that the over-deepening occurred earlier, perhaps in fact caused by multiple glaciations over a long time such as recognized by Bierman. The above ice margins are seen as draped on pre-existing landscape, which likely formed over a much longer time period associated with the geomorphic history of the Appalachian (Green Mountain) and Adirondack Mountains ,and the intervening Champlain Basin. In fact, the absence of a sediment bulge-like deposit on the basin floor immediately south of the neck on a scale corresponding with the over-deepened portion of the basin floor may be evidence that the over-deepening developed at an earlier time, conceivably with little added deepening associated with the last glaciation.
The intent of the preceding is to make the point that the over-deepened floor of the Champlain Basin is glacial in origin and not fluvial. This observation applies to the entire “ Deep Lake,” including both the northern and southern thresholds. Whereas isostatic rebound has served to flood the southern portion of the Basin, rebound has not fundamentally altered the fact that this “Deep Lake” portion of the Basin floor is a “closed” basin formed by glacial scour, the lower elevations of which are below present day sea level. Physiography provides a reasonable explanation for the formation of the basin by over-deepening related to the constriction of the Basin which again likely resulted in greater ice movement velocity, though the exact physical dynamics of this scour no doubt were complex. In fact, the over-deepenings in the Champlain Basin, the Memphremagog Basin, and as well the Finger Lakes of New York are located north of, which is to say upgradient from the present-day drainage divides, and in that respect are unlike spillways for ponded surface water drainage.
As to the location of the northern end of the over-deepening scour, the pattern of the “Deep Lake” thalweg and its control related to Glacial Dynamics is less clear. An argument can be made that the physiographic constriction of the basin floor is associated with a progressive narrowing of the basin in the latitude of the Shelburne, Charlotte Middlebury areas, or in other words in conjunction with the “Middlebury Bench.” As discussed above, this Bench was significant during deglacial history in regard to calving, but may as well have been important during glacial advance (again, perhaps in the early times of the advance when the base of the ice sheet may have been warm-type ice) when basal ice erosion may have been favored. In theory, perhaps, associated age differences may be recorded isotopically by older erratics in the lower, older portions of the till sheet located downgradient from the over-deepened basin, essentially in New York, or perhaps as well in the Vermont Valley.
Whereas published reports about the Finger Lakes suggest alternative explanations for the glacial formation of these overdeepened basins, these likely were over-deepened by ice scour, perhaps at multiple times in the past as suggested implicitly by the Bierman paper. Thus, these over-deepened basins might be favorable locations for further isotopic study by Bierman and his team. For example, the age of surface of the bedrock would reasonably seem to possibly vary with elevations in the floors and walls of these basins. Further, the till deposited to the south of these basins might provide a “shadow” enriched by “older bedrock” stones becoming progressively diluted in a downgradient direction, again in New York or the Vermont Valley. Conceivably this shadow may extend a long distance in the downgradient direction.
2. Roches Moutonees: In general, the larger topographic, mountain top scale elements of the terrain in both Vermont and New York show markedly asymmetric stoss and lee side topographic differences related to ice movement for both north-south and east-west profiles. For example, the profile of Adirondack terrain when viewed from the Vermont side of the Basin is distinctly asymmetric. My mapping in the 1960s and 1970s and again here with the VCGI mapping suggests that the Champlain lobe developed a rampart of till on the western slopes of the Green Mountains, , in effect as a way for the ice sheet to more easily cross over the mountains in a southeasterly direction. And likewise, the eastern lee side of these mountains tend to be areas of shallow bedrock suggestive of plucking. For example, my older mapping thick showed this till “rampart” is on the order of 100 feet thick or more on the western flank of Mount Mansfield. Accordingly, this area may be a location where the Bierman team might explore isotopic age differences in the bedrock and till reflective of this history.
3. Scabby Terrain Patches:As described elsewhere, isolated patches of such Scabby Terrain , particularly in the Memphremagog Basin, may represent areas of localized erosion associated with ice falls on the lee sides of bedrock knobs, as described by Davies and others in regard to “Disconnections,” as described previously above. Again, these might be areas having age differences, particularly in bedrock and till on stoss versus lee sides of such knobs.
4. Step-down sequence of ice margins: This VCGI study indicates that the deglacial history of Vermont occurred in a progressive step-down sequence, with Ice Marginal Channels in the Nunatak Phase and progressively younger features at lower elevations including glacial and proglacial deposits associated with the Lobate Phase. This pattern of deglaciation corresponds with the observations reported by others, as for example Koteff and Pessel for southern New England, and has been observed by studies as referred to above in New Hampshire, Quebec, and New York. Such step-down deposits and features , which are very numerous in Vermont as identified on VCGI maps, might as well be locations where further isotope study might be fruitful, depending on the sensitivity of the methodology to short time differences.
e. Epiphany #5: The long, convex T7 and T8 Champlain ice lobe revisited
This Epiphany is in two parts, both stemming from discussions with Dave Franzi. First, Part 1: As stated in various places in this report, the evidence indicates that in T7 (Fort Ann) and T8 (post initial Champlain Sea incursion) times the Champlain lobe extended southward as a long convex lobe, as far south as the Bridport area, bounded by a narrow, more or less open water “Disaggregated” margin on its eastern side, and a much larger open water spanse on its western side. This finding fits with the evidence of calving ice margin recession in the Middlebury Bench re-entrants, beginning with the Coveville to Fort Ann Lake Vermont lowering, followed by the Fort Ann to Champlain Sea lowering. This evidence includes Ribbed Lacustrine deposits, Headless Delta deposits, and Thickened Bouldery proglacial water-body bottom-set deposits for “ice streams” in the re-entrant basins of the Middlebury Bench, leading to the finding that the associated calving took place in two phases associated with water level lowering. It is believed that the lowering of water levels diminished the buttressing support provided by the proglacial water bodies, which thus triggered calving. Added to this is the “readvance” evidence reported by Wright in the Charlotte area, by Connally in the Bridport area, and by Cannon and Wagner in the Missisqui Basin, all consistent with, fitting, and supporting the presence of the Champlain lobe as long and convex in shape in T7 and T8 times.
Thanks to discussions with Dave Franzi, as noted elsewhere herein, he takes issue with the idea of a long, convex active ice lobe, believing that a)his evidence in New York does not support such a finding, and b) that theoretical calculations of ice sheet gradients suggest that such a long, convex lobe of active ice was not supportable by the parent ice sheet. My response is that a) the deglacial history on the New York side of the basin was very different from the Vermont side owing to physiographic differences which opened a larger proglacial water body due to earlier and more substantial calving, and b) the Champlain lobe in T7 and T8 times was a remnant ice mass, thus perhaps resolving David’s issues.
However, David’s points continued to linger, prompting me to continue to stew over this issue. The major evidence for calving is again primarily Headless Deltas, Ribbed Lacustrine deposits, and Thickened Bouldery proglacial water body sediment. The first two of these are fundamentally indicative of stagnant ice. The evidence for active ice far to the south comes predominantly from Wright’s interpretation of his “Deformation Till in the Charlotte area and Connally’s interpretation of a readvance by active ice in the Bridport area.
In my opinion, the evidence for active ice and a readvance is quite convincing in the Missisquoi Basin in T8 time. But what if the ice mass in the Champlain Basin to the south in T7 and T8 time was a long convex lobe but predominantly a stagnant ice mass? The idea thus formed that possibly the lowering of water levels from Coveville to Fort Ann in T7 time, and Fort Ann to Champlain Sea in T8 time so greatly reduced the buttressing support of this stagnant ice mass in the basin so as to locally reactivate the ice, as for example in the re-entrant basins of the Middlebury Bench. Perhaps this reactivation of the ice served to a) “sweep” till ground moraine from the uplands in the Middlebury Bench, toward the re-entrant basins, so as to account for the observation by Wright ,Van Hoesen, and Calkin that these uplands are remarkably till free, and b) result in a mixing of till with other sediments, including structural evidence of deformation, such evidence resembling but not actually formed by a readvance.
Thus, Epiphany 5 began to take form and is still brewing, the idea being that locally reactivated ice might fit with the evidence but for a hybrid type margin, whereby water level lowerings served to extend pulses of reactivation southward within the stagnant ice mass. By this thinking the evidence in the Missisquoi Basin would still stand as a bonafide readvance, but the readvance evidence further south in the Charlotte, Middlebury, and Bridport areas would have formed by reactivated ice associated with, and triggered by, sudden and substantial proglacial water body level lowerings.
A brief review of the literature supports the concept of locally reactivated ice masses, including deformation evidence. For example, Hu and Hasseloff, 2025, 7 Hu, K. and Hasseloff, M. 2025, Proglacial Lake Drainage Events Drive Fast Grounding Line Advance in a Warming Climate; Geophysical Research Letters; https://doi.org/10.1029/2025GL115184 in their Abstract state:
Proglacial lakes along the retreating margin of the Laurentide ice sheet (LIS) significantly influenced the ice sheet’s dynamics. This study investigates the interaction between proglacial lake drainage events and ice sheet evolution during deglaciation. Using a flowline ice sheet model, we demonstrate that abrupt lake drainage caused by the opening of spillways during the retreat of the ice sheet can temporarily reverse ice retreat and trigger rapid grounding line advance despite ongoing climate warming. We also show that ice shelf regrounding on a retrograde lake bed can follow lake drainage and further amplify ice sheet advance. These processes can decouple ice dynamics from climate forcing, offering a non-climatic mechanism to explain the observed highly irregular ice margin fluctuations of the LIS. Our findings suggest that proglacial lakes might play an important role in modulating ice sheet evolution in warming climates.
Similarly, Carrivick et al, 2020 8 Carrivick, J.L. et al, 2020, Toward Numerical Modeling of Interactions Between Ice-Marginal Proglacial Lakes and Glaciers; Front. Earth Sci., 28; https://www.frontiersin.org/journals/earth-science/articles/10.3389/feart.2020.577068/full likewise identify such a Glacial Dynamic associated with proglacial lake level fluctuation, as reported in numerous Pleistocene and Recent cases. The authors state: “Studies on modern glaciers have shown that when an ice-marginal lake drains, a local portion of the adjacent glacier is near-instantaneously de-buttressed promoting calving.” And further: “This Perspectives paper provides the foundation for future studies aiming to address these problems more thoroughly. Concerted efforts continue by researchers around the World who are applying ice sheet models to ice-marginal lake problems, most especially to reconstructions of the Laurentide Ice Sheet for interest in ice sheet (in)stability and collapse, ice stream development and meltwater pulses. Understanding the last Quaternary (de)glaciation will inform our understanding of the present and future evolution of the Greenland and Antarctic ice sheets. Indeed, we challenge future Greenland and Antarctic ice sheet models to consider lake-glacier interactions.”
This Epiphany thus suggests that that proglacial water body lowerings may have altered the Glacial Dynamics associated with the Champlain lobe recession as part of the collapse of the lobe. Thus, the evidence regarding the recession of the Champlain lobe in Vermont may be of interest not just as an academic matter pertaining to geologic history, but as well of interest to modern day global warming concerns, and in regard to the latter may be uniquely significant.
Part 2 of this Epiphany likewise stems from my discussions with David Franzi. In as much as I correlated the T3 and T4 margins with the White Mountain Moraine System in New Hampshire. and correlate the T4 margin with the Dixville moraine in Quebec, the question then arises as to the correlation of the T3 margin in Quebec. At one point in my deliberations I considered the possibility that the T3 margin may extend northward on the eastern side of the Connecticut Basin from the WMMS to the Frontier moraine in Quebec. David expressed reservations about this, again believing that it is unlikely that the Laurentide ice sheet could sustain such a long lobe. However, upon further thought I recognized that Parent and Ouchietti delineated isobases associated with Lake Fort Ann (Candona) features which are oriented NE/SW , suggesting that in fact the correlation of the T3 margin with the Frontier moraine may have merit and deserves further consideration.
Finally, it is noted that this entire issue of a long convex Champlain lobe at a late glacial time was resolved by the subsequent reexamination of LiDAR and field work in April 2026 as part of the Addendum, as reported separately herein. This showed that the Champlain lobe stood as a long convex lobe in T7 time but collapsed and exited Vermont, such that the T8 time readvance was restricted to the Missisquoi Basin. Thus, this issue was finally put to rest.
Still another epiphany, this thanks to my early 2026 “Addendum” LiDAR and follow-up field study, which, to briefly summarize, suggested that:
- The margin of the Champlain lobe in late T6 time extended southward and was bifurcated, with an eastern sublobe tip extending in the Otter Creek Basin in the Vermont Valley near Proctor and Rutland, and a western tip on the main Basin floor near Benson Landing. In late T6 time Coveville Lake Vermont extended progressively northward along the margin of the Champlain lobe, as a “Disaggregated” type margin, in a narrow, more or less open water corridor, as marked by ice contact delta and other ice margin deposits, as for example near Proctor, Brandon, Pittsford, East Middlebury, Bristol, and South Hinesburg.
- The 2026 Addendum study showed that an early phase of calving in late T6 time in the “Deep Lake” portion of the basin, as previously suggested, did not occur. Instead, the Champlain lobe then and later in T7 time stood as a long convex ice mass in the Champlain Basin, precluding open water calving in the “Deep Lake” area.
- The Champlain lobe became destabilized and began to stream with a calving margin in early T7 time when Lake Vermont lowered from the Coveville to the Fort Ann level. This lowering, which was regional in scale and both sudden and substantial served as the destabilization trigger. Early T7 calving ice margins are marked by Ribbed Lacustrine, Headless Delta, and Thickened Bouldery Lacustrine deposits. Calving was associated with ice streams both in the multiple re-entrant basins in the Middlebury Bench and as well in the southern bifurcated lobe tips. The position of the early T7 ice margin at the time when Lake Vermont lowered to the Fort Ann level generally was in the headwater areas of the individual re-entrant basins, as for example near South Hinesburg in the LaPlatte Basin and near Bristol in the New Haven and Little Otter Creek basins. The Middlebury Bench uplands between re-entrant basins at early T7 time likely served as buttressing support for the Champlain lobe, with instability, streaming, and calving localized in the multiple re-entrant basins.
- Whereas the calving lobe tips of individual ice streams in the re-entrant basins stood near the heads of these basins in early T7 time, these sublobe tips receded rapidly such that by “late T7 and Fort Ann time” these lobe tips stood near the western margin of the Middlebury Bench, close to the eastern margin of the Trough. Prior to the early 2026 “Addendum” study, it was thought that these late T7 ice margin positions marked the end of Fort Ann time, followed by further recession at the beginning of Champlain Sea time with a readvance in T8 time associated with reported readvances in the Charlotte area by Wright, the West Bridport area by Connally, and the Missisquoi Basin by Cannon and Wagner. However, the Addendum study showed that this late T7 Champlain lobe margin was associated with a long convex single lobe with its tip near Orwell and Mount Independence, Vermont, and with its lateral margin along the edge of the Trough. Further, the Addendum study showed that this lobe represented a destabilized ice stream with calving and rapid recession, essentially as a collapse with northward rapid recession in T7 time by which the lobe exited Vermont. The Addendum study showed that this ice stream is marked by numerous Scarps and associated Ribbed Lacustrine deposits along lateral shear margins, that Mega-Scale Lineations on the floor of the Trough formed during the recession of this ice stream, that a Transverse Morainic Ridge near Addison marks a recessional position of the grounding line of the lobe, and that the Champlain lobe then finally exited Vermont, still in Fort Ann time and T7 time.
- Thus, by this terminology “late T7 time” as described above marks the beginning of the Champlain Lobe ice streaming, when the lobe stood as a long convex ice mass, largely confined to the Trough, with the Middlebury Bench no longer providing buttressing support, contributing to the collapse. Further by this terminology, the Transverse Morainic Ridge might thus be referred to as “Very Late T7” and the position of the ice margin in Quebec when Lake Fort Ann (or Akawasasne as suggested by Franzi) or Candona as suggested by Quebec researchers) lowered in conjunction with the incursion of the Champlain Sea might represent “Very Very Late T7” time. Thus, we might have an “Early T7,” “Late T7,” “Very Late T7,” and “Very Very Late T7” ice margin times and positions. This obviously becomes quite cumbersome, reflecting the Diachronous nature of ice margins, complicating the deciphering and reporting of deglacial history.
- Finally, the evidence reported by Cannon and Wagner in the Missisquoi Basin is here interpreted as representing T8 time, after the initial Champlain Sea incursion. The evidence for this readvance is substantial and likely was a significant event, but is now believed to have been restricted to the Missisquoi Basin
With the foregoing overview as background we can now turn to this Epiphany, which is in two parts. The first is that a) whereas the deglacial history involves eight time steps marking deglacial recession, specifically T1-T8, and the Lobate Phase of recession six time steps, namely T3-T8, and b) whereas the evidence indicates that recession of the ice margin was progressive, like the water level lowering of a slowly draining bathtub, c) put into perspective the deglacial history presented here for the Lobate Phase fundamentally consists of three steps. The first step marks T3 and T4 time which represents a readvance as suggested by the correlation with the White Mountain Morainic System. The T3 and T4 margins are widely marked by substantial stagnant ice deposits, as for example Stewart and MacClintock’s moraines near Bennington and Rutland, but as well by numerous substantial stagnant ice deposits elsewhere, as for example at the divides between the Memphremagog and both the Connecticut and Lamoille Basins. T3/T4 time is also marked by widespread Ice Marginal Channels as part of the “Signature” pattern which is here interpreted as representing an inverted polythermal condition associated with the readvance of the ice margin. T3/T4 time represents not just the beginning of the Lobate Phase but as well the more substantial development of meltwater which had an effect on the ice margin that increased with time, and ultimately on the ice sheet itself. Whereas T5 and T6 times are identified by deposits at progressively lower levels, again showing the increasing amount of meltwater, as for example documented by the Bedrock Grooves in northwestern Vermont and by the Shattuck Mountain Potholes, put into perspective, in most places it is difficult to distinguish these T5-T6 deposits. In essence, I believe that T5 and T6 times were bonafide steps in the recession, but the ice margins for these ice margin positions, levels, and times as marked on various maps are imprecise. To better understand and demarcate T5 and T6 margins and levels requires more careful and detailed study of the stepdown sequence of the ice margin and associated local proglacial lakes, generally in the foothills of the Green Mountains. In contrast, T7 ice margin position, level, and time is well marked, again only in the Champlain Basin, especially by the Scarps and associated Ribbed Lacustrine deposits which together represent a Signature pattern, comparable to the T3/T4 markings. The only caveat is that T7 was a time when substantial changes took place as part of the “collapse” of the Champlain lobe, with substantial “Diachronism” of the ice margin, as described above. Finally, whereas T8 time is very important from Vermont deglacial history in that it represents a readvance as marked by lacustrine and glacial till deposits in the upper portions of Champlain Sea deltas in the Missisquoi Basin, in fact the position of the ice margin for T8 time is not well marked but is only inferred from the most advanced positions of such deposits.
The second part of this epiphany has to do with a regional perspective on T7 and T8 times, including beyond Vermont, bearing on both deglacial history which is academically interesting and as well regional glacial dynamics which have implications associated with, modern day concerns for global warming. The following is a shaded regional LiDAR map (left) and a regional road and city map (right), taken from an online source: https://rcweb.dartmouth.edu/Geospace/lidar/newengland/
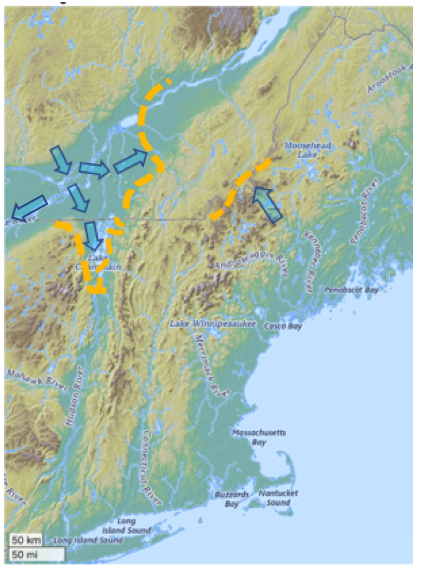
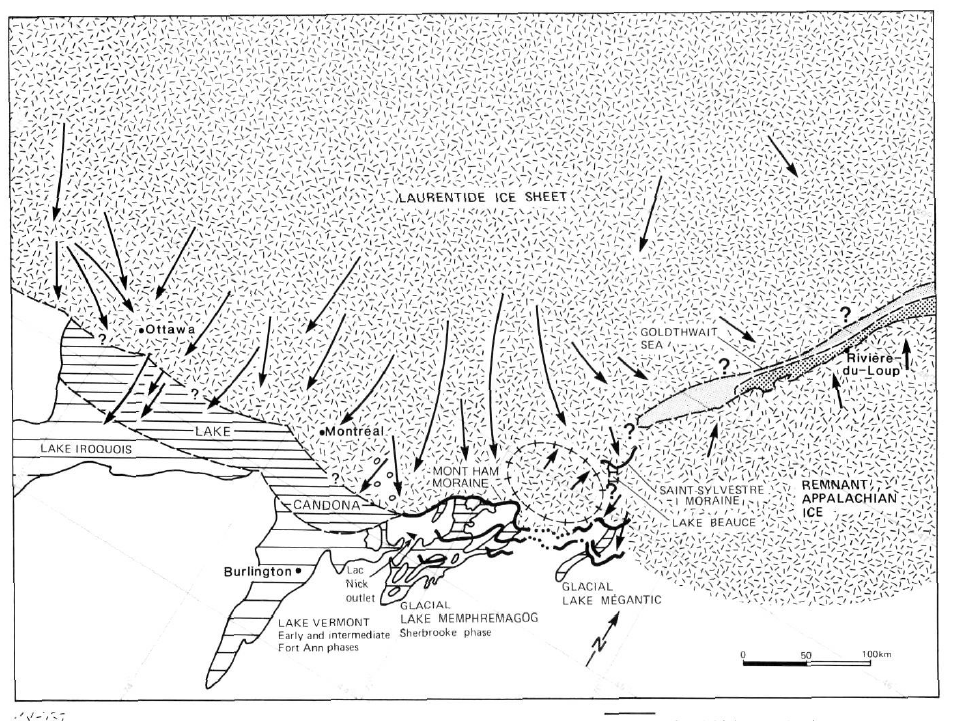
This illustration suggests that in Very Late T7 and Fort Ann time, just before the Champlain Sea incursion, the Champlain lobe had become tri-lobed with appendages extending southward into Vermont, northeastward in the St Lawrence Basin, and southwestward in the Erie Basin, all of which are indicted by ice sheet flow markings and ice marginal features associated with these lobes. The following map by Parent et Occhietti, 1988, gives a sense of the splaying of the Laurentide ice sheet:
Franzi also depictsed ice lobes occupying the Champlain and Erie Basins:
The approximate position of the Champlain lobe ice margin immediately prior to the collapse in “Late T7” and Fort Ann time, essentially as marked by Scarps in Vermont, is suggested by orange colored lines on the above map. In Vermont, the Late T7 margin stood near Orwell and Mount Independence, extending northward along the eastern margin of the “ Trough.” This margin, again, is documented and marked by numerous Scarps and associated Ribbed Lacustrine deposits, Headless Deltas, and Thickened Bouldery Lacustrine deposits. The Transverse Morainic Ridges and Mega-Scale Lineations represent later T7 time. The position of the Transverse Morainic Ridge near Addison in “Very Late T7 and Fort Ann time is not shown on the above map. The T8 ice margin is not depicted on the above map owing to scale limitations.
The trace of the margin in New York at T7 and Fort Ann time is uncertain, but according to Franzi may have stood near Covey Hill, just across the New York border in Quebec in Fort Ann (Akawasasne) time. Whereas the Covey Hill features mark the ice margin and are correlated with Fort Ann (Akawasasne) time the placement of this position in the “Early” to “Very Late “ time sequence for T7 time is unknown.
Likewise, the position of the “Very Very Late T7” margin in Quebec, immediately prior to the opening of the Champlain Sea, and prior to the T8 readvance, is uncertain. Parent et Occhietti (1999, Figure 5) depict the ice margin as standing substantially to the north in Fort Ann (Lake Candona) time:
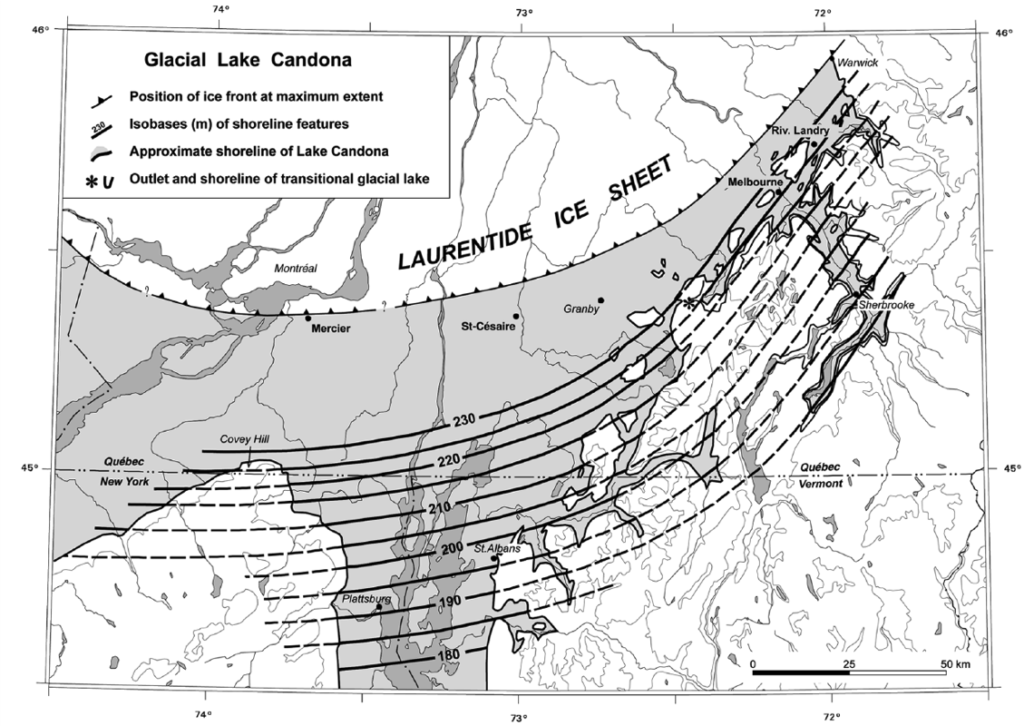
However, whereas the Lake Candona strandline is relatively well documented, the position of the ice margin on the above map apparently is not well marked but is inferred. Of key importance is the position of the ice margin in latest Fort Ann time in the Eastern Townships immediately prior to the opening of the St Lawrence basin for the incursion of the Champlain Sea into Vermont. The above Parent et Occhietti map does not specify this ice dam position but presumably was in the eastern portion of this map, near Warwick, Quebec.
Also, Quebec researchers suggest a residual ice mass in the northern Appalachians, the very approximate margin of which is likewise added as a dashed orange line to the above regional map to symbolize the northern margin of this ice mass.
The T8 margin representing a readvance of the ice sheet into the Champlain Sea in the Missisquoi Basin in Vermont, as discussed above, is not depicted on the above map. If the position of the late Fort Ann ice margin in Quebec as shown on the above Parent et Occhietti map is more or less correct, the T8 readvance distance of the ice margin would be substantial. Of course, the ice margin in Quebec in latest Fort Ann time may possibly have been more convex, making this distance shorter.
In general, this second part Epiphany as just stated relates to deglacial history, which has significant implications in and of itself, albeit as a matter of academic interest. However, the regional perspective as described and depicted above also has significance bearing on Glacial Dynamics and global warming. For me, personally, this second aspect is especially important because the evidence and its interpretation presented here provide important insights about the mechanics of ice lobe and perhaps ice sheet collapse pertinent to modern day ice sheets and global warming. The roles of proglacial water and coalescing proglacial water bodies toward more regional water bodies as agents leading to collapse, obviously in a reverse gradient setting, is important, especially when sudden and substantial changes occur which in the case of the Champlain lobe led to the collapse of this lobe. Again, in addition to meltwater the role of physiography was obviously important.
The arrows on the above map suggest associated flow directions of possible regional ice streams. Of course, all of this is speculative, and is presented here as a logical extension of the identification of an ice stream in Vermont, aimed at stimulating attention to this intriguing regional perspective. The glacial dynamics in southern Quebec associated with the splaying of the ice stream is especially intriguing. I have briefly examined LiDAR imagery in Quebec and New York, hoping to find comparable evidence to features found in Vermont, such as Scarps, without success, but further study is needed.
Obviously, the Champlain lobe history as depicted here requires study and corroborating evidence in neighboring New York and Quebec, and thus is regarded as conceptual. Whereas the Champlain lobe was a very small portion of the Glacial Dynamic for the larger, continental scale of the Laurentide ice sheet, it may be that the conditions that resulted in the ice margin being marked by end moraines in New York, Quebec, and New Hampshire but not in Vermont, instead favored the development of calving ice margin features in the latter. If this is correct, the Vermont record may turn out to be of major importance, especially in regard to modern day collapse concerns. The first part of this Epiphany is intended to provide perspective on the importance of T3/T4 and T8 times as bookend readvances, marking a remarkably late and short time period for the collapse, again as suggested by the age dates referred to elsewhere in this report. The second part of this Epiphany is intended to provide a regional perspective on this collapse aimed at encouraging further study of this important history and associated Glacial Dynamics. More details in regard to this are included in the separate section of this report presenting the findings of my Addendum study in April 2026.
Footnotes: