Finally, a cautionary note regarding the validity of the configuration of the ice margins margins and associated deglacial history as shown and discussed immediately above and elsewhere in this report. As explained, the T8 ice margin depicted on the above map was originally drawn to depict a Champlain lobe in T8 time blunted by calving, and extending westward across the Basin toward New York, but was then revised to suggest a more convex lobe, with the T8 margin basically controlled by and corresponding to the Champlain Sea at the marine limit. This revised configuration reflected a progressive thought process whereby the evidence first in the LaPlatte Basin and then subsequently in other basins in the Middlebury Bench, and as well in the Bridport area, led, almost reluctantly, to the suggested long, convex T8 ice margin configuration on the above map. Such a long convex lobe would seem to fly in the face of a calving ice margin. This issue reflects the dynamic between ice streaming and calving. Further, this margin marks the limit of a readvance in T8 time, which is firmly documented by evidence reported by Cannon and then me (Wagner, 1972) in the Missisquoi Basin, and supported by Wright et al and Connally.
In my 1972 report I recognized the evidence in the Missisquoi Basin suggesting a readvance of the ice margin associated with the Champlain Sea but believed that the Champlain lobe ice margin was restricted to northern Vermont because my mapping of Champlain Sea deltaic deposits in the 1960s and 1970s showed no evidence of a readvance south of the Missisquoi Basin. My recognition, as stated in this present report, that the Champlain lobe may have been substantially convex removed this problem, allowing me to suggest a T8 lobe extending far to the south in the Champlain Basin. The lobe convexity meant that the absence of readvance evidence in Champlain Sea deltas mapped by me in the 1960s and 1970s could be explained by the fact that these features were formed after the readvance by the predominantly westward recession of the convex ice margin.
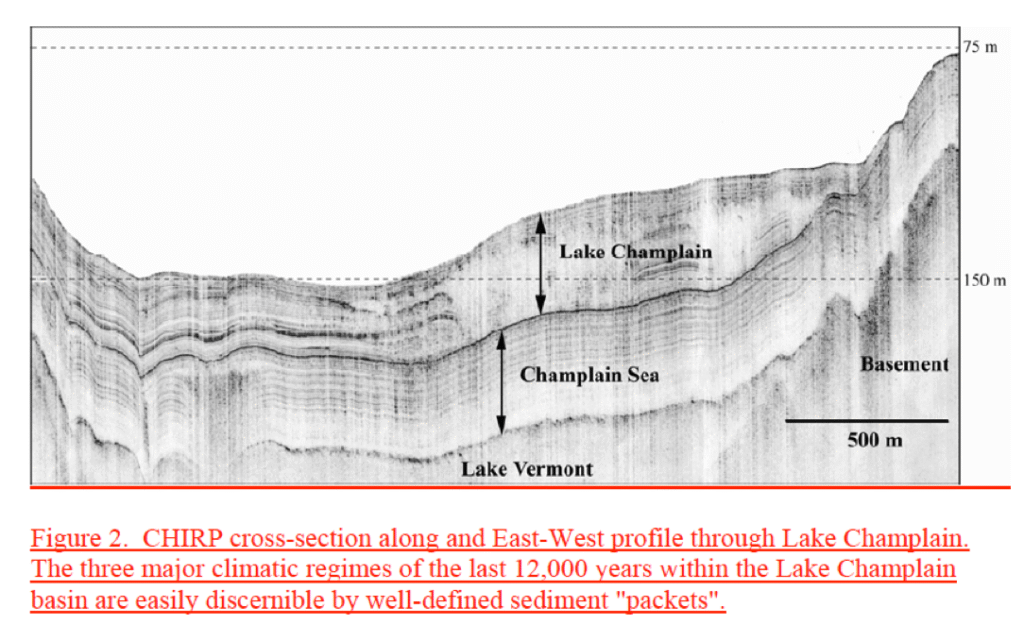
It was with this revised understanding of the T8 lobe configuration and the associated readvance in mind that I subsequently came across a report by Manley and Manley, professors emeriti from Middlebury College in the Geology and Earth Science Department. 1 https://www.chesapeaketech.com/wp-content/uploads/2016/01/LakeChamplain_study2.pdf?utm_source=chatgpt.com I was drawn to this report by the bathymetric information for the configuration of present day Lake Champlain, especially by its depiction of the configuration of the “Deep Lake.” The “Deep Lake” has long been recognized by locals and is shown on marine navigation maps, but the Manley and Manley study provides much better documentation of its configuration.
As noted above, my thinking about this “over-deepened” portion of Lake Champlain, led to the suggestion of an early phase of calving in early T6 and Coveville Lake Vermont time. To this interpretation was then added a second phase of calving in late T6 and T7 time, associated with the lowering of Lake Vermont from the Coveville to the Fort Ann levels, marked by the progressive recession of the grounding lines for ice streams in the Middlebury Bench, leading finally to a readvance in T8 time, followed by a third calving event associated with the lowering from Fort Ann to Champlain Sea levels.
Again, based on the evidence as discussed above, the Champlain Lobe was inferred to have retained a substantial, convex configuration, basically conforming to the Champlain Sea at the marine limit in T8 time. Of course, as just noted, the evidence indicates that the ice sheet readvanced in T8 time, with the T8 margin as depicted on the above map. This was then followed by recession of the ice margin in later T8 time. In fact the Ice Tongue Grooves at the mouth of the Missisquoi Basin and the Ice Margin Lines on the basin floor north of Swanton suggest the ice margin positions in later, lower Champlain Sea time. These features suggest a rapid recession of the ice margin in T8 time, again pointing to the diachronic nature of ice margins.
This cautionary note is prompted by the Manley and Manley report, which again I only recently found (in October 2025, near the completion of this present report). Whereas their report for me was primarily of interest in regard to its bathymetric information, which is presented above in regard to Champlain basin physiography, their report also includes the following stratigraphic depiction of sediment on the floor of Lake Champlain:
As noted above, my thinking about this “over- deepened” portion of Lake Champlain, led to the suggestion of an early phase of calving in early T6 and Coveville Lake Vermont time. To this interpretation was then added a second phase of calving in late T6 and T7 time, associated with the lowering of Lake Vermont from the Coveville to the Fort Ann levels, marked by the progressive recession of the grounding lines for ice streams in the Middlebury Bench, leading finally to a readvance in T8 time, followed by a third calving event associated with the lowering from Fort Ann to Champlain Sea levels.
Again, based on the evidence as discussed above, the Champlain Lobe was inferred to have retained a substantial, convex configuration, basically conforming to the Champlain Sea at the marine limit in T8 time. Of course, as just noted, the evidence indicates that the ice sheet readvanced in T8 time, with the T8 margin as depicted on the above map. This was then followed by recession of the ice margin in later T8 time. In fact the Ice Tongue Grooves at the mouth of the Missisquoi Basin and the Ice Margin Lines on the basin floor north of Swanton suggest the ice margin positions in later, lower Champlain Sea time. These features suggest a rapid recession of the ice margin in T8 time, again pointing to the diachronic nature of ice margins.
The Manley and Manley stratigraphic profile raises a question for me as to how this fits with the evidence of a long convex ice lobe in the Champlain Basin. To get a better sense of this, I reproduced this profile with less vertical exaggeration:
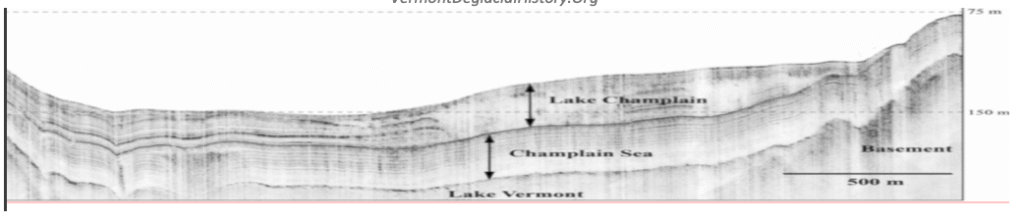
This redrawn profile somehow makes it easier for me to see and comprehend its implicit meaning and its significance as to how this stratigraphy fits (or not) with my interpretation of the deglacial ice margin history. The question posed by this profile is: if the T8 margin as drawn by me extended southward in the basin at the marine limit as a readvance, then how does this interpretation comport with the stratigraphic information given on the above profile? I would expect the readvance in T8 and Champlain Sea time to be marked in some way on the profile. Of course, it is possible that this profile was drawn in the southern portion of present day Lake Champlain, in which case the T8 ice margin might show its presence in the Champlain Sea sediment on the basin floor. Of course, other transverse profiles and as well a longitudinal profile would be of interest.
This served as a reminder for me that the configurations of the T time ice margins given on the above maps are only crudely drawn, uncertain, and subject to revision. More specifically, the positions of the calving margins in late T6 time through T8 time are uncertain and are drawn largely based on conceptual thinking with limited data.
This thinking helped me to recognize that the interpretations of the configuration of these ice margins and associated deglacial history given here in this present report require further study, and represent hypotheses for such study. For example, the evidence presented in this report above identifies a variety of features specifically deserving further study, the outcome of which bears on the fundamental validity of the interpretations given here. For example:
- The Calkin report presents information for multiple locations in the Charlotte area where he recognized evidence interpreted as oscillations, but did not link these to possible correlations with Lake Vermont and the Champlain Sea levels.
- Likewise, the Wright report in northern Charlotte and the Van Hoesen report in the Monkton area present substantial information, which deserve further scrutiny in the context of ice margins, proglacial water bodies, and calving.
- The Connally report likewise is significant for its information about the “Bridport readvance,” but again ice margin features and their linkage to water level history in this area needs further study.
- The VCGI mapping presented here provides intriguing interpretations bearing on this matter, including information from these and other previous studies in this area, but is as yet inconclusive with regard to the linkage between ice margins and water levels. For example, the Ice Margin Lines on the Basin floor west of Snake Mountain, and on the east flank of this upland are intriguing but as yet are inadequately studied. Similarly, the idea of Ice Tongue Grooves at the mouths of multiple basins but especially the Otter Creek and Missisquoi Basins deserve further scrutiny. Many features evident on VCGI LiDAR imagery have been identified on the Otter Creek basin floor between Vergennes and Proctor which are quite intriguing and lend support to the interpretations given here. It appears that substantial bottom sediment for both Lake Vermont and the Champlain Sea has accumulated on the Basin floor in this area, resembling Thickened Bouldery Lacustrine deposits likewise, deserving further study.
In essence, this note is both an acknowledgement and a reminder, even to myself, that, in the final analysis, the interpretations given here in this present report represent, as just stated, hypotheses for further study, not final, firmly established findings. This comment applies not just to the deglacial history of the Champlain lobe, but more generally to the findings of this report in its entirety. This observation was prompted by the Manley & Manley report as a reminder, but actually, as stated in the Introduction, has been recognized from the outset of this study.
Footnotes: