A substantial amount of detailed information pertaining to this time exists. As discussed above in Section II in regard to calving ice margins and Ice Tongue Grooves, ice margin recession in late T6 time was accompanied by the lowering of Lake Vermont from the Coveville level to the Fort Ann level, which triggered calving in the re-entrant basins of the Middlebury Bench. Progressive recession of the calving ice margins in these re-entrant basins took place from late T6 time, through T7 time, as marked by many calving ice margin features. Calving continued and likely was again causally triggered by the lowering from the Fort Ann level to the Champlain Sea level, with the T8 margin marking the transition at the end of T7 and beginning of T8 time. No regional map for T7 time is given here, in as much as T7 time is bracketed by the late T6 and T8 ice margins, which together give a sense of the trace of the intervening T7 ice margin.
T7 time was marked by significant changes along the ice margin, associated with the lowering of Lake Vermont from Coveville to Fort Ann levels, which began in late T6 time. In the discussion below, late T6 through T7 time is illustrated by examples from selected areas of the Champlain Basin, specifically the area north of the Winooski Basin to the Quebec border, the LaPlatte Basin in the Middlebury Bench, and the Otter Creek Basin south of the Bench. By late T7 time the Champlain lobe had thinned and was closely controlled by physiography, with the ice sheet extending southward in the Basin as a long convex ice mass, with a sub-lobe extending eastward into the Missisquoi Basin but the Lamoille and Winooski basins now largely ice free, with the ice lobe lying on the main Basin floor. Much of the following has already been previewed in the above discussion of ice margin features.
a. T7 Time north of the Winooski
As just indicted a regional map for T7 time is not specifically presented here, as being unnecessary. Whereas the ice margin recession south of the Winooski Basin is marked by a T3 to T6 step-down sequence, to the north of the Winooski the step-down sequence includes the T7 margin. The position of the T7 margin in this portion of the basin is very similar and close to the T6 position as shown on the preceding regional map. Thus, the trace of the T6 margin gives a sense of the T 7 position.
T7 time marked the progressive northward opening of the “narrow open water corridor” at the Fort Ann level through time along the base of the foothills, extending to and beyond the Quebec border, where it is termed “Lake Candona.” As noted, this includes, for example, the Ice Tongue Grooves at the mouth of the Lamoille, perhaps the Shattuck Mountain Pothole tract, and tributary basins on the south side of the Missisquoi Basin, such as the Black River basin, a long southward reaching tributary which includes evidence of calving, and other tributary basins as discussed for Locales CV 1 to CV4. Specific , detailed information about the T7 margin and time north of the Winooski Basin is also presented for Locales, including Locale CV7 in the Colchester and Essex areas, Locale L6 in the Lamoille Basin, Locale CV4 near Bakersfield, Locale CV6 at the mouth of the Missisquoi Basin. and Locale CV5 near Berkshire, also in the Missisquoi Basin.
It does not include the north side of the Missisquoi Basin which apparently remained ice covered as part of the long, narrow convex lobe in the Champlain Basin, again as discussed above. Whereas the eastern ice margin likely became destabilized in T7 time, in general the evidence suggests that calving did not take place in the Fort Ann “corridor” except in the Black River Basin, which had a more favorable position for deeper water needed for calving, and as well an orientation more conducive to ice streaming for the calving ice margin.
The map below is a screenshot from the VCGI Project Sheet of the LaPlatte Basin, one of the re-entrant basins identified in the Middlebury Bench.
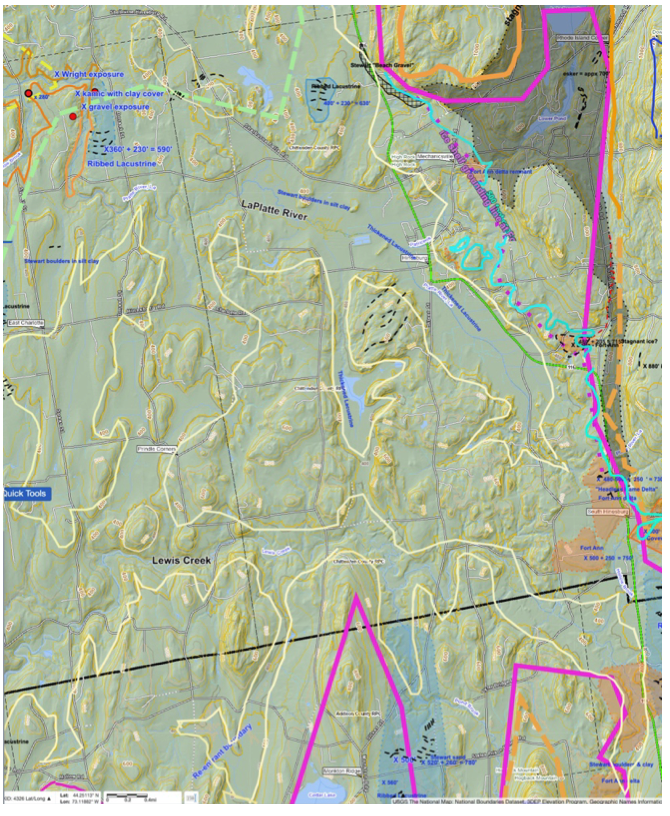
As discussed at length above, late T6 and T7 times involved complex ice margin spatial and temporal relationships associated with the lowering of Lake Vermont from Coveville to Fort Ann times and the opening of the Winooski Basin. This history is not repeated in all details here but in general:
- The ice sheet occupied the LaPlatte Basin as an ice stream extending up the LaPlatte Basin in late T6 time, with its lobe tip near the head of the Basin in the Starksboro area at a stagnant ice margin associated with the development of the major delta at the Coveville level at Bristol.
- The lowering from the Coveville level is marked by Headless Delta and Ribbed Lacustrine deposits, with continued recession of the LaPlatte ice stream marked by calving ice margin features in T7 time, extending down the LaPlatte to the T8 margin position. The T7-T8 transition is marked by a Ribbed Lacustrine deposit associated with the lowering from the Fort Ann to Champlain Sea levels, essentially at the end of T7 time along the T8 margin.
- In late T6 and T7 time a lobe of the ice sheet extended into the Winooski Basin, with an active ice margin impounding Lake Mansfield, with an active ice margin marked by Bedrock Grooves in the foothills along the western flank of the mountains, one of which at Gillett Pond served as the outlet spillway control for Lake Mansfield 1, leading to the major delta at South Hinesburg, also at the Coveville level. As suggested in the above text, as for example under the heading of “Paradigm Trap,” both the Bristol and South Hinesburg deltas formed at the same time along a narrow, more or less more or less open water “corridor” or crevasse labyrinth.
- The south side of the Winooski lobe was itself lobate with a sub-lobe extending southward along the foothills south of Williston in the foothills, marked by a substantial stagnant ice deposit extending southward, forking around Oak Hill on the east side in the Allen Brook Basin, across the divide, into the LaPlatte Basin, and on the west side along the Muddy Brook and Sucker Brook Basins marked by ice proximal deltaic deposits at the Coveville and Fort Ann levels.
- In late T6 and T7 time recession of the ice margin was associated with the draining of Lake Mansfield and the progressive invasion briefly of Coveville waters and subsequently of Fort Ann waters into the Winooski basin as marked by stepdown Coveville and Fort Ann strandline features on the north flank of Oak Hill, drainage features beneath the active ice margin on the north flank of Yantz Hill, Ice Tongue Grooves on the northeast flank of Yantz Hill, and strandline features at the Coveville and Fort Ann levels, including a Ribbed Lacustrine deposit east of Yantz Hill within the Winooski Basin.
The recession of the calving ice margin in the LaPlatte Basin in T7 time, which was induced by the lowering of Lake Vermont from the Coveville to the Fort Ann levels, thus was accompanied by the opening of the Winooski Basin, with substantial sediment transport into the La Platte basin through the stagnant ice margin, including via an esker which is graded to the Fort Ann level in the LaPlatte Basin. T7 time in this Basin was associated with the progressive recession of calving ice margin, as marked by calving ice margin features, including Thickened Bouldery Deposits, Headless Deltas, and Ribbed Lacustrine deposits. The Thickened Bouldery Deposits were deposited by heavy sediment laden drainage originating from the LaPlatte ice stream calving margin and drainage from the stagnant ice margin to the north, which included drainage originating from Lake Mansfield. Likewise multiple Headless Deltas and Ribbed Lacustrine deposits were formed along the Fort Ann level in the LaPlatte Basin as the calving ice margin in this basin receded northwestward. As previously noted these features do not actually mark the grounding line positions but are indicators of rapid recession of the calving margin in this basin.
The thin yellow line on the above map marks the present day 400 foot(122 m) contour which helps to visualize the physiographic configuration of this Basin. The bright, neon blue line along the north side of the Basin traces the approximate 500 foot(152 m)contour which in this area is close to the Fort Ann level and is associated with the calving ice margin features. The floor of the basin is remarkably flat, owing to a thick fill of bouldery lacustrine silt and clay soil, again interpreted as deposited my meltwaters from the ice stream and as well from the drainage of ice in the stagnant ice deposit to the north(gray colored area) and drainage associated with leakage of Lake Mansfield.
The scenario as just described illustrates the diachronic and hybrid nature of the T7 margin, which is believed to be characteristic of all ice margins in the Lobate Phase of recession. The T8 margin, as marked by the yellow dashed line in the northwest corner of the above map, corresponds with the Champlain Sea at the marine limit, indicating further recession and water level lowering. The Ribbed Lacustrine deposit along the lower LaPlatte Basin indicates that: a) the ice margin receded westward to the T8 position, b) when and where Fort Ann Lake Vermont lowered to the Champlain Sea level at the marine limit, c) marked by stagnant ice and associated gravelly soils in a Ribbed Lacustrine deposit, d) becoming stranded and submerged, while ice was still buried in the deposit, e) so as to then become veneered by silt-clay, f) with continued melting giving the deposit its characteristic ribbed topography, g) continuing into T8 time which is marked by a significant deposit reported by Wright(see above) with evidence he interpreted as indicating a readvance but as discussed alternatively may represent a more substantial oscillation of the calving ice margin along the LaPlatte River Champlain Sea delta, h) which correlates with the readvance reported by Connally in the Bridport area, i) and by Cannon(and Wagner, 1972) in the Missisquoi Basin, and j) as well with a nearby deposit at the LaBerge farm along the LaPlatte which Stewart ad MacClintock interpreted as stagnant ice but here interpreted as a kame delta at the Champlain Sea marine limit with evidence interpreted as an indication of the close presence nearby of remnant ice in the Ribbed Lacustrine deposit.
Thus, ice margin recession in T7 time, per the map here, spanned the range between the head of the Basin near Starksboro at the T6 margin(maroon colored line), to the Ribbed Lacustrine deposit marked by the late T7 margin(sage colored line), followed by recession to the T8 position(dashed yellow line) at the marine limit(orange colored line) in the northwest corner of the map, based on the delineations given by Chapman, Wagner(1972) and Springston et al, with slight postglacial erosion altering the topography.
The T7 ice margin position given on the VCGI map in this area is very close to the T8 position, such that depiction of the T7 margin on a regional map is not needed in this summary here.
Another example of T7 time is further south in the southern sector of the Champlain Basin, just north of the nose of the Taconics, as depicted on the map below which is a screen shot from the VCGI map for the area approximately from Middlebury south to the Pittsford area:
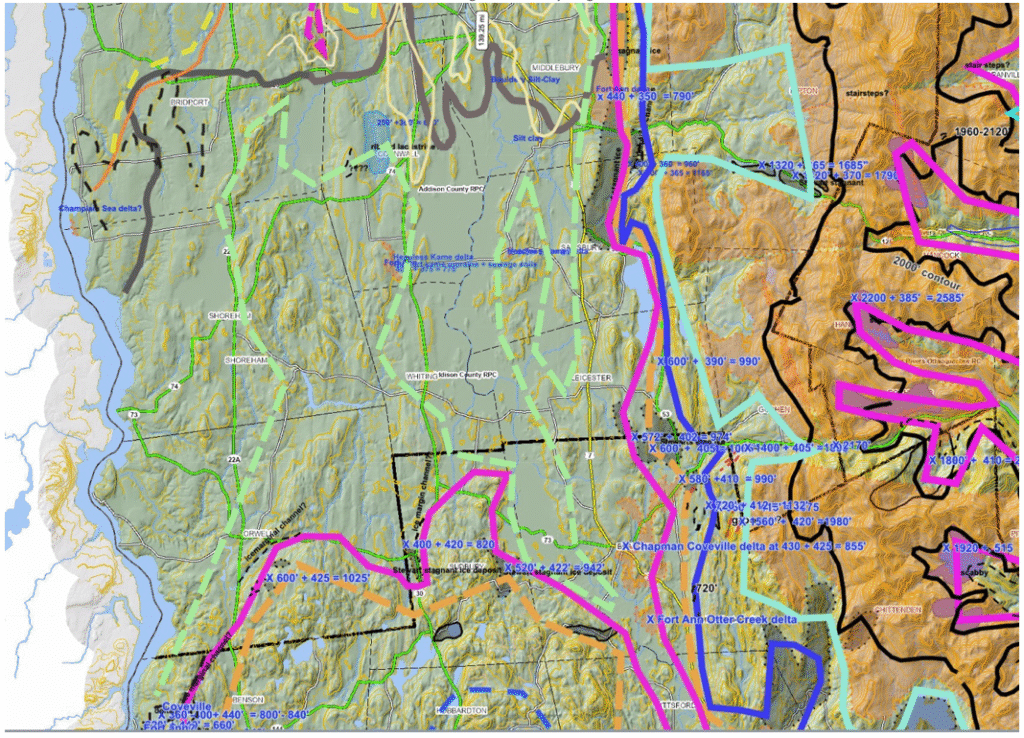
The T7 margin corresponds with the sage green dashed line on this map. As can be seen older ice margins include the T3(blue green), T4(blue). T5(orange), and T6(maroon). The T8(yellow) margin is in the northwest corner of the map. These margins correspond with the Champlain lobe which extended southward into the mouth of the Vermont Valley, with the margin wrapping around the nose of the Taconics. Whereas the T3, T4, T5, and T6 ice margins are drawn based on ice margin features, with consideration given to Lake Vermont strandline positions, the T7 margin in this area was drawn so as to approximately correspond with the Fort Ann strandline, because the evidence indicates that by T7 time the ice margin was controlled or greatly influenced by this water body and level. The only T7 ice margin features are a kame(?) delta at the Fort Ann level near Benson landing, in the southwest corner of the map, a Ribbed Lacustrine deposit north of DeLong Hill, calving ice margin features at Delong Hill formed on the west side of the Otter Creek ice stream and on the east side at West Salisbury. Further field study of this area is needed, including in the mouth of the Vermont Valley where the stepdown sequence of ice margins from the T4 o T7 levels is mapped.
The Stewart and MacClintock boundary marking the bouldery versus non-bouldery silt-clay deposits on their State map is marked by the heavy gray colored line on the above map. The DeLong Hill and West Salisbury features indicate calving beyond the S & M boundary; south of their line marking the boundary between boulder versus non-bouldery lacustrine soils. The absence of boulders in the silt-clay soils below the Fort Ann level indicate that water depths may have been too shallow for calving, or alternatively and more likely that the bouldery soils are buried by late glacial and post-glacial deposition of non-bouldery soils. It is noted that the remarkably low, flat bottomed floor of Otter Cree, which is consistent with calving ice streams in the Middlebury Bench, corresponds with Salisbury and Leicester Swamp,(well known and locally famous for its large and numerous mosquitoes which allegedly were once proposed as Vermont’s State bird!). Again, perhaps this terrain corresponds with thickened Silt and Clay deposits associated with calving, which are now buried by younger Otter Creek sediment.
7. T8 Ice Margin Position, Level and Time
The map shown here depicts the T8 ice margin. Owing to scale limitations, this map is highly generalized. More details about the T8 time and level are given in the text above and in various Locales. The T8 margin was closely associated with calving which began in late T6 time in the Middlebury Bench, continuing through T7 time, into T8 time. The T8 margin shown here was controlled by and marks the Champlain Sea marine limit.
Also as discussed previously, an earlier phase of calving is identified as possible in the “Deep Lake” portion of the basin, beginning in early T6 time. If this phase occurred it likely still continued through T8 time. The footprint for this phase of calving is not shown on this map; as stated above, evidence for this early calving, if any, is likely to be in New York State.
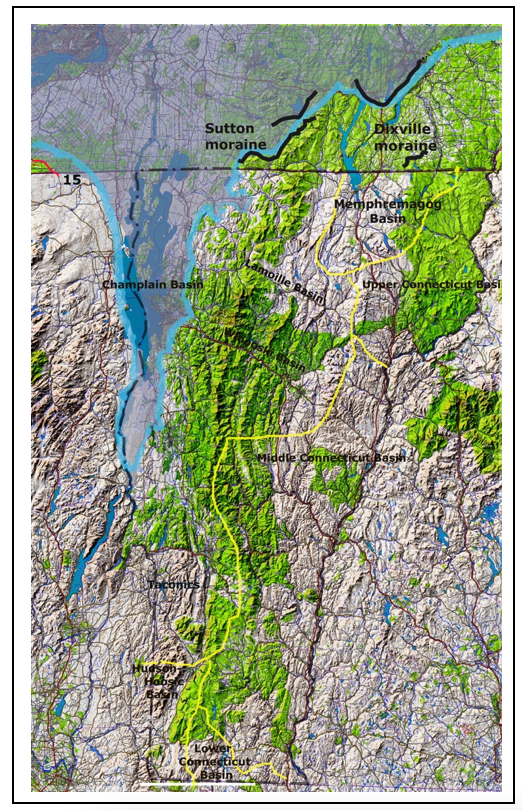
When I initially identified ice margin features at the T8 level and time, in the Missisquoi Basin in the Berkshire vicinity at Locale CV5, as described elsewhere herein, I recognized that this ice margin was closely related to the Champlain Sea. I also recognized that the elevation of the Berkshire stagnant ice deposit at this level is similar to the elevation of the Sutton moraine in Quebec, and likely is correlative with that feature. As discussed for this Locale, a close examination of the physiography using the Bath Tub Model indicated that the ice sheet, marked by the Sutton moraine, could have extended into the Berkshire area in a variety of different ways, meaning by different shapes of the ice margin. This led to the delineation of an ice margin indicating that the Berkshire deposit likely formed at the juncture of multiple sublobes, including: 1) a lobe extending eastward up the Missisquoi Basin, bifurcating into a sublobe extending northeastward up the Lake Carmi basin and a sublobe reaching the Berkshire area via a direct route on the Missisquoi Basin floor; 2) a sublobe extending directly southward down the Pike River Basin from the Sutton, Quebec vicinity to the Berkshire area; 3) a sublobe extending southwesterly down the Missisquoi Basin floor from Quebec. Thus, the Berkshire deposit likely was formed by a complex configuration of the ice margin in T8 time. The above map is too generalized at this regional scale to show these details.
I also recognized, going back to my work in the Missisquoi Basin in the 1970s, that the evidence indicates a readvance of the ice sheet in Champlain Sea time, again as discussed above. This was supported Cannon’s report 1 Cannon, W.F., 1964 Report of Progress: 1964, The Pleistocene Geology of the Enosburg Falls Quadrangle, Vermont. Open file Report No 1964-1, 25 p. This reference apparently is mislabeled online as “Pleistocene geology of the northern Champlain Islands and Alburg peninsula, ” with the Champlain Islands report missing. on the Enosburg Falls Quadrangle which also identified evidence of a readvance in Champlain Sea time, although Cannon’s paradigm-ic mind set would not allow him to suggest a readvance in Champlain Sea time because he believed that by Champlain Sea time the ice sheet had receded to the north in order to allow the entry of the Sea into Vermont. This is discussed under the heading of “Paradigm Trap” in regard to the shape of the ice sheet in the Champlain Basin and its northward versus westward ice margin recession. I too struggled to fit all the evidence together, and repeatedly had to fight to overcome my mental bias associated with the conventional mindset that the recession was northward.
Interestingly, Cannon, 2 This observation gets to the timing when striations are formed, relative to whether or not this is during advance versus recession of the ice, or different times within the recession. This also speaks to the issue of warm versus cold based ice, the suggestion being that these late striations may have been associated with warm based ice. And this as well relates to the issue of the Glacial Dynamics of the ice margin, the possibility being that warm based ice may more closely correspond with physiography. who as an assistant to Stewart and MacClintock in their statewide surficial mapping project for the Vermont Geological Survey reported on the Enosburg Falls Quadrangle, in the Missisquoi Basin, likewise had the issue of the ice margin configuration in mind, particularly with regard to his striation information. His report provides some interesting observations:
- P. 2: Striae and grooves which indicate ice movement directions are said to be “extremely abundant, ” indicating a north to south ice movement in the central lowlands as compared to a more northwest to southeast direction along the margin of the lobe in the eastern portion: “From these data it appears that the last ice to cross the region advanced from the northwest but was deflected toward a more north-south flow by the topographic control of the Champlain Lowland and the “Green Mountain front.” This observation pertains to the influence of physiography, per the Bath Tub Model and relates to the sustenance of the ice lobe in the Missisquoi Basin. Further, if in fact the ice movement in the lowland had become “deflected” to a more north to south direction, then the ability of the ice sheet to sustain a long convex ice lobe in the basin, as ultimately found as my VCGI mapping progressed and as discussed in the following for T8 time, may have been more easily accomplished than by an ice flow from the northwest. Or stated conversely, the shape of this long convex lobe required north to south flow.
- P. 3: “Tongues of ice apparently extended down the major valleys for a period of time after the main ice mass had retreated from the area and in some cases readvanced into formerly deglaciated valleys. The direction of movement of these ice tongues was controlled by the trend of the valleys and was not necessarily parallel to the flow of the main ice mass.”
- P. 4: Cannon then gives specific documentation of evidence for a “readvance,” stating: “From this it is evident that the valley(meaning the Missisquoi) was ice free for a significant period of time before ice readvanced and deposited the till.” Whereas Cannon recognized that the evidence suggested a readvance in Champlain Sea time, he apparently found this to be too much for him to suggest such a readvance in Champlain Sea time based on his paradigm-ic model belief system which reflected the commonly held view that by Champlain Sea time the ice margin had receded far to the north(into Quebec) to allow entry of the Sea into the Champlain Basin, and therefore was unable to report this as a Champlain Sea readvance as such, as being more substantial than he believed likely.
- P. 5: “A final case where active valley ice seems likely is in the Lake Carmi valley. Lake Carmi occupies a depression in a broad glacial trough trending north-northeast. The sides of the trough are covered with a nearly continuous layer of till but no lacustrine deposits were found although the elevation of much of the valley sides is below the supposed level of Lake Vermont.” Per this quote, Cannon’s observation about active ice seems obvious but is helpful to bear in mind in the following. His comment about till without a lacustrine cover is reminiscent of my mapping of the north side of the Missisquoi Basin in the 1970s, where fresh looking, boulder strewn till ground moraine was identified. I recognized at the time that this likely was significant, but its meaning was not understood. This ground moraine terrain is remarkably bouldery and fresh looking(for example, resembling the bouldery-ness of Pinedale deposits in the Rocky Mountains). In general, such fresh-looking glacial terrain is not found elsewhere in Vermont. This may also relate to the fact that Fort Ann deltas on the north side of the Basin are likewise spotty and less evident than expected. In general, I take this as indicating that this area in Fort Ann time was ice covered, and as well was within the footprint of the T8 ice readvance.
Returning to the work related to the configuration of the ice margin in the Missisquoi Basin, I also recognized at an early time that Ice Tongue Groves at the mouth of the Basin likewise include both active ice Bedrock Grooves and stagnant ice features, specifically near Greens Corners, suggestive of and consistent with a step-down recession of the ice margin, leading to the Ice Tongue Grooves which are graded to the Champlain Sea. A stagnant ice deposit at the head of the largest Groove fits with a T8 margin, with drainage extending down the Groove, graded to deltaic deposits at the Champlain Sea level. Taken together, the features in this area indicate a hybrid type ice margin with both active and stagnant ice margins in a step- down recessional mode, presumably associated with the ice margin “readvance”(or oscillation), with a very close relationship between the ice margin and the terrain physiography. The step-down pattern of recession is especially well marked in the area south east of the village of Greens Corners, along the foothill front, where Bedrock Grooves and deflected stream drainage patterns mark this recession. Interestingly, whereas most of the Ice Tongue Grooves appear to be graded to Champlain Sea deltaic deposits at the marine limit, the westernmost and youngest Groove, as part of the step-down recession, appears to be graded to a deltaic deposit at the Burlington of Port Kent Stade. More detailed study of this area is needed, but if correct this evidence would suggest that the T8 ice margin persisted, with progressive recession, during a prolonged Champlain Sea time.
As a sidebar:
The features just described came to my attention in 2023 during a bike ride on the Missisquoi Rail Trail. I was reminded of my mapping in that area in the early 1970s, especially in the Greens Corners area. That led to my taking a fresh look, with the benefit of VCGI and LiDAR imagery, which turned out for me to be astounding. In turn this led to an open letter to the Vermont State Geologist aimed at calling attention to this area which seemed to provide important deglacial history information. As it turned out, this was the beginning of my Statewide mapping as reported here Appendix E contains my open letter. This letter is included here as it presents information bearing on the T8 margin and time. It presents evidence which I now see as especially important, particularly with regard to the step-down sequence, and the T8 margin,(though in 2023 I did not at that time recognize T margin) including the suggestion that the T8 margin receded trough time from the maximum readvance position at Champlain Sea marine limit time and perhaps and continuing to times of lower Champlain Sea stades.
It needs to be kept in mind that: a) the Champlain Sea marine limit strandline was diachronic, and may have actually both advanced southward into Vermont from Quebec and as well receded northward in Vermont, depending on the progression of the T8 margin which was likewise diachronic; and b) the T8 margin is here regarded as marking the readvance. Thus, still needing to be resolved was the recessional position of the ice margin prior to the T8 readvance, and its associated water level, and as well the water level associated with the readvance as to whether or not the Champlain Basin may have been closed to the Sea temporarily, perhaps locally. This latter question is raised by the fact that the evidence for the readvance includes ponded water sediment and till overlying Champlain Sea deposits at the marine limit. This evidence suggest that a higher water level was established at T8 time maximum. Interestingly, the evidence from the LaBerge Farm along the LaPlatte River presented above shows that the Champlain Sea marine limit delta is overlain by ponded water sediment interpreted as associated with the T8 readvance. However, most of the Champlain Sea delta deposits at the marine limit that I mapped in the 1970s showed no evidence of subsequent ponding. Clearly, although this present mapping is helping to better understand late deglacial history, we are still missing important pieces of the deglacial record.
Thus, the T8 margin was drawn at an early time so as to extend from the Berkshire and Enosburg Falls area to the Greens Corners area, the question then became as to where this ice margin extended. Again, without my realizing it at the time, my mental thinking (ie., “Paradigm Trap”) conditioned me to think that the T 8 margin likely extended westward across the Champlain Basin toward New York, as a calving margin. Thus, early drafts of ice margins indicated that the T8 margin extended westward toward New York State.
However, again at this early time in my VCGI mapping, I also recognized that the Champlain Basin floor is relatively low and flat, extending far southward, to and beyond the Taconics. Recent glaciological literature suggests that ice sheets in similar settings, including and especially with reverse gradient conditions as in this case, face a Glacial Dynamic where ice flow tends to extend the ice margin as a convexity, in this case southward in the Basin, while calving tends to cause the ice margin to recede as a concavity. In essence, these two factors represent a Dynamic which determined the shape of the Champlain Basin ice lobe, as to its being relatively convex versus concave. The literature indicates that as a consequence of this Dynamic, ice margins may be substantially convex or concave, or irregular. Again, in the case of my early mapping I delineated the ice margin as flattened, extending westward from the Missisquoi Basin across the Champlain Basin toward New York, as I believed that the receding margin of the Champlain lobe likely was calving, and at that time I had no evidence of ice margin features at the T8 level to the south. For reasons discussed elsewhere, the T8 margin likely was believed to extend westward to a position located north of Covey Hill in Quebec.
As the VCGI mapping progressed, particularly in the LaPlatte Basin, I recognized that the features in this basin represent a calving margin, with the evidence indicating progressive recession of the ice margin of the LaPlatte ice stream in the Middlebury Bench, beginning with the lowering of Lake Vermont from the Coveville to the Fort Ann level. The evidence from VCGI identified a Ribbed Lacustrine deposit on the lower LaPlatte at an elevation consistent with Fort Ann. However, at the LaBerge farm, a short distance downvalley to the west, field examination of a deposit, which Stewart and MacClintock identified as a stagnant ice deposit, suggested that this deposit likely is a deltaic deposit formed at the Champlain Sea, but with evidence of a) a silt-clay cover which is consistent with the readvance identified in the Missisquoi Basin associated with the Champlain Sea, and b) pockets of coarse-grained gravelly material which are inconsistent with the “normally” placid conditions associated with deltaic deposition, but suggestive perhaps of a nearby ice margin in the proximity to the delta – at the Champlain Sea level.
Repeated field visits to this area confirmed that the nearby Ribbed Lacustine deposit along the LaPlatte includes buried gravel material with a lacustrine silt-clay cover as expected with such a deposit. Ribbed Lacustrine deposits formed where and when water levels lowered so as to allow for their submergence, whereby melting ice still in the stagnant ice deposit became overlain by fine grained sediment, which then became grooved as the buried ice continued to melt. This particular Ribbed Lacustrine deposit was at the recessional end of the Fort Ann sequence, suggesting its formation in conjunction with the Fort Ann to Champlain Sea transition. Further, the pattern of the LaPlatte River in this vicinity marks a striking change, consistent with drainage along an ice margin marked by this deposit, with flow direction deviating westward consistent with recession of the ice margin, and the lowering of water levels from Fort Ann to the Champlain Sea.
Across the River from the Ribbed Lacustrine deposit to the west, in the vicinity of the old Charlotte landfill, the topography in places appears to be slightly kamic, with a silt-clay cover, with stone and boulder content varying greatly from place to place, in places being very stony.
The “clincher” for me came from the literature for previous research from two sources:
First, the description given by Wright in his report for the northern portion of the Town of Charlotte, of an exposure of a “Deformation Till,” which he interpreted as indicating a significant readvance with climatic implications. Whereas I interpret this deposit as more consistent with an oscillation of the ice margin associated with the Champlain Sea delta, the point here is that either way the presence of the ice margin is indicated in close proximity to the Champlain Sea, at an elevation which correlates with the T8 margin far to the north in the Missisquoi Basin. Further, examination of VCGI suggests similar features, in the Little Otter Creek and New Haven River basins, including similar deposits and stream pattern deviation, though further field work in this area is needed. Calkin’s reports in this area are likewise consistent with this interpretation.
And second, “Ice Marginal Lines,” which are features still incompletely documented and understood, and only tentatively recognized, located on the Basin floor immediately southwest of Snake Mountain, are a) at an elevation correlative with the T8 margin, and b) are in the vicinity of features which Connally interpreted as indictive of his so-called “Bridport readvance.” This readvance has been disputed in subsequent literature and unfortunately, as Connally indicated, the exposure displaying his evidence no longer exists. However, his report presents photos which certainly appear to be compatible with ice margin oscillations, perhaps a readvance. This is in close proximity to the Champlain Sea limit.
Again, as my examination of the evidence regarding the T8 margin progressed I recognized the possibility that Connally’s Bridport readvance and the Ice Marginal Lines may represent the T8 margin. In fact, the VCGI evidence indicates that the ice margin on the floor of the Basin in the Otter Creek re-entrant is marked by calving ice margin features associated with the T7 margin at the Fort Ann level, with the evidence suggesting recession to a T8 level, whereby the Otter Creek Champlain Sea delta was formed in close proximity to an ice margin, consistent with Connally’s evidence and as well the Ice Marginal Lines at the T8 level and time.
Thus, the T8 margin was redrawn as depicted on the above map so as to indicate a long convex lobe extending southward from the Missisquoi Basin. The Champlain lobe in T8 time is depicted here as a relatively long and convex ice lobe based on the correlation of ice marginal features associated with the Champlain Sea at the marine limit in the Missisquoi Basin, in the La Platte Basin, suspected similar ice margin features in the Little Otter Creek and New Haven River Basins, the linear features immediately southwest of Snake Mountain, and as well the evidence of ice readvance or oscillation in the Bridport area, all in close association with the marine limit.
The margin of the southern side of this T8 lobe was calving as suggested by bouldery silt-clay deposits as depicted on the State surficial geologic map, at and below the marine limit, extending northward from the Bridport area to the Quebec border, marking the recession of the ice margin in T8 time or post T8 time. As discussed above, the evidence in the Missisquoi Basin indicates that the ice sheet readvanced so as to partially veneer Champlain Sea deltas with lacustrine or marine sediment and till, as discussed previously by Cannon(1964) and by Wagner(1972). The T8 margin depicted here is taken to mark the ice margin associated with this readvance, and likely correlates with evidence reported by Wright in the Charlotte area and Connally in the Bridport area, and perhaps Calkin in the Middlebury area. Whereas Wright and Connally inferred this readvance as having climatic significance, this may instead have been a more substantial oscillation of the ice margin as suggested by Calkin(date uncertain but likely in the 1960s), with no climatic significance. In any case, the matter of climate variation can not be examined with VCGI information alone as reported here.
The above map depicts the ice margin in T8 time with a narrow water corridor fringe occupied by the Champlain Sea. The relationship, if any, to the possible presence of calving in the “Deep Lake” section of the Basin is unknown, which again requires further study in New York. Again, recession of the ice margin from this T8 position by calving in the Champlain Sea is suggested by bouldery silt-clay marine deposits as depicted on the State surficial map, extending northward from the Bridport area
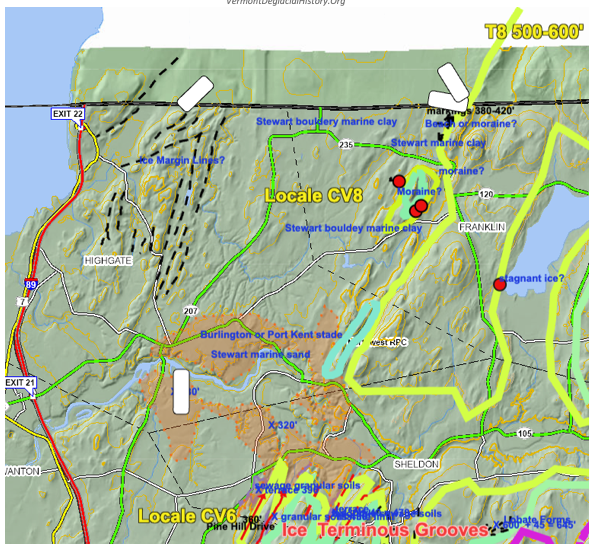
Finally, the ice margin then receded northward from its T8 position to and beyond the Quebec border, but whether or not this took place at the marine limit, or in conjunction with later Champlain Sea stades below the marine limit as reported by Chapman is unknown. No evidence linking any of these lower stades to the ice margin was found by Wagner(1972). However, in the northwestern corner of Vermont, on the Basin floor, just south of the Quebec border, are Ice Marginal Lines, which again at this time are as yet of uncertain origin and meaning for deglacial history, if any. If these features mark an ice margin, it is possible that they represent a late T8 or post T8 recessional position, perhaps marking a T9 ice margin and time.
The screen shot below shows this northwestern area including the Ice Marginal Lines and the T8 margin. Unfortunately, once again the quirky digital nature of VCGI layers at the time this screenshot was made makes it difficult to see all of the information marked on this map.
The T8 margin as now mapped has implications bearing on both the deglacial history and the issue of global warming. From the deglacial history perspective, it appears that the receding Laurentide ice margin in Vermont was progressive, with a stillstand at the T4 level which may correspond with a readvance corresponding with the evidence in New Hampshire. This was followed by step-down recession from T4 to T8, with another ice margin oscillation/readvance. The readvance/ oscillation in the Champlain Basin may have actually been relatively minor when examined in the context of a long convex ice lobe. Further, given the evidence from modern glaciers and ice sheets showing that ice margins can vary from recession to stillstand to advance at the same time, it is possible that these oscillations/readvances may have been local. From the point of view of global warming, the interpretation given here indicates that physiography played an important role in the ice sheets recession. It appears that the Middlebury Bench served as an important support for the Champlain lobe, enabling it to extend far to the south in the basin, but that calving, initially in the “Deep Lake” portion, and subsequently along multiple ice streams in the Middlebury Bench, led to a T8 position which was subsequently followed by recession to an possible but not yet marked T9(?) position, entailing recession over a long distance, likely in a short time. The message here is that physiographic irregularities show their influence locally but with time lead to coalescing water bodies, and that standing water serves as a penetrant to accelerate recession. This suggests that concerns for present day ice sheets, ice caps, and glaciers should focus on such physiographic irregularities along and beneath ice masses. And in fact, this awareness is indicted by recent studies, as illustrated for example by a recent NY Times article.
From the point of view of global warming, the interpretation given here indicates that physiography played an important role in the ice sheets recession. It appears that the Middlebury Bench served as an important support for the Champlain lobe, enabling it to extend far to the south in the basin, but that calving, initially in the “Deep Lake” portion, and subsequently along multiple ice streams in the Middlebury Bench, led to a T8 position which was subsequently followed by recession to an possible but not yet marked T9(?) position, entailing recession over a long distance, likely in a short time. The message here is that physiographic irregularities show their influence locally but with time lead to coalescing water bodies, and that standing water serves as a penetrant to accelerate recession. This suggests that concerns for present day ice sheets, ice caps, and glaciers should focus on such physiographic irregularities along and beneath ice masses. And in fact, this awareness is indicted by recent studies, as illustrated for example by a recent NY Times article. 3 https://www.nytimes.com/2025/08/07/climate/argentina-perito-moreno-glacier.html?smid=nytcore-ios-share&referringSource=articleShare As suggested in the section of this present report on global warming, the Greenland Ice Sheet would seem to be especially pertinent to such a concern.
Footnotes: