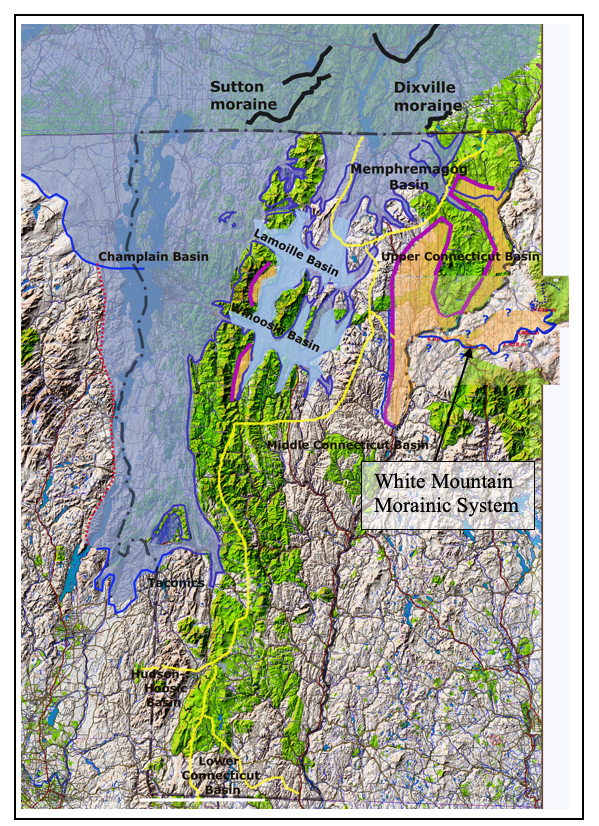
The T4 ice sheet and margin in Vermont are depicted on the map below by the blue shading and dark blue line. Again, owing to scale limitations, the delineation of this ice margin on this map is approximate, with more accurate markings given by VCGI map. The T4 margin was initially identified in the Memphremagog Basin where both stagnant ice deposits at the 1200 foot(366 m) level and Ice Marginal Channels at the 1400 foot level indicate the closely associated positions of both the stagnant and active ice margins. This led to the concept of a “hybrid” 1200-1400 foot(366 – 427 m) T4 ice margin consisting of both active and stagnant ice portions, relating to a recessional Style described as “Everything, Everywhere, All at Once, Progressive, and Continuing.” Evidence was subsequently found in the Champlain Basin likewise suggesting hybrid margins elsewhere.
The trace of the upper Ice Marginal Channels portion of the T4 hybrid margin at an elevation of 1400 feet(427 m) extends along the massif front in the Memphremagog Basin to the International Border in the vicinity of the Dixville moraine, with good alignment and comparable elevations to the moraine, supporting a correlation. Information regarding the Dixville moraine and this correlation is given in Appendices 1 and 3.
Stagnant ice deposits at the T4 1200 foot(366 m) level, again in the Memphremagog Basin, penetrate the massif in tributary basins marking long narrow ice lobes in these valleys, extending across basin divides with the Connecticut and Lamoille Basins, suggesting commingling of stagnant ice across basin divides at T4 time. This divide is marked by heavy yellow drainage basin boundary lines on the T4 map. Similarly, in the upper Missisquoi Basin, T4 deposits likewise extend across this basin with its neighboring Lamoille Basin to the south, likewise indicating comingling.
It should be obvious, but needs to be stated again and made clear that the Bath Tub Model as it is applied to the T4 level, margin, and time, and as well all other margins levels, and times does not suggest that the blue shaded area was everywhere at the same level or elevation. Obviously, the ice sheet had a gradient. It is only the margin that is suggested to be at the same approximate level. Further, as noted above in the discussion of Ice Tongue Grooves, the eastern margin of the Champlain lobe is marked by numerous stagnant ice deposits at the top of the T4-T6 and T4-T7 step-down sequence, but only the larger deposits in the larger tributary basins were used for the T4 margin delineation, recognizing that other deposits along the foothills likely were along lateral ice margins and thus may not have been equilibrated to the T4 level. These details are not shown on the map below owing to scale limitations.
T4 stagnant ice deposits in the Upper Connecticut Basin occur at and just below the 1200 foot(366 m) level which is close to the Basin floor. This includes many eskers as evident on LiDAR imagery, including the “Passumpsic esker” identified by Stewart and MacClintock as a remarkably major feature. The number of eskers in many of the Connecticut sub-basins is very large, seemingly in every sub-basin, indicating widespread stagnation, which is consistent with and indicative of en masse stagnation.
As previously indicated, Stewart and MacClintock identify a “moraine” in the Upper Connecticut Basin, said to be the best such feature known by them in New England. This “moraine” corresponds with a Scabby Terrain Tract marking the upper boundary of en masse stagnant ice(much of the orange colored area on the map) closely associated with, but at slightly higher levels than the stagnant ice deposits. As stated above, the upper elevation boundary of the Scabby Terrain Tract is marked by the lavender colored line on the above T4 map, extending around the northern and western perimeter of the Upper Connecticut Basin as far south as the Bradford vicinity, where outwash plain terraces are graded southward into Lake Hitchcock level deltaic deposits. The Scabby Terrain and associated stagnant ice deposits in the Upper Connecticut Basin occur at elevations below the divides with the Memphremagog Basin, and well below the uplands in the northern Connecticut Basin near the Quebec border.
The T4 Scabby Terrain tract is interpreted as indicating a third Disconnection, associated with feeder ice streams in the narrow Memphremagog tributary basins, resulting in en masse stagnation of the ice in the Upper Connecticut Basin, again as shown by the orange shading. This Disconnection, like those in T1 and T2 time occurred as a result of ice thinning across divides, specifically divides with the Barton, Willoughby, and Clyde Basins, which previously had served to supply active ice to the Upper Connecticut Basin in T3 time. These basins include “over-deepened lakes,” resembling the Finger Lakes in terms of the over-deepening and as well stagnant ice deposits at valley heads. 1This over-deepening is fascinating in and of itself and deserves further study. It is believed that the over-deepening may somehow reflect the ice sheet’s “struggle” to supply ice to the Connecticut Basin. The suggestion given below that the T4 margin is related to the Bethlehem-Littleton readvance raises intriguing questions as to the history of over-deepening. Ice blocks in these and many other depressions in the Memphremagog Basin remained as part of the T4 stagnant ice margin and persisted while the active ice margin receded northward to the next T5 position, again in the Style referred to as “Everything, Everywhere, All at Once, Progressive, and Continuing.”
As discussed above and in Appendix 3, the lower, younger portion of the “White Mountain Morainic System” identified by Thompson et al in the Ammonoosic Basin in New Hampshire likely correlates with the T4 margin, as depicted by the blue colored ice margin line as shown by the appendage added to the above map. Also as discussed above and in Appendix 3, Thompson et al indicate that their morainic system marks a readvance of the ice sheet. As noted, this readvance likely occurred in T3 time immediately preceding the Disconnection which took place in T4 time. It is believed that the T4 margin identified here immediately followed the readvance. It is suggested and supported, as discussed below, that the T3/T4 margins throughout Vermont and perhaps into New York represents this readvance . Of course, VCGI does not provide subsurface information, and thus the readvance of the T4 margin can not be independently evaluated by VCGI mapping. As discussed in many research report in the literature, ice margin oscillations, including “readvances,” can be localized, even with ice margin in some portions of the same glacier or ice sheet advancing while other portions remaining stable or receding, all at the same time. Obviously, more significant climatic events are more likely to be more regional.
In the Winooski and Lamoille Basins, Lake Winooski developed in late T4 time as approximately shown by the light blue shading on the above map, as mapped by Springston and Wright(ibid). A Drainage Line on and adjacent to T4 level kame terraces(not shown on this map) extended southward down the Black River Basin, across the divide with the Lamoille Basin. This Drainage Line correlates with kame delta deposits near East Hardwick and the western flank of the Worcester Range at the Lake Winooski level. At Locale W3 evidence is found indicating a close correspondence between Lake Winooski and the T4 ice margin, suggesting that drainage from remaining T4 stagnant ice deposits is graded into kame deltas associated with Lake Winooski in close proximity to the T4 margin. This evidence supports the proposition that early Lake Winooski waters penetrated the perimeter of an ice mass in the basin in T4 time. Whether or not an ice mass temporarily remained within this perimeter, as a Disconnected ice mass associated with en masse stagnation is uncertain, but Scabby Terrain evidence for such a mass has not been found.
Scabby Terrain patches at the T4 level and time are mapped along the western perimeter of Lake Winooski, in relatively deep drainage basins on the east side of the Green Mountain front range, as for example on the east flanks of Mount Mansfield, Burnt Rock Mountain, and Stark Mountain. These patches indicate Disconnections and isolation of ice masses in these local basins to the west of the T4 margin, caused by the extension of Lake Winooski along the western perimeter, effectively cutting off remnant ice masses in these valleys. The approximate location of this Scabby Terrain tract is likewise indicated by lavender colored lines on the above map, but again this depiction is schematic owing to scale limitations. As recognized elsewhere in this report, this information points to the effectiveness of standing water penetration along the ice margin.
It is possible that some of these Disconnected western ice masses may have remained active, as for example suggested by “moraines reported by me in the Lake Mansfield and Miller Brook area. Wright has studied this area substantially leading him to conclude that these ice masses were not a distinct phase of alpine glaciation. However, Disconnection of such ice masses seems likely.
The correlation of the T4 ice margin in the Memphremagog Basin with Lake Winooski serves multiple benefits in regard to not just documenting history but as well helping to validate the Bath Tub Model methodology and the T4 margin for northern and central Vermont as a bonafide ice margin for the area extending from the Quebec border southward over a distance of nearly 50 miles. Ice margin features, including both stagnant ice deposits and kame deltas, which correlate with Lake Winooski, extend around its perimeter, further supporting and extending the T4 ice margin. Interestingly, as noted above, the local elevation of the outlet for Lake Winooski near Williamstown as compared to the local elevations of ice margin and associated Lake Winooski strandline features along the northern reaches of the Lake indicate an isostatic surface gradient of about 5.7 feet per mile(1.1 m/km), which is close to but slightly higher than the 5 feet per mile(0.96 m/km) factor used in this report for making isostatic adjustments.
Also, as discussed elsewhere, Wright et al reported evidence of a readvance in the Winooski Basin. This evidence is at multiple locations, generally within the footprint of Lake Winooski, but additional readvance sites are also mapped by Wright et al at locations above the T4 margin . It is here believed that this evidence corresponds with the readvance associated with the WMMS, albeit as marked by a highly convoluted margin.
In the northern Champlain Basin, the T4 margin is well marked, again by numerous substantial stagnant ice deposits and by Bedrock Grooves (representing a hybrid active and stagnant ice margin), delineating the T4 eastern margin of the Champlain lobe against the Green Mountain western flank. Ice margin features at the T4 levels/times for the Champlain lobe are mapped southward along the eastern margin of the Basin along the foothills, into the mouth of the Vermont Valley near Rutland, where the margin is marked by a substantial stagnant ice deposits as mapped by Stewart and MacClintock, who for good reason identified these as especially remarkable ice margin features which they considered a “moraine.” In the main basin floor, ice margin features likewise trace the T4 margin around the nose of the Taconics to near Benson Landing, beyond which the ice margin for this lobe at T4 time was in New York.
Lake Vermont post-dated T4 time in Vermont, but likely occurred earlier in New York near the Hudson/Champlain divide. As discussed in Appendix 3, the T4 margin is suggested as possibly correlative with Franzi et al’s ice margin position 7 and De Simone and La Fleur ice margin position 12, but again this merits further study.
Footnotes: