The map below shows the T3 level and time ice margin(bright, neon blue line) and associated ice sheet(blue shading). Again, the trace of this margin is approximate, with a more accurate delineation given on VCGI maps. Details about the T3 margin and its history are given for Locale CB1 in Appendix 2.
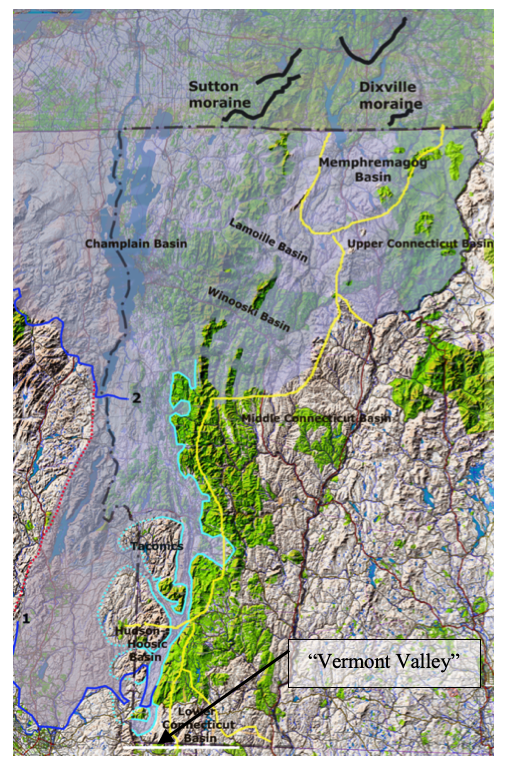
As can be seen, the T3 margin is only identified and mapped in southwestern Vermont, in the Vermont Valley, extending around the nose and thence southward along the west side of the Taconics.
The frontal tip of the lobe in the “Vermont Valley” is marked by a substantial stagnant ice deposit on the Valley floor in the Bennington area. Stewart and MacÇlintock identified this deposit as one of their more significant moraines in the State. The eastern margin of this lobe is marked by stagnant ice deposits and the lowest level of many Ice Marginal Channels which show that the this T3 margin represents the transition from the Nunatak Phase and the beginning of the Lobate Phase. This T3 eastern margin can be traced northward along the Green Mountain western flank to the Lincoln area, beyond which the ice margin was in the Nunatak Phase. Again, the T3 nunataks shown on the map were not mapped and are schematic. The western ice margin of the T3 lobe in the Vermont Valley extended northward from the Bennington area, with appendages extending westward into New York, and as well wrapping around the northern nose of the Taconic Mountains west of Rutland, thence continuing southward in the main Champlain Basin, all as part of the Champlain lobe. The frontal tip of the main Champlain Basin lobe is not identified by VCGI mapping and was south of Vermont, in New York State, likely extending close to the vicinity of the present day Hudson/Champlain divide, beyond the VCGI map area. This was before Coveville Lake Vermont time, at least in Vermont, where Coveville features are associated with the T6 ice margin.
The above map shows possible correlations of the T3 margin with ice margin positions in New York, as discussed in Appendix 3. The T3 margin is correlated with De Simone and La Fleur’s ice margin position #1 and Franzi et al ice margin position #2. As stated previously, the tracing of the T3 margin in Vermont was done independently, before De Simone and La Fleur’s report was seen. Their report shows multiple ice margins which in general suggest conformance with a “Bath Tub Model.” Their position #1, as drawn by them, extends into Vermont where it is close to Stewart and MacClintock’s Bennington moraine, and is aligned and at a similar elevation with the T3 margin shown here. Whereas the correlation of the T3 margin with De Simone and La Fleur’s position #1 seems reasonable, the correlation of this ice margin position with Franzi et al ice margin position #2 is based only on a crude comparison of elevations, and is highly speculative and uncertain. Its depiction here is only intended to illustrate a conceptual possibility for the regional configuration of the T3 ice margin in New York. As can be seen, Franzi et al’s ice margin position #2 shows a flattening of the Champlain lobe margin in the vicinity of the basin floor. Franzi(2024, personal communication) indicates that this flattening is schematic, intended to suggest a calving ice margin based on his opinion that the Champlain lobe frontal tip likely was fronted by Lake Vermont with a calving margin. If the correlation of the T3 margin with position # 2 is correct, in pre-Coveville time in Vermont, then the ice margin position #2 likely preceded the time when calving would have occurred. The red dashed line connecting Franzi et al position #2 with De Simone and La Fleur’s position #1 was schematically traced without great care or close examination of physiography. This entire issue of ice margin correlation between Vermont and New York obviously deserves closer study.
It needs to be understood and emphasized that the T3 margin is not shown elsewhere on this map northward beyond southwestern Vermont, because as stated above, the elevation of this margin is believed to be in the Nunatak Phase. The blue shading is intended to show that the ice sheet basically extended across the entire State of Vermont, to the east and north of the T3 margin as shown in southwestern Vermont, but not in the Middle and Lower Connecticut Basins which by T3 time had already stagnated en masse in T1 and T2 time. Whether or not the Lower and Middle Connecticut Basins were ice free in T3 time is unknown because the time required for the stagnant ice masses in these basins to melt is unknown.
As can be seen the ice sheet in T3 time is depicted in the Upper Connecticut Basin. At this point in the discussion of T3 time it is helpful to note that in order to better understand the relationship of the Vermont ice sheet eastern margin in T3 time in the Upper Connecticut Basin with ice margins in the same basin in New Hampshire, a report by Thompson et al for the White Mountain Moraine System (WMMS) was reviewed. Detailed aspects of this review are presented in Appendix C. This led to the understanding that the T3 and T4 margins are correlative with the WMMS, and are closely related. This is quite significant in as much as Thompson et al report that the WMMS represents a readvance of the ice sheet. This readvance is believed to have occurred in T3 time. The extent of the recession prior to the T3 readvance in Vermont is unknown. It is suggested that the T3 ice margin is correlated with the upper, older portion of the WMMS representing an ice lobe in the Connecticut Basin, with this lobe extending southward to the Bradford vicinity, where it is marked by a stagnant ice deposit with an outwash plain graded to Lake Hitchcock.
Whereas as already noted the T3 margin is not mapped across much of Vermont as the level of the ice sheet in T3 time is believed to have been in the Nunatak Phase, the identification of a T3 margin in the Connecticut Basin led to a closer re-examination of VCGI mapping of ice margins in northern Vermont. The evidence suggests that it may be possible, with further study, to delineate the T3 margin more extensively in Vermont. For example, in the headwaters of the Winooski and Lamoille Basin, the T4 ice margin is closely associated with the strandline of Lake Winooski, as is discussed further below. Above this T4 margin, are features which likely represent the T3 margin, indicating that narrow ice tongues extended across col divides into the Upper Connecticut Basin. Similarly, the T3 ice margin has not been marked in the Memphremagog basin but Ice Marginal Channels at the T3 level indicate active ice tongues in the Memphremagog Basin extended across divides into the Upper Connecticut Basin in T3 time. Thus, the T3 ice margin associated with the WMMS readvance is supported even though it is not specifically delineated in the Memphremagog Basin.
Also as noted elsewhere, at a late time as I was writing this report I had an Epiphanay, which was that the T3 and T4 margins together, as represented by ice margin deposits and associated Ice Margin Channels are closely related. These closely related ice margin deposits and Channels are so extensive and so evident on maps as to constitute a “Signature, ” a pattern that can be mapped across Vermont, independently from the usage of the Bath Tub Model, though obviously mapping is more effectively and reliably done by usage of all available evidence.
Thus, the point is made that T3 time was a very important time in Vermont. The above map does not show the White Mountain Moraine System in New Hampshire, but an appendage has been added to this map for T4 time, showing the correlation with the WMMS. Also, as discussed in Appendix C, whereas the T4 margin is correlated with the Dixville moraine in Quebec, the higher, older T3 ice margin may correlate with an older ice margin in Quebec but as yet this is undetermined.