The deglacial record in the Memphremagog Basin is substantial. Information about the glacial geology in this basin is provided by VCGI, which includes the State surficial geologic map and of course its multiple tabs. In addition, the Newport area was recently studied by Wright(2024). 1 Interestingly, Wright’s map includes commentary, a portion of which states: “During ice retreat, the thinning ice sheet became topographically controlled and generally flowed south, parallel to the region’s valleys(Fig. 5).” His Figure 5 depicts striation measurements which show NW-SE directions across higher elevation ridge lines along the Memphremagog basin western perimeter, but as well orientations much more closely in keeping with the physiography, as for example south to southwest in the Upper Missisquoi Basin. This commentary and striation information is taken here as supporting the concept of the “Bath Tub Model.”
Wright’s report and map contains substantial information which generally fits with the information obtained here with VCGI, including, for example, scattered stagnant ice deposits, small, local morainic ridges(which are identified here by LiDAR), deltaic deposits associated with proglacial Lake Memphremagog, and multiple drainage features. However, Wright does not evaluate regional deglacial history by the identification of multiple recessional ice margin positions. He infers an ice margin associated with proglacial Lake Memphremagog, which depicts an ice margin position, indicating that the ice margin portion in Quebec was taken from Parent and Occhietti(1999) but does not discuss the basis for his ice margin delineation in Vermont, which is traced into the lower Missisquoi Basin on the east side of the Green Mountains.The VCGI record includes Ice Marginal Channels, typical kame and kettle stagnant ice deposits, remarkably numerous, deep kettle holes or kettle-like (mfn} As explained in the portion of this report describing ice margin features, not all kettle-like basins in this area were true kettles. Some basins likely were formed previously by localized glacial erosion. basins, numerous and long eskers, kame deltas, and Drainage Lines, providing detailed information about ice margin positions.
In general, the Memphremagog Basin record supports the usage of the “Bath Tub Model,” but indicates that ice sheet levels and margins were extraordinarily complex, with overlapping temporal and spatial relationships. Deep kettles or kettle-like basins were occupied by stagnant ice for prolonged times, while the active ice margin receded to new positions, with drainage via eskers on or close to valley floors marking Drainage Lines, extending downgradient from the still-developing stagnant ice margin deposits, with drainage leading downgradient to receded active ice positions. Ice margins were relatively broad, wide zones, not sharp narrow morainic ridges as in some cases in neighboring Quebec, and not simple lines on a map.
As with all of Vermont drainage basins, the physiography of the Memphremagog Basin played an important role in the deglacial history of this Basin. As well, physiography also affected the ice sheet’s Style and Glacial Dynamics. The map below, taken from one of the physiographic maps presented previously, gives a sense of the Basin’s physiography and its relationship to neighboring areas:
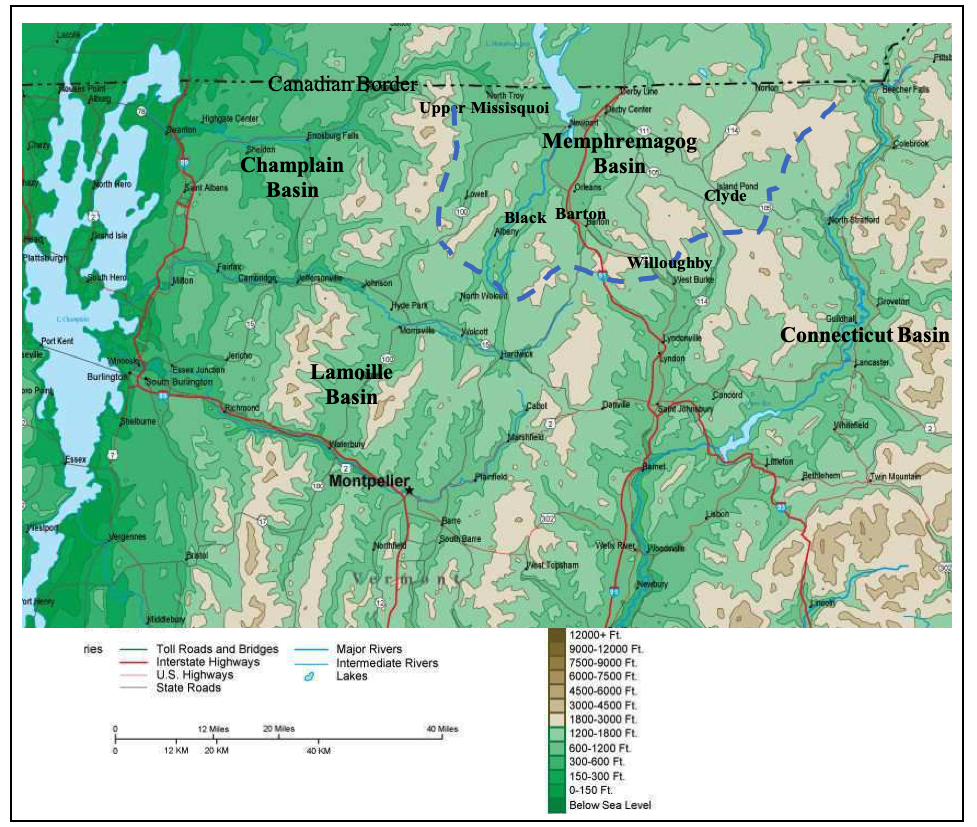
As can be seen, the Basin opens to the north, like the Champlain Basin, which favored the sustenance of the Memphremagog Basin ice lobe. The elevation of the floor of this Basin is significantly higher than the Champlain Basin, resulting in the final withdrawal of the ice sheet at an earlier(T6) time. The headwater area of the basin is a horseshoe shaped upland(delineated above by the blue dashed line, referred to previously as a “massif,” which defines the basin boundaries and, as well, the perimeter of the receding ice margin. The same massif extends across the northern Connecticut Basin, limiting the connection between the ice mass in that basin to the main Laurentide ice sheet to the north.
As labeled on the above map, the Basin is comprised of four sub-basins, the Clyde, Barton, Willoughby, and Black, which with the neighboring Upper Missisquoi Basin (associated with the Champlain Basin) gives the Basin a hand-like shape, with the palm as the Basin floor and the five, long and narrow finger-like drainageways cutting through the upland massif. The Barton headwaters are split-fingered into two digits. All five share drainage basin boundaries with their neighboring Connecticut and Lamoille Basins to the south.
These five sub-basins are marked by Ice Marginal Channels which are very numerous, documenting the progressive lowering of the ice sheet in the Nunatak Phase, the associated growth of nunataks, and the development of lobes in each basin in the following Lobate Phase. Ice Marginal Channels range from local elevations of about 2000 feet to about 1200 feet, with only slightly higher elevation adjustments for isostatic rebound owing to the proximity to the Canadian Border.
At the time of the highest and earliest Nunatak Phase, Ice Marginal Channels at an adjusted elevation about 2000-2100 feet in the Memphremagog Basin, deglaciation in southern Vermont in the Bennington area was more advanced, with the ice lobe in the Vermont Valley at the T3 margin, and with Disconnections of the ice sheet in the Lower and Middle Connecticut Basins at T1 and T2 times having already occurred.
The earliest and highest ice lobe margin in the Memphremagog Basin was T4 at the 1200-1400 feet elevation range, which is approximated by the different green shading on the above physiographic map (obviously with isostatic differences between present day elevations versus those in late glacial time but these differences do not fundamentally alter the appearance given by the map in this Basin). As shown, the green shading extends across the divides between the Memphremagog, Lamoille, and Connecticut Basins, which accounts for the commingling of ice lobes with extensive stagnant ice deposits and Drainage Lines at the T4 level across divides.
The following map is a VCGI base map, showing the major basin divides marked by purple colored lines for the five sub-basins, and the “local” elevations of divides for each col:2 Owing to the proximity of these divides to the Canadian Border, adjusted elevations are slightly higher than “local elevations.” for example the adjusted elevation of the Willoughby divide is increased from about 1280 feet to 1380 feet(390m to 421 m).
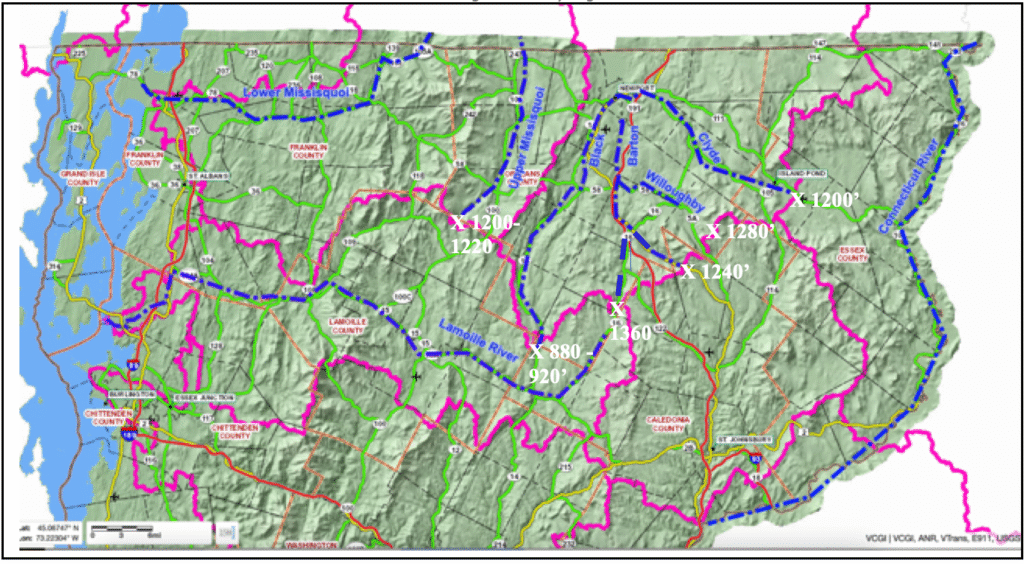
As can be seen, as just stated these divides tend to lie at similar “local” elevations of about 1200 -1300 feet, except the much lower and longer, and therefore as well lower gradient Black Basin.3My apologies to my metric minded readers for giving only English units here, as taken from VCGI which likewise only gives English units. 4 The similarity of basin divide elevations is not coincidental but reflects the geomorphic development of the Appalachian Mountains. This geomorphology was important to deglacial history, as discussed elsewhere. As discussed below, the Black Basin, being the lowest, played an especially important role for meltwater drainage, which extended across the divide and thereby providing a connecting link for Drainage Lines between ice margins in the Memphremagog and Lamoille Basins.
The five major sub-basins slope northward, and therefore resulted in a reverse gradient setting for proglacial lakes in front of the northward receding margin in this basin. However, in general, pronounced spillway outlet type channels are not evident (on VCGI) at the major divides. Instead, as just noted these divide areas tend to be occupied by stagnant ice deposits on both sides of the divides at the T4 ice margin level, indicating occupation by commingled ice across divides at this time.
As indicated above and as discussed below, as the ice sheet receded from the divide
areas at T4 time, local Drainage Line features (especially evident on LiDAR imagery), indicate complex drainage pathways in both directions in divide areas. While stagnant ice deposits were still forming in divide areas in T4 time, northward recession of the active ice margin in the Memphremagog Basin took place to a position between T4 and T5 margins, at the base of the massif front, where the active ice margin diverted northward drainage from the still-forming T4 stagnant ice margin deposits, westward toward and southward along a long Drainage Line in the Black Basin, across the divide into the Lamoille Basin, to a T4 ice margin associated with Lake Winooski in the Lamoille and Winooski Basins.
Slightly further recession of the ice margin in the Memphremagog Basin led to the T5 position which was associated with the Lak Nik Stage of proglacial Lake Memphremagog on the floor of the Basin near Newport, marked by numerous stagnant ice deposits and kame deltas at the 1000 foot(305 m) local elevation level. Recession in the Lamoille Basin to the T5 position was associated with Lake Mansfield.
Finally, ice margin features mark the T6 ice margin in the Newport area, with more substantial features presumed to be located across the Canadian border, although not marked on the previously shown Parent et Occhietti maps.
The Memphremagog Basin is unique for the presence of “overdeepened” lake basins similar to the Finger Lakes of New York, as discussed previously. The causal origin of such basins is an interesting subject, but goes beyond the scope of this report. However, with regard to deglacial history, it needs to be said that these basins likely were occupied by very large blocks of detached ice immediately north of the Memphremagog Basin divides in T4 time which likely persisted as the active ice margin retreated northward in the Basin to its T5 position. Similarly, as noted above, unusually large and deep kettle holes(?) are marked along the T4 and T5 ice margins, as identified in discussion of Locale details below. Many of these basins are mapped on the State surficial geologic map as glacial till, and therefore the over-deepened basin origin may be related to earlier glacial erosion. Regardless of the origin of these basins, ice blocks with such deep basins likely persisted as recession proceeded, with continuing development of T4 features while newer, younger T5 features were forming. This resulted in spatial and temporal overlap of ice margin features in a Style referred to as “Everything, Everywhere, All at Once and Continuing” to underscore the important spatial and temporal overlap of the ice margins, resulting in a more complex “rings on a “Bath Tub”” story than simple, progressive recession. 5 Other ice margins elsewhere, such as in the Lamoille Basin along the T4 1200-1400 ice margin south of Hardwick and in the Winooski Basin at Mud Pond south of Williston, are similarly marked by unusually deep kettle holes. The relationship between pond depth and ice margins in Vermont deserves further scrutiny.
Multiple Locales are identified and discussed for the Memphremagog Basin. A discussion of these is made more difficult because of the complexity of local detail, all of which seems so interrelated as to make it challenging to distill this story in a simple, coherent way … reflecting a “hip bone is connected to the knee bone is connected to the shin bone” type of story for the recession of ice margins in this Basin. To assist the reader in both seeing the details and as well not becoming lost in the process, the following map, taken from above, shows the locations of Locales as discussed below:
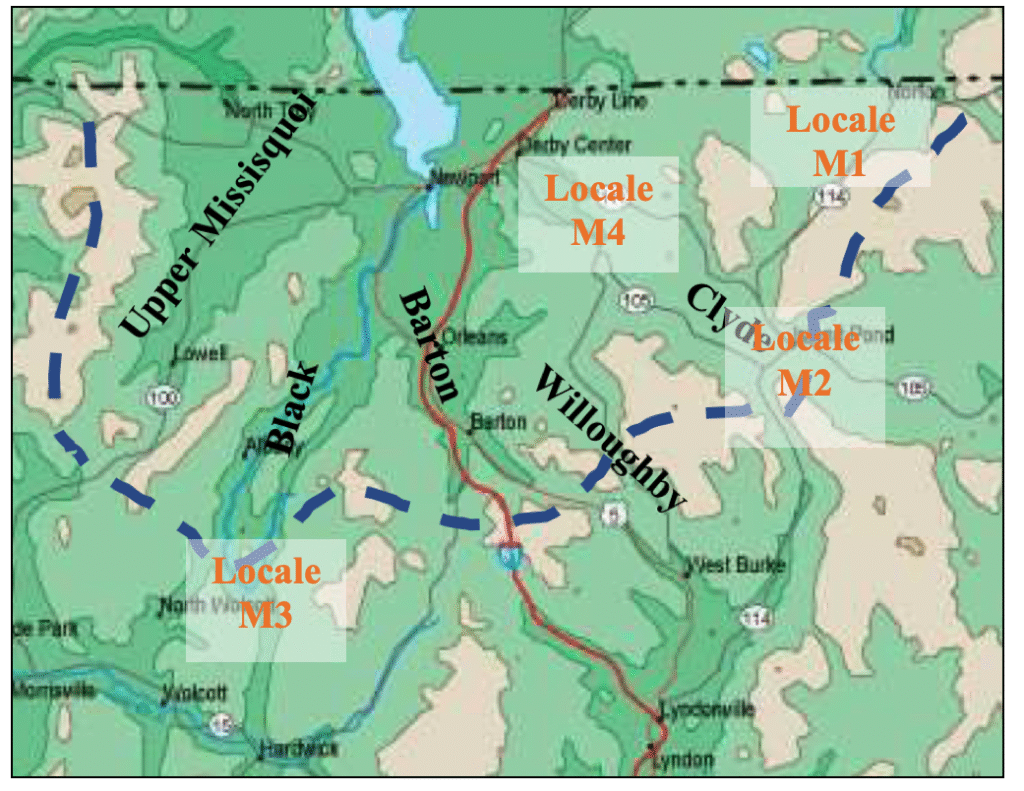
Locale M1 illustrates the ice margin features in the Clyde Basin where a significant correlation with the Dixville moraine in Quebec is suggested. Locale M2 is in the area of a major interfluve drainage diversion along the massif front, tracing a Drainage Line which extends southward down the Black Basin. Locale M3 follows the Drainage Line across the Memphremagog/ Lamoille Basin divide with a connection to ice margins in the Lamoille Basin near Locale L2. Locale M4 is further north, on the floor of the Basin in the Newport area, where younger ice margin positions mark the final withdrawal of the ice sheet from this Basin.
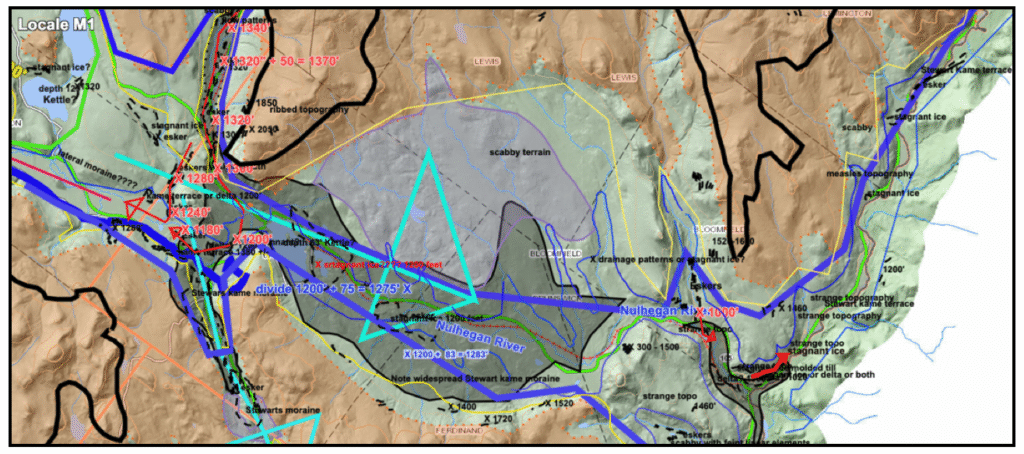
a. Locale M1
This Locale is a large area, including the Holland Pond area, around the corner from the Dixville moraine, extending into and including headwater portions of the Clyde Basin and Nulhegan sub-Basin in the Connecticut Basin. The previous physiographic maps give a general overview regional perspective for the entire Memphremagog Basin. The following maps show drainage and topography in more detail, again with the aim of providing the regional context for the following details. The first map shows all of northern Vermont, and the second map gives a larger perspective of the Locale M1 area.

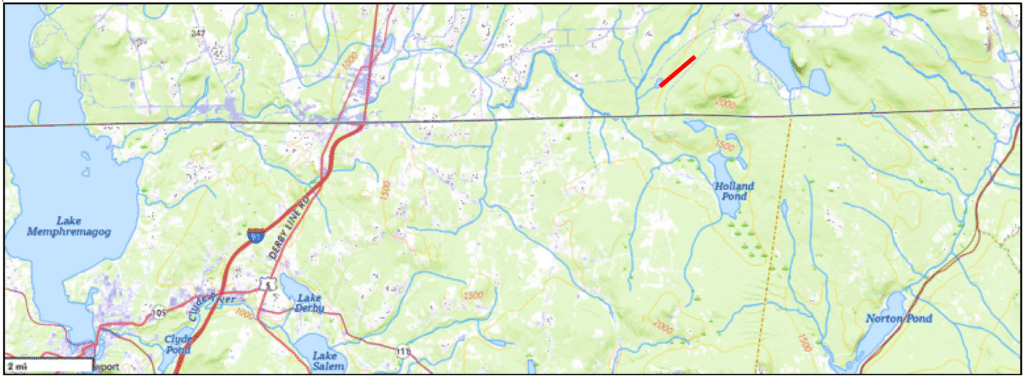
To aid with this perspective the above map is marked with the approximate location of the Dixville moraine(short red line). The moraine is located near the base of the same upland massif area as previously described, a few miles northwest of Holland Pond.
The map below is the Project sheet from VCGI showing the geological markings in the Locale M1 area:
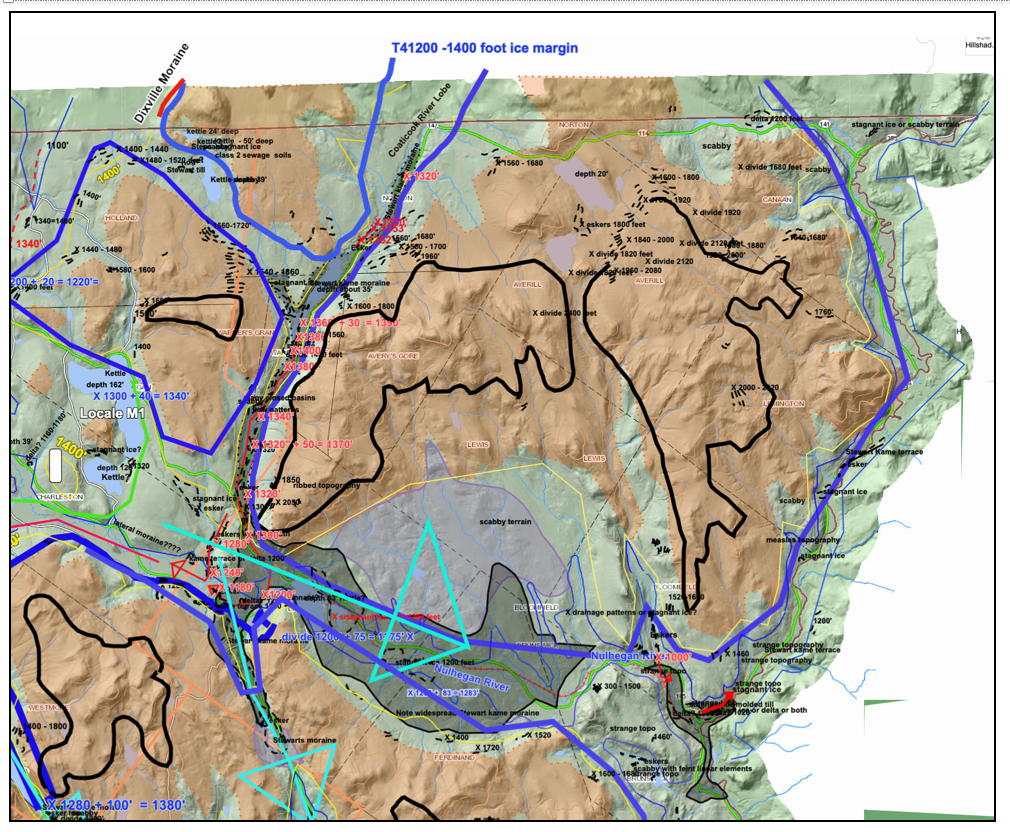
As with all Locales, across the entire State of Vermont, deglacial history is a story, with remarkable detail. Telling this story in the Memphremagog Basin, and even in this Locale is challenging owing to the substantial amount of detailed information, and the overlapping temporal and spatial relatinships. The following introduces Locale M1 with and by several screen shots of a portion of the VCGI Project map to give a better, more detailed illustration of the immediate Holland Pond vicinity, just south of the Canadian Border and relatively close to the Dixville moraine.
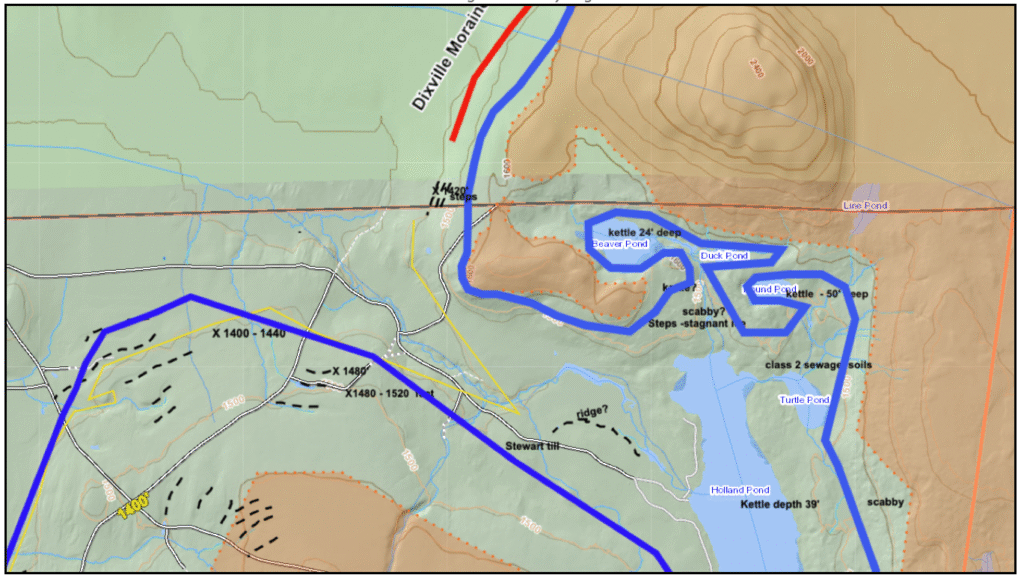
This first screen shot below is the standard or typical VCGI start up screen for the Project Sheet with geological markings:
-
- The ochre color shaded area indicates elevations above 1600 feet, and the thin yellow line marks the 1400 foot(427 m) contour. These were marked in many places on VCGI to give a better understanding of the topography. The heavier blue line is the T4 ice margin. As previously noted, such markings on VCGI are challenging owing to the mechanical quirkiness of the website, and as a result, these features are approximate, not precise tracings.
- Again, the approximate location of the Dixville moraine, taken from maps drawn by Parent et Occhietti is marked by a red line.
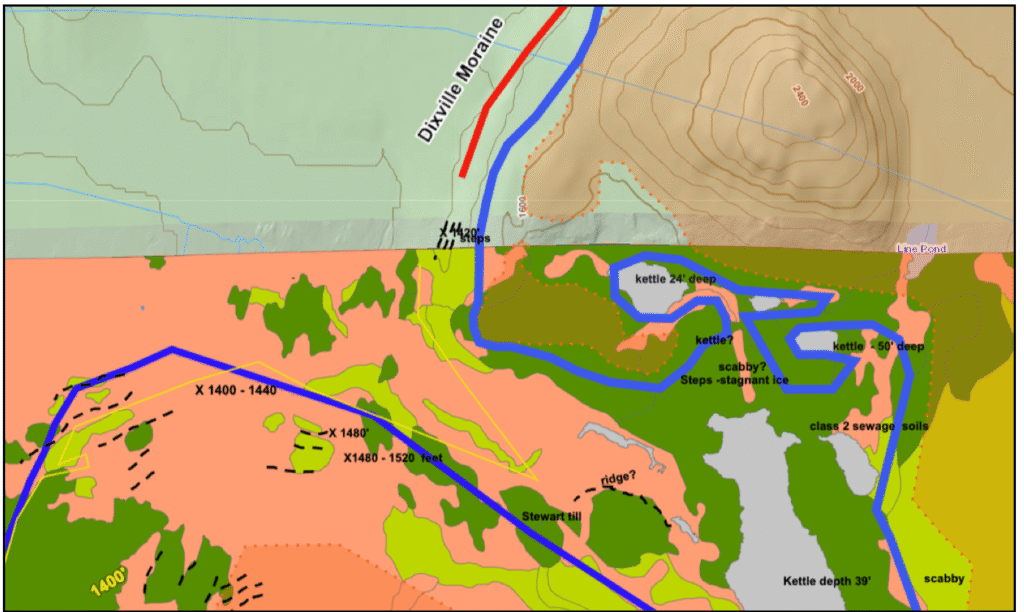
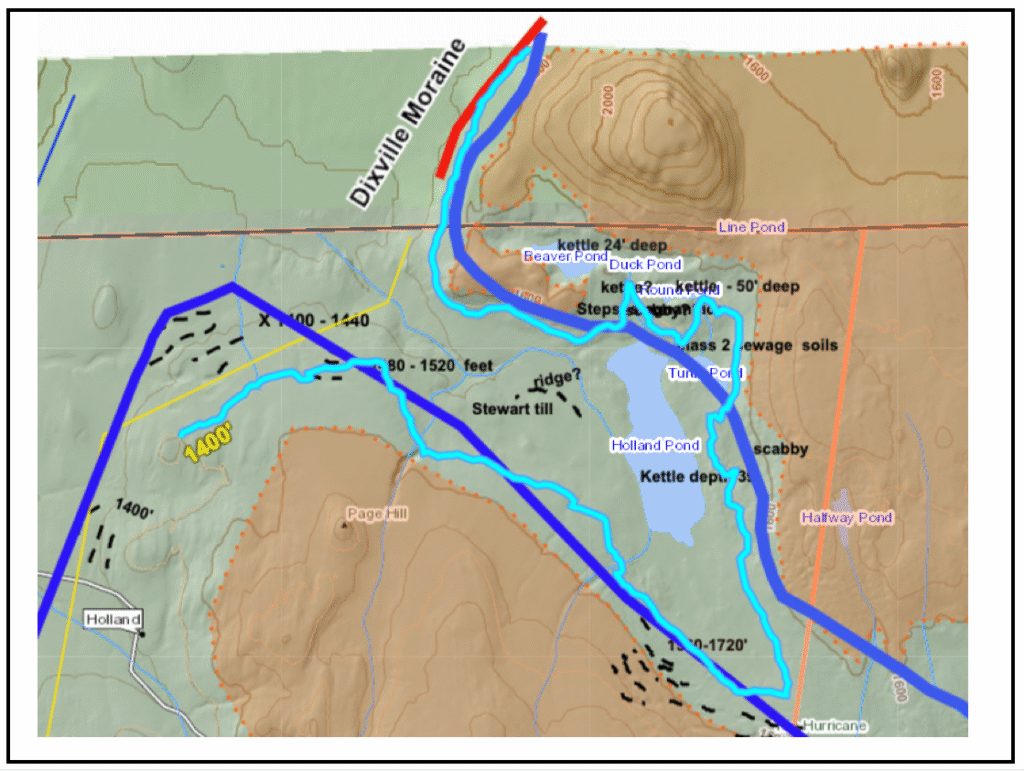
The screen shot below shows the same area with LiDAR imagery:

This screen shot shows Ice Marginal Channels as short dashed black lines, in some cases with local elevations added. This screen shot illustrates the conformance of the Ice Marginal Channels at the 1400 foot(427 m) level with the local physiography, in alignment with the Dixville moraine in Quebec. In a sense, this supports the Bath Tub Model, albeit in a limited area. At an early stage of mapping features in the Memphremagog Basin it was recognized that whereas stagnant ice deposits marking the ice margin at the 1200-1400 foot(366- 427 m) level extend across the Basin toward the Dixville moraine, these are generally slightly below the elevation of the Dixville moraine. In contrast, Ice Marginal Channels along the 1400 foot(427 m) contour give a better alignment. This is taken as evidence for correlation of the T4 active ice margin with the Dixville moraine. However, based on Wagner reconnaissance in Quebec it appears that ice marginal features nearby across the border in Quebec likewise include sprawling, scattered stagnant ice deposits.
No definite, distinct, and substantial ridge-like morainic deposits mark the T4 margin on the Vermont side of the border. However, the LiDAR imagery shows a small, low, short, and thin ridge, as marked immediately west of Holland Pond. This ridge is about 50 feet(15 m) wide, with a height of about six feet (2m). Whereas Franzi has identified morainic ridges in New York with similar LiDAR signatures(2024, personal communication), this feature in Vermont is of uncertain origin and likely is not an extension of the Dixville moraine.
LiDAR and topographic contour information is not suggestive of typical kame and kettle type stagnant ice topography in the area of the above screen shot. However, north of Holland Pond is an area identified as Scabby Terrain. The following map from VCGI’s tab shows the State surficial geology information tab for this same area:
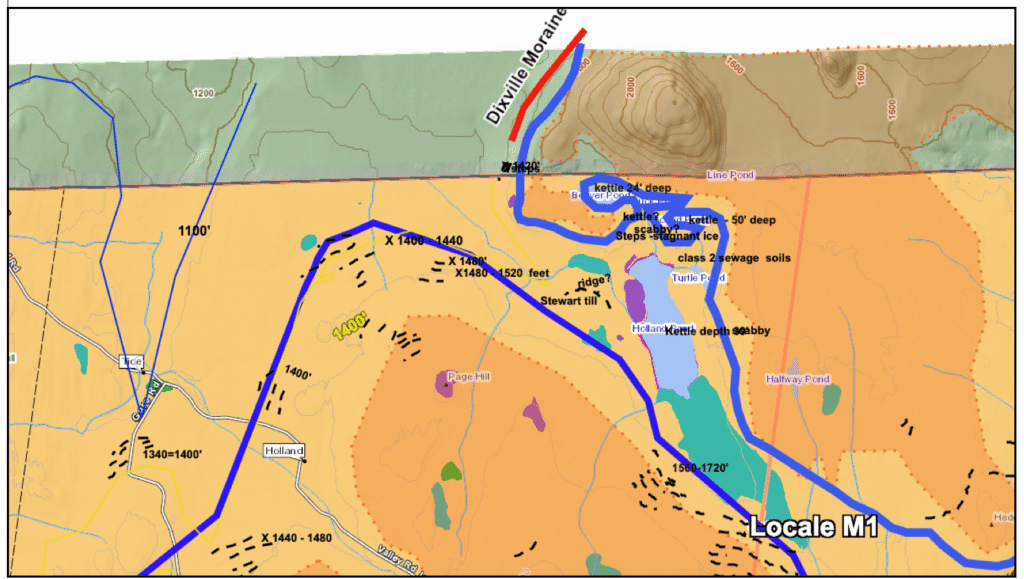
The dusky yellow color on this map indicates glacial till, likely ground moraine except for bedrock exposures along the west shore of Holland Pond. The following screen shot is again the same area, but with the sewage soil favorability tab:
As explained previously, soil sewage favorability mapping was done by the Soil Conservation Service under the direction of Bruce Watson. Based on Wagner personal communication with Watson and both research and consulting experience while at UVM related to the development of the SCS maps, whereas sewage soil favorability relates to several factors, a key element is that soils rated as favorable( the green areas on the above map) typically are relatively deep, granular, permeable, and well-drained. This indicates a more gravelly soil with a relatively sandy matrix. In fact, as noted elsewhere herein, Stewart and MacClintock in their report describe soils in the Connecticut Basin associated with their “moraine” with kamic topography but mapped here on VCGI as Scabby Terrain as a more granular, sandy textured till. Thus,the distribution of Scabby Terrain and favorable soils on the above screen shots is taken as an indication of low grade stagnant ice deposit, showing a correlation with the T4 1200-1400 foot(366 – 427 m) ice margin and the Dixville moraine. The exact manner of formation of this particular Scabby Terrain patch, as to the possibility of a Disconnection, is uncertain.
If in fact this area was occupied by stagnant ice, then the relatively deep ponds in the area, as shown on the above screen shots, likely represent kettle holes, consistent with a stagnant ice margin.
This screen shot shows a remarkable series of Ice Marginal Channels found immediately south of Holland Pond in an area identified on VCGI as “The Hurricane.”
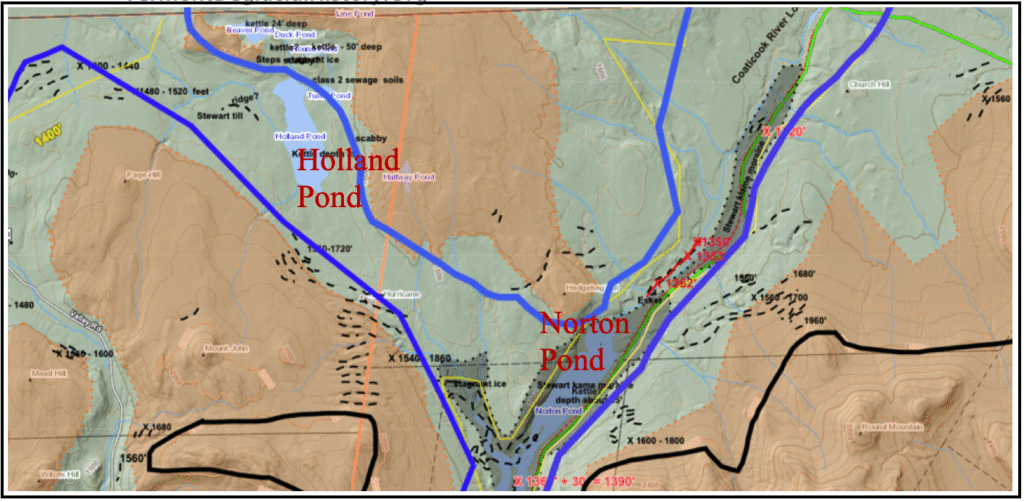
These Channels indicate the ice lobe margin levels in this valley progressively lowered from local elevations of about 1860 feet to about 1540 feet, with the ice lobe margin in conformance with the local topography. These and other Channels east of Norton Pond, represent the Nunatak Phase which is marked by steady, progressive lowering of the ice margin and its increasing lobation in conformance with the physiography in the Holland Pond/Norton Pond Basins. These channels are believed to mark the margin of active ice, and together suggest progressively lower and smaller lobate forms which grade into small stagnant ice deposits north of Holland Pond but especially in the lobe tip in the Pherrins River Valley, a Clyde tributary immediately south of Norton Pond. These deposits, along with additional Ice Marginal Channels, trace the ice lobe from the Holland Pond Lowland, into the Norton Pond lowland, and continuing southward via Pherrins Valley into the Clyde valley, again with the lobe margin generally in conformance with physiography.
The following is a screen shot of an early version of VCGI mapping in this area, showing the 1400 foot(427 m) contour highlighted, giving a sense of the T4 ice margin correlation with the Dixville moraine.
Just as Parent et Occhietti have noted that moraine segments in Quebec are discontinuous, the evidence of the ice margin immediately south of the Dixville moraine in Vermont, specifically in the vicinity of Holland Pond, other than Ice Marginal Channels, is scant.
Stagnant ice deposits in Pherrins Valley Basin including numerous eskers and esker segments, indicating meltwater drainage within the masses, close to the present day basin floor, as shown on the map below(again taken from an early but still valid mapping version).
These deposits include long discontinuous esker remnants, over a distance of about 9 miles, with contour elevations(numbers in red) showing a southward gradient from about 1400 feet to 1180 feet indicative of subglacial water flow toward and into the Clyde Valley floor. Importantly, this Drainage Line can be traced northwesterly downgradient on the valley floor, indicating free subaerial drainage for a short distance, beyond the esker terminus.
Across the valley from Pherrins River is Oswegatachie Brook(not shown), a northward draining tributary to the Clyde, which likewise contains a long tract of stagnant ice deposits, a portion of which is suggestive of an esker, adding to the story of widespread stagnant ice in this area at about the 1200-1400 T4 foot(366 – 427 m) level, with internal meltwater drainage in stagnant ice masses in a downgradient direction to the Clyde Basin floor.
The VCGI map below identifies substantial stagnant ice deposits in the floor of the Clyde valley(gray shading), approximately at and immediately below the 1200 foot(366 m) elevation(marked by the thin blue line), extending across the drainage divide with the Nulhegan River Valley, with no evident spillway or outlet channel. Stewart and MacClintock mapped substantial, extensive kame moraine in the upper Clyde valley floor. VCGI mapping suggests a more limited extent of such deposits than Stewart and MacClintock’s map, but such deposits are substantial in the Clyde Valley and, over a wide margin extending from approximately the massif front to and across the divide and continuing down the Nulhegan Valley, at elevations ranging between 1200 and 1400 feet.
Also noted is Scabby Terrain just to the north of the stagnant ice deposit, indicating Disconnection from the ice sheet. The large sage colored arrows are intended to indicate ice flow directions, across the divide from the Memphremagog into the Connecticut Basin prior to the Disconnection. The T4 ice margin is marked by the heavier blue line, which perhaps could be redrawn to include the Scabby Terrain. This Scabby Terrain is part of the disconnected ice deposits, as discussed below in the Connecticut Basin. Also, as shown on the above screen shots are present day lakes and ponds which are very common along the T4 and T5 ice margins in the Memphremagog Basin. As already noted, these are referred to as “kettle” ponds but whether or not they are true kettles, meaning ponds developed in locations of former ice blocks in stagnant ice margins is uncertain. Some of these ponds apparently are in basins in areas of till ground moraine and thus appear to be depressions in a landscape, perhaps predating deglaciation. Many but not all have exceptionally large depths. For example, notable ponds include Holland Pond, Norton Pond, Island Pond, Lake Derby, Lake Salem, Seymour Lake, and Echo Lake. 6 The depth of these lakes and ponds is given online, as water depth, with no information about depth to bedrock and the nature of the sediment infill. Included in this category are “overdeepened lakes” such as Lakes Willoughby, Seymour, Elligo, and Caspian.
Regardless of whether or not they are true kettles in the strictest sense, meaning in association with stagnant ice deposits, these present-day lakes and ponds are in depressions which likely were occupied by large ice blocks, some as true kettle holes, across a broad 15 mile wide swath including and extending across the T4 -T5 ice margins. Given the large depth of these basins, these ice blocks likely were long lasting, extending from T4 1200-1400 foot(366 – 427 m) level time near the Clyde-Nulhegan divide(Island Pond) to the later T5 1000 foot(305 m) level time in the immediate Newport vicinity(Lake Salem), which is documented by Drainage Line evidence.
b. Locale M2
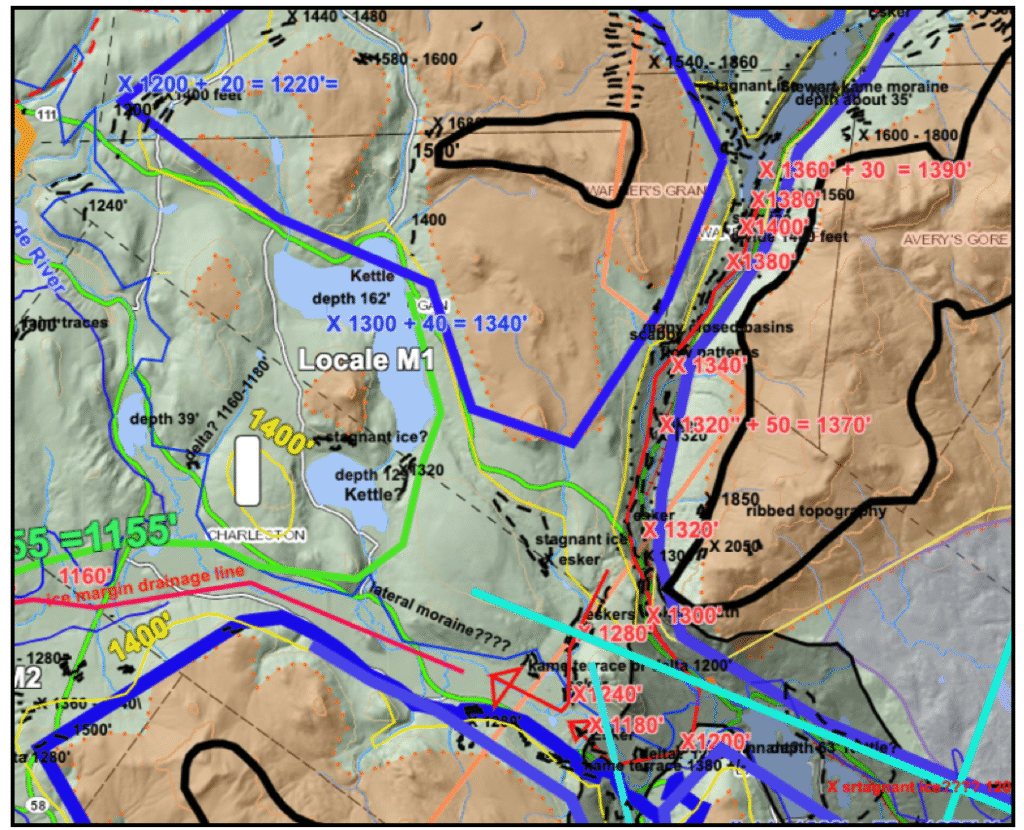
This Locale is in the area at the foot of the aforementioned massif. The map below, taken from VCGI, shows Locale M2:
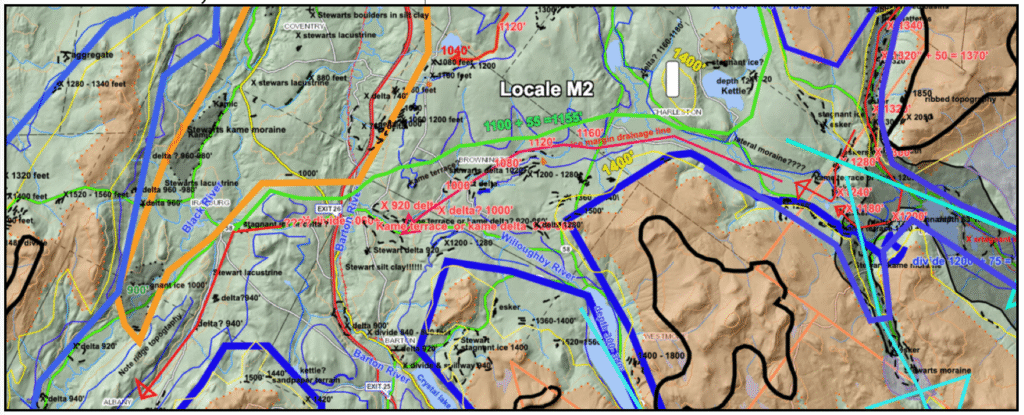
The T4 ice margin is marked in the Clyde Basin by a ten mile wide stagnant ice deposit which extends across the divide with the Nulhegan sub-Basin in the Connecticut Basin. This includes Island Pond which is a 63 foot(19 m) deep kettle hole. As noted above, the Pherrins River Basin esker which marks the T4 margin indicates a subglacial Drainage Line extending southward onto the floor of the Clyde Basin, in turn thence proceeding as subaerial drainage a short distance northwesterly, down the Clyde Basin floor, grading into a Drainage Line which then extends across the interfluves between the Clyde and Barton Valleys. Details for this Drainage Line in the Barton Basin are uncertain, with the possibility of an intermediate proglacial lake in the Barton Basin, but the Drainage Line is presently marked to extend across a low divide into the Black Basin.
Again, the interfluve Drainage Line from the Clyde Basin to the Black Basin extends along the foot of the massif front, at the southern margin of a broad, slightly undulating, triangular shaped plateau. Ice Marginal Channels on the northward sloping massif front indicate progressive lowering of the active ice margin pressing on the massif front from local elevations of about 1500 feet(457 m) to about 1200 feet(366 m) at the foot of the massif. Immediately north of the massif front is a low transverse East-West topographic trough. To the north of the trough is the aforementioned triangular shaped plateau.
North of this sloping massif front, the plateau is marked by lower Ice Marginal Channels and Drainage Lines, interpreted as indicating a northward receding ice margin, marked by Drainage Lines indicating interfluve drainage along the ice margin at multiple positions, progressing between the T4 and T5 ice margins. The southernmost of these interfluve Drainage Lines, at the foot of the massif is especially well develop, marked by elevations as indicated on the above VCGI map. An ice margin position marked in green at an adjusted elevation of about 1155 is inferred as the approximate position of the ice margin associated with this Drainage Line. This represents an ice margin between T4 and T5 times.
Again, this Drainage Line is traced as extending first from subglacial stagnant ice esker drainage in the T4 margin near Island Pond, including from stagnant ice masses in the Pherrins and Oswegatchie Basins, thence via subaerial drainage northwesterly down the Clyde Basin floor, to the ice margin, as marked in green on VCGI, to the Black Basin. This same Drainage Line is traced southward in the Black River Basin, as discussed further in Locale M3 below.
This Locale is located in the Black River Basin showing the continuation of the above Drainage Line, southward across the divide with the Lamoille Basin, to the vicinity of Locale L2 near Hardwick, as discussed above, where it is associated with a T4 ice margin kame delta feature associated with Lake Winooski. Locale M3 is shown on the following VCGI map:

Like elsewhere, Ice Marginal Channels document the progressive development of lobate ice masses in the Black Basin at an early time. The T4 1200-1400 foot(366 – 427 m) ice margin, marked by a thick blue line, shows that the Black Basin was occupied by an approximately six mile wide ice lobe at T4 time, with a large stagnant ice block in the Lake Elligo Basin, one of the “overdeepened lakes in this region with a reported depth of about 100 feet. The T4 lobe extended southward across the Black/Lamoille divide, to a kame delta in the Hardwick area corresponding with Lake Winooski, as discussed in Locale L2. The aforementioned Drainage Line, which is identified partially by LiDAR drainage features, some of which are on sloping till mantled hillsides and some extending along the tops of T4 kame terraces, and partially by elongate tracts of granular soil materials identified on VCGI soil sewage suitability and aggregate tabs, extends southward to a kame delta complex at Hardwick at the Lake Winooski level.
d. Locale M4
The map below shows the area of this Locale:
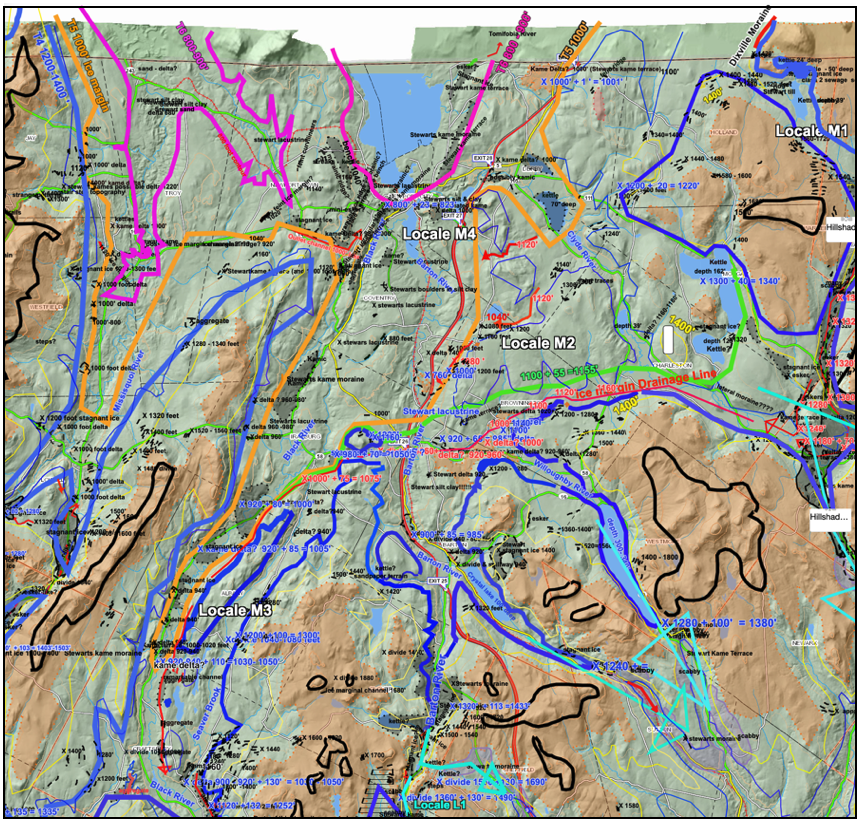
This map area was made as large as possible to give a sense of most, albeit not quite all of the southeastern portion of the Memphremagog Basin, and still retain some legibility of feature labels. However, as in other locations within this Basin, many features of interest and importance are not legible at this map scale.
As described above, the map above shows the four Memphremagog sub-Basins, plus the Upper Missisquoi Basin, which together tell the story of the Memphremagog lobe deglacial history. As can be seen and already indicated Ice Marginal Channels are numerous and widespread in the map area, clearly showing the presence of discrete ice lobes which developed in each of the five sub-Basins. These features are extensive above about 1200-1400 feet, up to about 1500 feet, marking the progressive ice sheet lowering of the ice sheet and growth of nunataks in the Nunatak Phase. Ice margin features mark the beginning of the Lobe Phase at T4 time at an elevation of about 1200 -1400 feet, when discrete lobes first formed in the five sub-Basins, as demarcated by the heavy blue lines on the above map. By contrast, in southern Vermont, for example in the Vermont Valley, ice sheet Disconnections occurred earlier, at T1 and T2 times, at adjusted elevations(so as to be comparable with features across the State) of 2700-3120 feet and 2600 feet respectively, and initial lobe recession began at T3 time at an adjusted elevation of about 2000 feet. These contrasting elevations indicate that ice sheet recession occurred earlier and was substantially more advanced in southern Vermont, as previously noted, which is to be expected.
Also as previously indicated, all ice margins drawn on VCGI represent broad intervals of time, as is evident by the T4 time extending from 1200 to 1400 foot(366 – 427 m) elevations of the ice sheet. At the beginning of T4 time In the Memphremagog Basin, the ice lobes in each sub-Basin were at elevations close to divides with neighboring Lamoille and Connecticut Basins, with ice extending across divides and commingling with ice in neighboring basins. The T4 ice margin is marked by extensive and substantial stagnant ice deposits at valley heads areas. As indicated above, Drainage Lines show the pathways of meltwater drainage, including both within stagnant ice masses, peripheral to ice sheet margins, and in some cases extending downgradient such as described above for the drainage line extending from the Clyde Basin, across interfluves into the Black Basin, and southward across its divide with the Lamoille Basin to a Lake Winooski kame delta marking at T4 time.
The story of Locale M4 in the Memphremagog Basin relates predominantly to the orange colored T5 1000 foot(305 m) and maroon colored T6 800-900 foot(244 – 274 m) ice margins, as identified on the above VCGI screenshot. The T5 ice margin is well documented, similar to ice margins elsewhere, but the association with kame deltas at the approximate elevation of elevation of about 1000 feet is particularly significant, as possibly correlative to the Sherbrook maximum phase or Lak Nik stage of proglacial Lake Memphremagog as described in research reports in Quebec, and by Wright. It seems likely that proglacial Lake Memphremagog was controlled by an outlet at a divide between the Lamoille and Memphremagog Basins at Lake Elligo, again as identified by Wright. However, it is interesting to note that the elevations of kame deltas in the East Hardwick areas are at a comparable elevation, which is correlated with Wright’s Lake Winooski, raising the possibility that the Sherbrook phase of proglacial Lake Memphremagog may have been an extension of Lake Winooski.
By contrast, the T6 ice margin is not well represented in the Memphremagog Basin(unlike in the Champlain Basin) which, as previously indicated, may be explained by the elevation of the floor of the Memphremagog Basin being too high for more substantial ice margin features at T6 time.
Whereas the foregoing gives the big picture overview for Locale M4, looked at more closely at larger scale, intriguing and likely important features are evident. For example, the following screen shot shows LiDAR imagery in the area southwest of Lake Memphremagog:
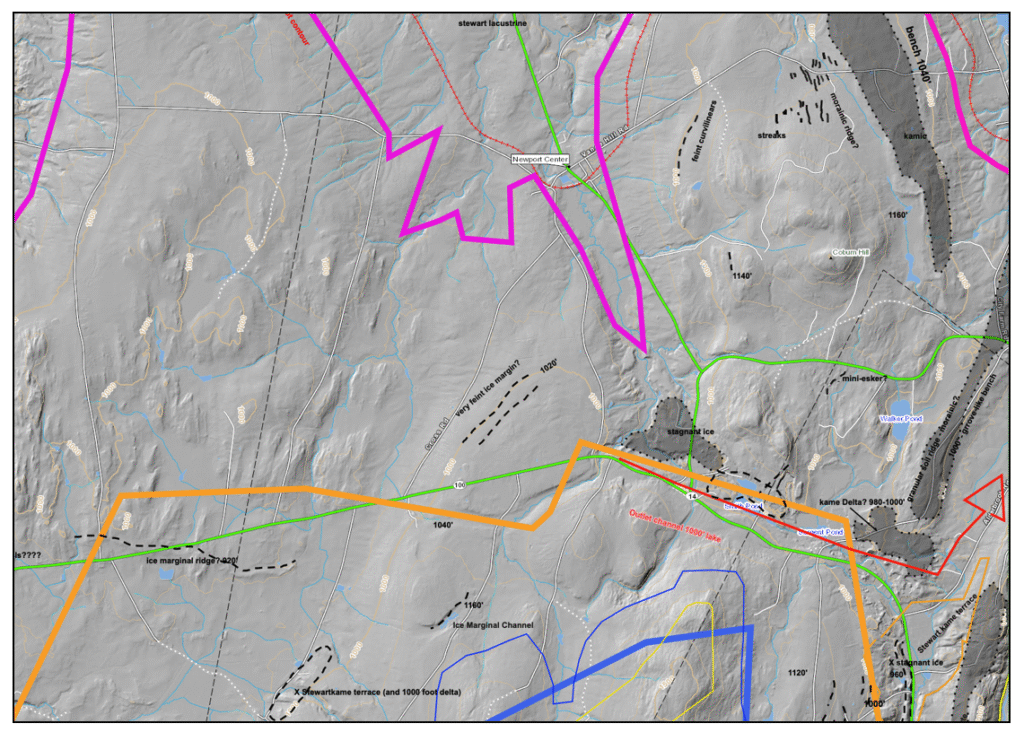
This imagery show features identified as:
- “ice marginal ridge”(This ridge corresponds with a feature identified as a moraine by Wright,)
- “very feint ice margin”
- “feint curvilinears”
- “morainic ridges”
- “mini-esker?”
The nature, origin, and significance of these features, and others identified in this Basin, are uncertain and deserve further, more detailed study, including up close and personal examination in the field. Whereas Wright’s work presents exceptional detail about such features, the interpretation and meaning of such details in terms of specific ice margin recession is not discussed by him and remains uncertain.
The correlation of ice margin features in the Newport area with the Quebec moraines is uncertain but is likely that the 800 foot(244 m) level correlates with the Sutton moraine at apparently the same elevation. If so, the features ranging from the 1200-1400 foot(366 -427 m) level, to the 800-1000 foot(244 – 305 m) levels in the Memphremagog Basin may correlate with the multiple ice margins, ranging from Dixville to Sutton mapped in southern Quebec by Parent et Occhietti.
Footnotes: