This region includes four Locales, CV5 – CV8, mostly in the Missisquoi Basin, except for Locale CV7 which is in the Colchester and Essex areas. Before delving into the details of each Locale, an overview perspective will be helpful. Physiographically, northwestern Vermont is the bottom of the Champlain Basin “Bath Tub,” and thus writes the final chapter of deglacial history for the State. Like the discussion above in regard to the physiography related to calving and Middlebury Bench, the floor of the basin in this area is not flat, with terrain difference that significantly affected the ice margin. The following map, taken from the series of physiographic maps previously introduced, illustrates the regional physiography:
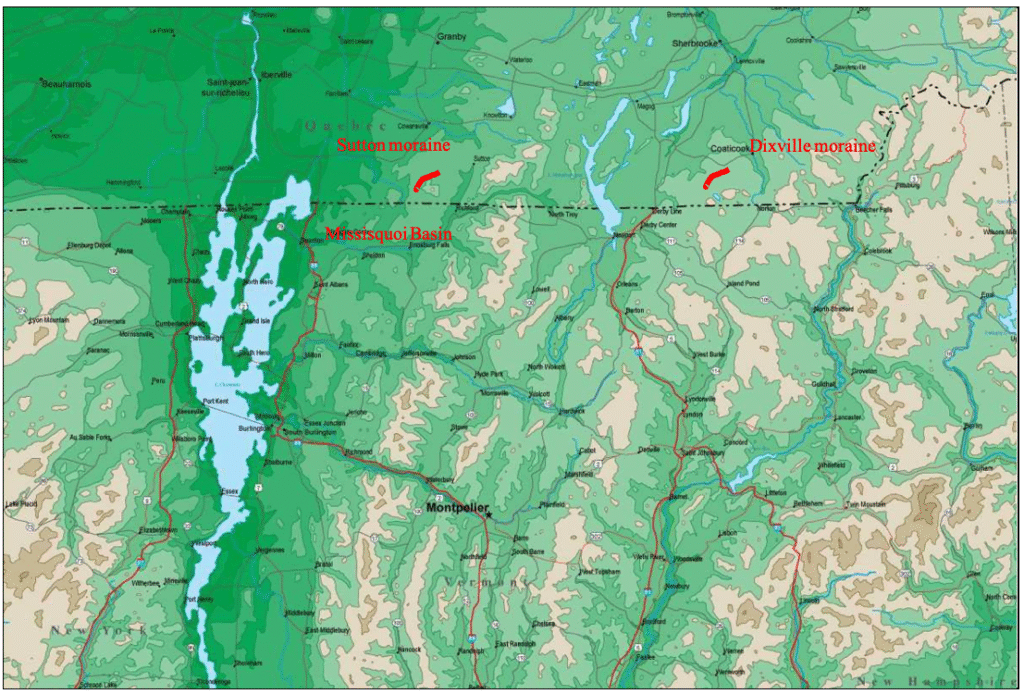
This map shows the approximate locations of the Missisquoi Basin and the Dixville and Sutton moraines in Quebec, as mapped by Parent et Occhietti and others. 1The Sutton moraine as mapped by Parent et Ochietti extends across the Pike Basin, in Quebec, near Sutton, and is not shown as extending southward in the Pike Basin. However, it seems reasonable to presume that the receding ice margin extended southward in this basin. The interpretation given here in fact suggests such an interpretation. However, as was common throughout Vermont, the receding ice margin was a step-down type such that it is possible that both interpretations are compatible. As indicated, the Dixville moraine is correlated with the T4 ice margin and the T6 ice margin with the Sutton moraine in Quebec. The evidence in the Missisquoi Basin indicates that the T4 – T8 ice margins were in a step-down sequence, which, as repeatedly stated for many locations throughout the State can be likened to the rings on a slowly draining “Bath Tub.” The T7 margin was associated with Fort Ann Lake Vermont and the T8 margin with the Champlain Sea.
The four Locales presented below relate to the delineation of the T6, the T7 foot, and the T8 foot elevation ice margins, again marking the final chapters of Vermont deglacial history
Locale CV5 is in the Berkshire and Enosburg Falls area, which is at the southern end of a foothill upland area marking ice margins T6-T8. Locale CV6 is at the mouth of the Missisquoi Basin foothills, where the same ice margins turn the corner with the Champlain Basin. Locale CV7 is further south, in an area marking the southern extension of the ice lobe in the Champlain Basin in T7 time, in the Essex and Colchester vicinities, on the northern fringe of the Winooski Basin. Locale CV8 is in the northwest corner of the Champlain Basin (Missisquoi Basin), west of Locale CV5 and north of CV6.
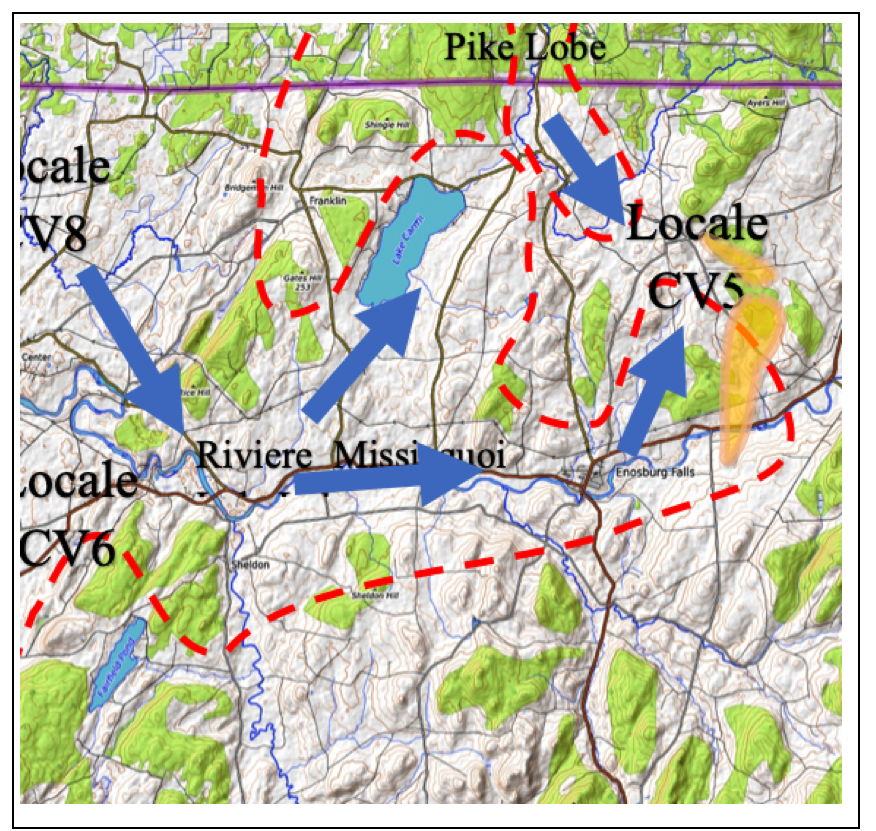
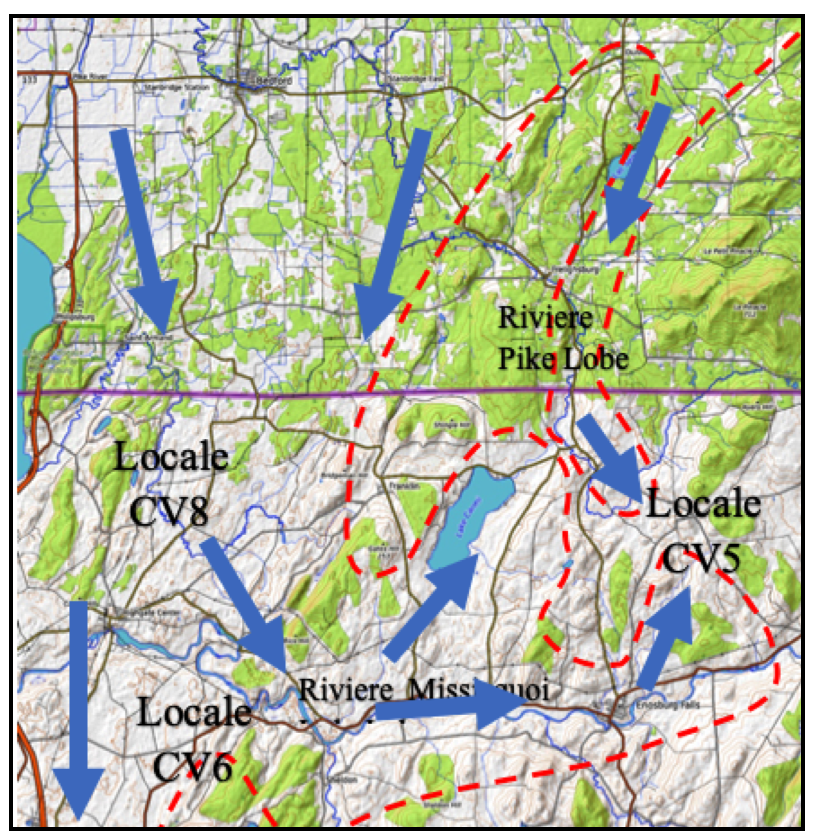
The northwestern Vermont area is shown in more detail on the following regional topographic map:
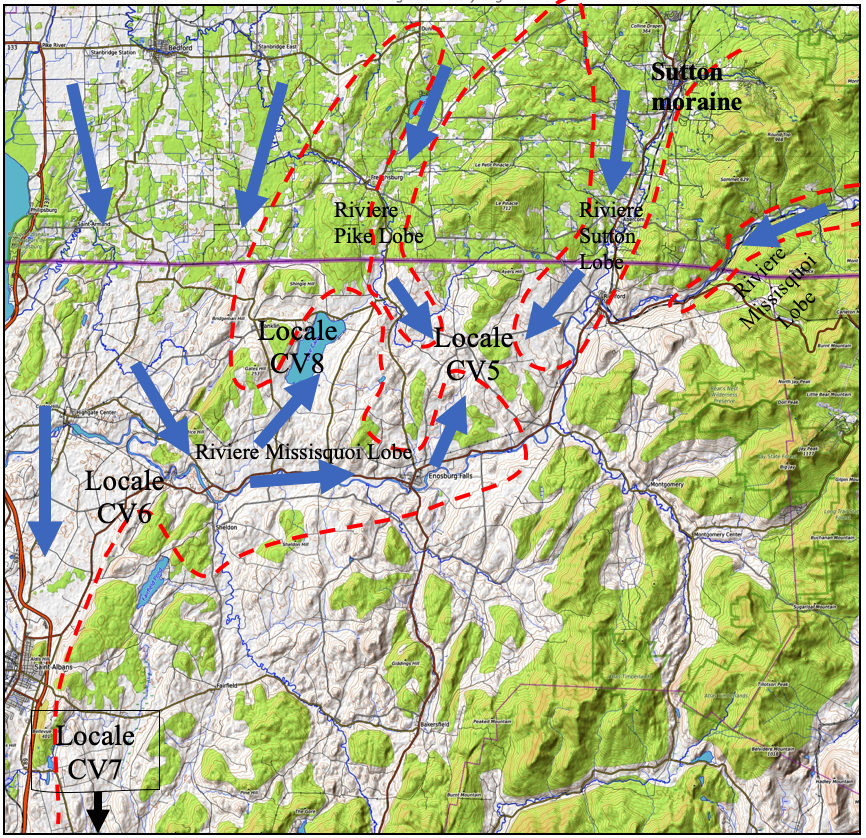
This map shows the physiography of this area and the neighboring region, with the red dashed line suggesting the pattern of sub-lobes associated with the receding ice margin. Locales CV5, 6, and 8 are marked. Again, Locale CV7 is off the map to the south. Added to this map is the approximate location of the Sutton moraine. As stated above, the Sutton moraine is believed to correlate with the T6 ice margin, which is marked by a prominent stagnant ice deposit near Berkshire, where the ice lobes converged, as shown on the map and discussed in the following.
The T6 -T8 ice margins show that the Champlain lobe had four sub-lobe projections into the Missisquoi Basin, including the Riviere Sutton, Riviere Pike, and two Riviere Missisquoi sub-lobes, one from the main Champlain Basin to the west and one from the northeast. The Riviere Missisquoi sub-lobe pathway from the northeast extended westward down the Riviere Missisquoi basin following a tortuous, narrow pathway in mountainous terrain and likely was less well connected to the parent ice sheet than the other lobes. The Riviere Missisquoi sub-lobe which extended eastward up the Missisquoi Basin, subdivided further into a sub-sublobe, one extending northeastward via the Lake Carmi Basin and a sub-sublobe which continued eastward in the Basin. All of these lobes, sublobes, and sub-sublobes reflect the influence of the micro-physiography in this area, fundamentally as controlled by low bedrock relief.
As a sidebar:
Three reports by Cannon in 1964, including the lower Missisquoi Basin and as well the Champlain Islands present intriguing observations suggesting that Cannon was grappling with multiple issues related to ice movement directions as indicated by till fabric and striations, and as well stratigraphic evidence of vertical variations of till and other materials. Cannon was on the Stewart ad MacClintock team which developed the Statewide map and report. In general, his observations suggest ice movement consistent with the patterns identified here, and as well fit with the interpretation given here that the ice sheet in the main Champlain Basin was calving with oscillations of the receding margin. However, Cannon did not specifically delineate the margins of the receding ice margin, including the topic of calving. In general, whereas Cannon’s evidence is intriguing his details are not explored further here as being a sidebar story which would detract from the main deglacial story being presented.
Also, a report by Wright(202o) in the Lake Carmi watershed provides detailed information about the glacial geology. For example his Figure 2 presents striations indicating NW/SE ice movement. However, as he notes his striation data may reflect earlier ice movement directions prior to the late ice margin recessional history identified here. In fact, he refers(page 6) to NW/SE ice movement associated with an early time of glaciation. Wright does not identify or delineate ice margins associated with ice sheet recession.
As can be seen, these sublobes and sub-sublobes converged at a location marked by Locale CV5 on the above map. This convergence is close to Berkshire, just north of Enosburg Falls. It needs to be remembered, once again, that this map illustrates the ice sheet in recession, from a previous time when the ice sheet coverage was more extensive. Thus, this story is about how the ice sheet exited the Missisquoi Basin, not how it advanced into this area. It illustrates the contorted pathways for ice flow as indicated by the blue arrows on the above map. A better sense of this point is given by the following screen shot of the VCGI map, showing the T6(maroon), T7(sage), and T8(yellow) ice margins mapped on VCGI in the Missisquoi Basin:

The details on this screenshot, again owing to the fact that the VCGI GIS system is not scalable, are not legible. But this map gives a sense of the receding ice sheet margins as just described. The Quebec border is shown by the dark line extending across the northern margin of the map, with the Missisquoi Basin floor extending along the south side of the map. As can be seen, in T6 time the ice sheet occupied much of the Basin, extending eastward, standing against the foothills and higher terrain of the Green Mountain front. However, in T6 time a higher foothill nob protruded above the ice sheet as a nunatak in the Berkshire area. This nob is the southern extent of a bedrock ridge extending southward from Quebec, flanked by Riviere Pike and Riviere Sutton basins. And as can be seen by the pattern of the T7 and T8 ice margins, the lobes illustrated on the above physiographic map were progressively developing. In T6 time, the ice mass associated with the Riviere Pike and Riviere Missisquoi(Lake Carmi Basin) western lobes converged against the bedrock nob near Berkshire on its northwestern side, while at the same time the Riviere Sutton and main Riviere Missisquoi lobes converged against nob on its southeastern side. With waning of the ice, in T6 time, the ice mass on the northwest side of the nob separated from the ice mass on the southeast side of the ridge-like nob, resulting in the aforementioned stagnant ice mass at Berkshire. This deposit is located in a low saddle of this ridge, once again indicating the close conformance of the ice and its margins with physiography. The stagnant ice deposit itself is ridge-like and arcuate in shape, concave to the northwest, occupying the juncture where these ice masses separated in T6 time., as marked by a black dashed line, suggesting that the Riviere Pike and Riviere Missisquoi(Carmi) ice sub-lobes were stronger than its neighboring lobes to the southeast across the bedrock ridge.
Substantial and significant stagnant ice deposits and other related features near Berkshire, mark where and when in T6 time the ice margins for these multiple lobes began to separate, with evidence of progressive recession away from this upland nob, as discussed below.
It is convenient to introduce and discuss the evidence and associated history for the recession of the ice margin in the Missisquoi Basin, first for CV 5 on the south side of the initial emergent upland in the Berkshire area in T6 time, followed by Locale CV6 at the mouth and on the south side of the Basin, and then Locale CV7 all the way south to the Essex and Colchester area, and finally Locale CV8, which takes us back to the Berkshire area and follows the progressive recession of the Champlain lobe on the north side of the Missisquoi Basin.
Locale CV5 is quite significant as it documents complex but important elements of the deglacial history, including the Champlain Sea invasion and its close association with theT8 ice margin. Locale CV6 likewise is significant. It was part of Wagner 2023 Open Letter, which is given in Appendix 5 in its entirety. Locale CV6 is located at the mouth of the Missisquoi Basin at the western margin of the foothills near St. Albans and Greens Corners, where Ice Tongue Grooves have been identified, similar to those marked at the mouths of the Lamoille and Winooski Basins on VCGI. As discussed previously, these features represent destabilization of the ice margin whereby the eastern margin of the Champlain lobe became transformed from a lateral to a frontal margin. As discussed in the Open Letter, these features include the Greens Corners area, showing the progressive, step-down recession, raising the possibility that this recession took place in the times of the Champlain Sea at its marine limit and possibly subsequently during its lower stades related to isostatic uplift. Intriguingly, Chapman’s depiction of the marine limit suggests a flattening of the marine limit strandline, perhaps a hinge line, but that is a different story that merits further study. It needs to be said that the elevation of the Champlain Sea at the marine limit and as well the lowering levels of the Champlain Sea are important elements of this history. The T8 margin as mapped here is believed to represent a readvance of the ice sheet in Champlain Sea time but after the initial time of the Sea incursion, as indicated by the mapping of till and silt-clay deposits on the surface of Champlain Sea deltas in the Missisquoi Basin.
Locale CV7 is further south, in the Essex Colchester area where the T7 margin is identified with Fort Ann features. The T7 margin likewise extends up the Missisquoi Basin and is associated with Fort Ann level deposits. This Locale is included here with the Missisquoi Locales to emphasize that the ice margins were part of a long, convex ice lobe.
Finally, Locale CV8 is in the very northwestern corner of the State, including the area immediately northwest of the Berkshire nob. This locale examines the recession of the ice margin away from the nob, likewise indicating a step-down recession closely related to the Champlain Sea invasion along the ice margin. As shown on the VCGI map above in T8 time the ice margin of the main Champlain Basin lobe rested against low uplands west of the Lake Carmi area. These include for example Shingle Hill, Minister Hill, Bridgeman Hill, and Rice Hill, all part of an upland prong separating the ice masses in the Riviere Pike lobe and Lake Carmi basin, essentially a low bedrock ridge which extends across the border, northwest west of Highgate Center, east of Saint Armand in Quebec, as shown on the above map, for about 5 miles to the vicinity of Dunham Quebec. To the west of this upland recession of the T8 margin from this ridge may be marked by ice margin lines as shown on the VCGI map. As discussed in Section IV in the discussion about ice margin features the origin of these lines relative to the receding ice margin is uncertain but soil evidence raises the possibility that these may be ice margin features. If so these might identify an additional ice margin at a T9 level.
In general, ice margin positions were traced in this area, as elsewhere in Vermont, using ice margin features, with interpolation between features along contour lines. The VCGI LiDAR mode at high scale, shows a myriad of local features which are intriguingly suggestive of, and consistent with, ice margins in many locations. However, the margin in many places across large expanses of terrain is not marked or evident on LiDAR imagery. In other words, whereas the ice margin is marked or suggested in fantastic detail in some places, it is, as well, unmarked along substantial portions of the elevation traces. Moreover, the tracing of ice margins in places can be done in subtly different ways reflecting the alternative outlines of ice lobes having importance to the configuration of the ice sheet. All of this is to say that the northwestern Vermont area, as discussed below, deserves much greater scrutiny, as indicated in Wagner’s open letter. This is made all the more important as it appears that the transition from Lake Vermont to the Champlain Sea includes evidence of an oscillation of the ice margin.
b. Locale CV5 – Berkshire/Enosburg Falls area
As noted above, the discussion here on Locale CV5 focuses on the south side of the bedrock nob near Berkshire where the stagnant ice deposit is located, following the story to the south. The remainder of the story on the north side is discussed in connection with Locale CV8. The Berkshire deposits on the south side mark ice margins T6, T7, and T8, including an esker(?) which extends southward to and likely grades into a flat topped but somewhat hummocky kame delta deposit at an elevation of about 500 feet which approximately corresponds with the T8 ice margin and the Champlain Sea marine limit strandline. This deposit is mapped on the State surficial geology map as an “isolated kame,” and as discussed below, was also mapped by Wagner in the 1970s as a stagnant ice deposit, and was again revisited multiple times in 2023 and 2024. 2 This deposit was part of the subject of Wagner’s open letter to the Vermont State geologist in 2023, aimed at drawing attention to this deposit and other features in the lower Missisquoi Basin. The Berkshire deposit and its relationship to the Champlain Sea via the esker(?) are obviously important and significant, as discussed in detail below.
This locale is in the Berkshire area in the mid to lower Missisquoi Basin, just west of and down basin from Locales CV1, CV2, and CV3. Whereas the elevation of the floor of the Lower Missisquoi Basin is generally low, at about 300-400 feet, and the topography of the floor has low relief, at Locale CV5 in the Enosburg Falls area is the aforementioned local foothills nob with multiple high points rising slightly above 800 feet local(825 feet adjusted) elevation, becoming higher to the northeast at Ayers Hill on the Canadian Border at an elevation of over 1200 feet. This foothills upland is the southward extent of an upland topographic prong between Riviere Pike and Riviere Sutton, as shown on the above detailed topographic map. Whereas much of this prong is above 800 feet a low saddle exists on the southern tip of this prong where a stagnant ice deposit occurs, which is the focus of this Locale.
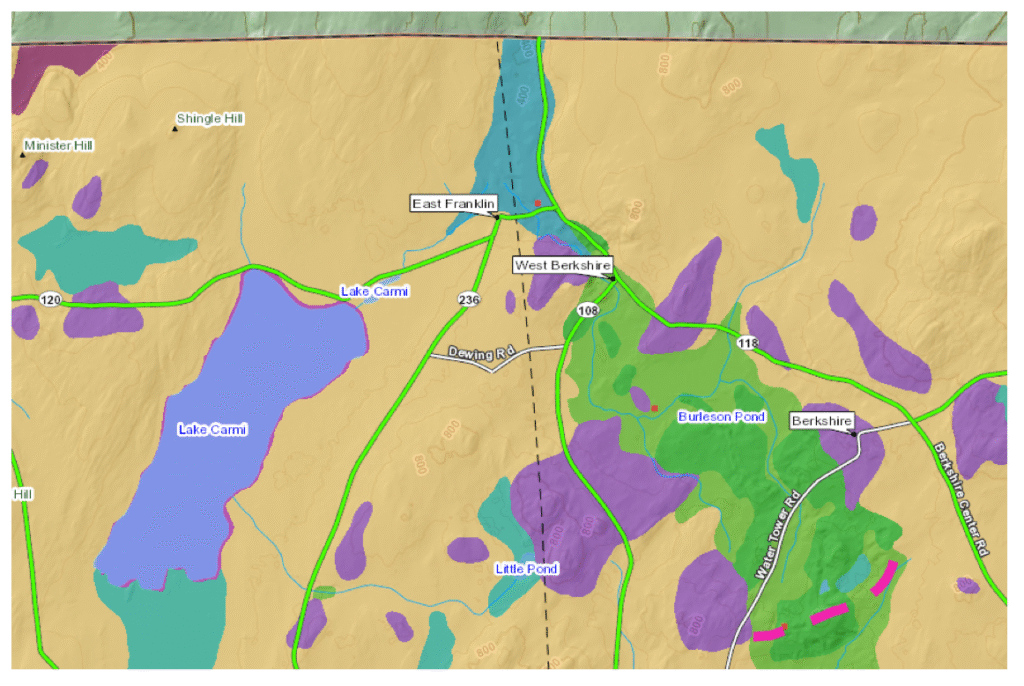
The following map is from the VCGI’s State surficial geology tab:
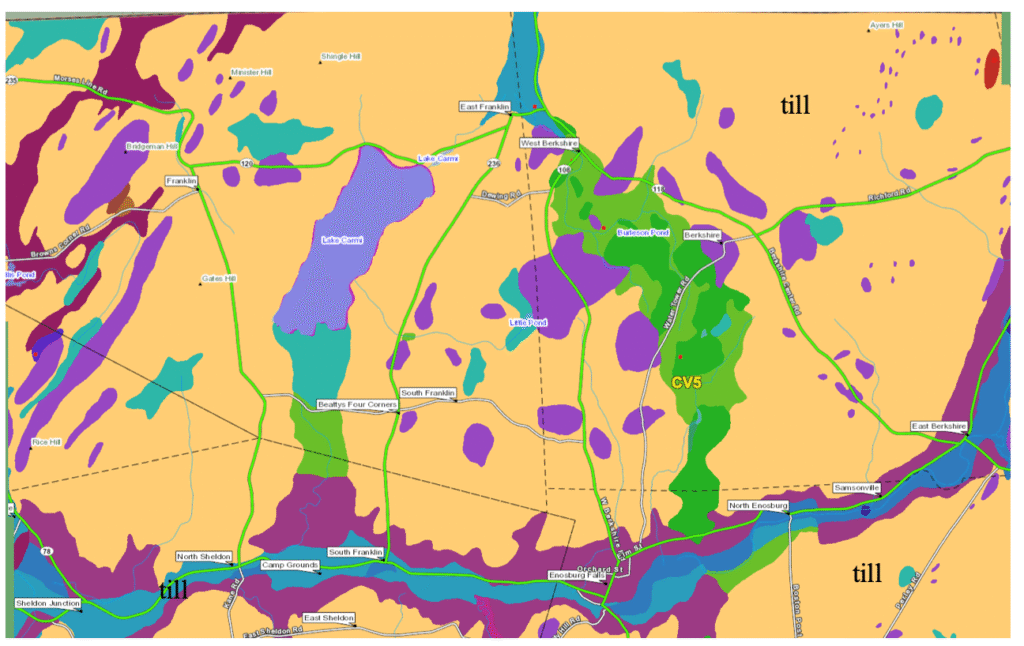
The Canadian border extends across the northern portion where VCGI coverage ends. Whereas the trace of the Missisquoi River per se is not visible at this scale, the present day floor of the lower Missisquoi Basin extends across the area in the vicinities of the villages of Sheldon Junction, South Franklin, Enosburg Falls, and East Berkshire, along the south side of the above map. The cobalt blue areas represent post-glacial alluvium. The light ochre color represents glacial till, which occurs as a thin ground moraine veneer over shallow bedrock in the low relief landscape in the lower Missisquoi Basin. The purple colored unit represents fine-grained, non-bouldery, ponded water sediment.
The lighter, teal blue represents marine sand, which Stewart and MacClintock identified on the basis of marine mollusk shell fossils, representing Champlain Sea deposits. As can be seen, this unit is extensive along the lower elevations near the basin floor, extending as far east up valley to about 1 mile from the village of Enosburg Falls at this Locale, and down valley nearly to Lake Champlain. This unit is found in deltaic terrace remnants. In the Enosburg Falls area these remnants are at elevations corresponding with the marine limit, and downgradient deltaic remnants are at lower elevations corresponding with Chapman’s lower Champlain Sea stades. These deltaic remnants are topographically flat surfaces with low slopes to the west, making the identification of the marine limit difficult to establish precisely. Based on numerous Champlain Sea features from the Middlebury area northward to the Canadian border, Wagner(1972) marked the marine limit in the Enosburg Falls area at an elevation of about 440 -450 feet, which corresponds with the deltaic remnants as mapped by Stewart and MacClintock in the Enosburg Falls area at this Locale.
It is notable that marine sand is also identified on this map on the northside of the bedrock nob, documenting the invasion of the Champlain Sea along the receding margin. However, this portion and the associate history are discussed below at Locale CV8.
In the vicinity of Locale CV5, basically in the saddle in the above topographic prong, are two green colored units; the darker green colored unit is identified on the State map as “Isolated kames”, and the lighter green colored unit as “Lake Sand.” Also included within this kamic area is a feature mapped as “esker.” LiDAR and topographic imagery suggests that the “esker” extends further south, in an area mapped as isolated kame. Elevations of the “esker” crest generally slope southward, suggesting southward drainage in an ice lobe in Locale CV5. Immediately south of this esker extension is a terrace remnant which Stewart and MacClintock mapped as the dark purple unit identified as silt, silty clay, and clay. However, the sewage favorability tab indicates well-drained, sandy soil, probably a small Champlain Sea deltaic terrace remnant. In essence, the “esker” deposit appears to grade into the deltaic feature, which suggests deposition of the esker feature in Champlain Sea time.
In the late 1960s and early 1970s, Wagner mapped the surficial geology of portions this area at a reconnaissance level, using the then available topographic USGS 1:62,500 Quadrangle map, which was quite crude and limited. A variety of intriguing features were identified, portions of which are included in Wagner’s “Open Letter” to the State geologist in 2023. Information from the from the 1960s-1970s mapping and as well the current VCGI mapping is incorporated in the following.
The map below is from VCGI mapping:
The white colored area corresponds with the village of Enosburg Falls. A closer VCGI examination of the area mapped on the State surficial map as Isolated Kames and Lake Sand deposits, using topographic and LiDAR imagery, indicates a strongly kamic feature, shown by the gray shaded area. This is the stagnant ice deposit referred to previously.
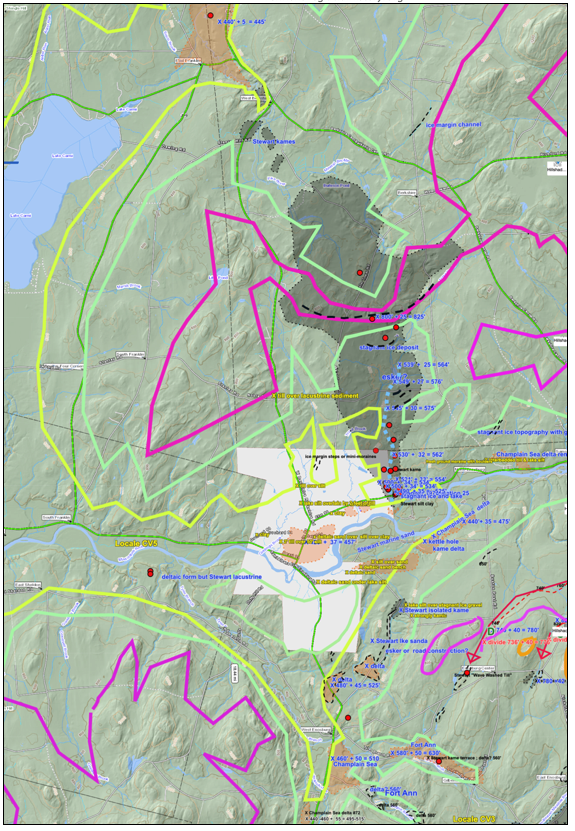
The following is a screen shot from a portion of the regional physiographic map presented above:
The stagnant ice deposit just referred to is approximately delineated by the pale orange colored areas on the above map. Numerous gravel pits in this deposit, marked by red circles on the VCGI map, in places show thicknesses of up to nearly 100 feet of typical, highly variable sand and gravel, with collapse structures.
The high point of the deposit is a prominent T6 kamic ridge at in a saddle high point of the aforementioned topographic nob at the south end of physiographic prong. The ridge is arcuate, oriented nearly east-west and concave to the north, consistent with stagnant ice deposition by the Pike Lobe on the north side and the Riviere Missisquoi lobe on the south side of the ridge. The elevation of the ridge is at an adjusted elevation of 825 feet(251 m) which corresponds with the T6 800-900 foot(244 – 274 m) level.
As a sidebar:
The delineation of ice margins in this area in accordance with the Bath Tub Model is an intriguing and challenging exercise, made all the more so by the low but irregular topographic relief in this area, combined with the need to bear in mind the presence of multiple lobes of the receding ice sheet which requires that the delineation makes geological sense in the context of ice margin recession. Different interpretive versions of ice margins in the Missisquoi Basin were developed as the VCGI mapping progressed. The delineation of ice margins as shown on VCGI in this Locale were purposely drawn with the above described physiography and likely multi-lobed front of the receding ice sheet in mind. In this context, the stagnant ice ridge at a crest elevation of 825 feet is interpreted as marking the juncture of the Riviere Missisquoi and the Riviere Pike sub-lobes, which of course are sub-lobes of the Champlain lobe. These sub-lobes followed the physiography, converging in a low saddle in the aforementioned bedrock ridge that extends southward toward Enosburg Falls from Ayers Hill and further to the north in Quebec.
The areas both to the north and the south of the T6 margin at Locale CV5 are marked by stagnant ice deposits at lower elevations, as shown on the State surficial geology map and as well is confirmed by LiDAR and sewage soil favorability tabs on VCGI. These deposits mark the step-down recession of the ice margins for these two sub-lobes. In as much as all ice margins mapped on VCGI are identified by elevation ranges, as opposed to specific single elevations, which again fundamentally reflects the uncertainty and imprecision of the data by which such margins are identified, this allows for and results in some latitude in the delineation of ice margins.
Two fundamentally different interpretations of the stagnant ice deposit at Locale CV5 on the south side of the nob are possible, although the deglacial history is much the same with either. In one case, the portion of the deposit south of the T6 margin includes the “esker,” as just described. The other interpretation is that the feature identified as an “esker” is instead an end moraine, as explained in the following:
- Esker Interpretation
The interpretation of a portion of the Berkshire stagnant ice deposit as an esker, suggests that recession after the T6 ice margin led to formation of T 7 and T8 stagnant ice mass in the topographic low area, on the south side of the divide, with the esker and associated kamic deposit as marked on VCGI map by a blue dashed line on the VCGI map grading southward through the T7 margin and grading into the Champlain Sea deltaic remnant at the T8 level and time. By this interpretation the “esker” represents drainage from the stagnant ice mass into the Champlain Sea. The stagnant ice deposit on the south side of the T6 margin slopes downward to the south across elevations corresponding with T7 and T8 ice margins ice margins, as presently drawn on the VCGI map.
2. End moraine Interpretation
Whereas the sinuous ridge-like feature marked by the blue dashed line on the above VCGI map may be an esker, as marked on the State Surficial Geology Map, an alternative explanation is that it is a morainic feature, with the T8 margin standing along the crest of this deposit’s esker-like ridge. The following screen shot shows the topography in the vicinity of this deposit:
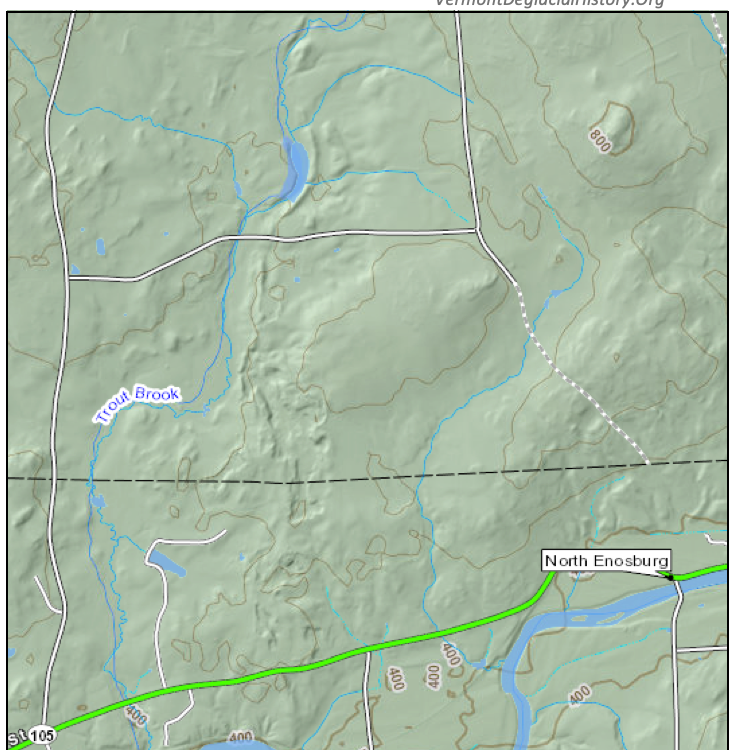
Whereas part of the feature has been altered by erosion and gravel excavation, making it more difficult to see the original topography, the sinuous ridge-like form certainly resembles and may in fact be an esker.
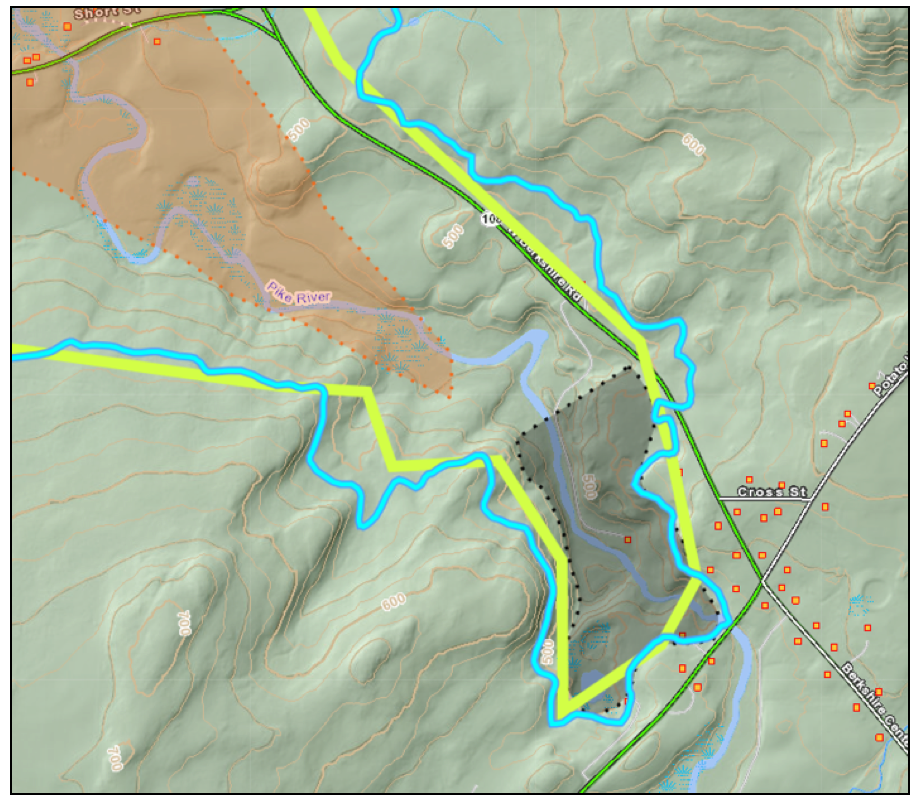
The following screen shot is from a VCGI map of a larger portion of the Missisquoi Basin, including areas both to the north and south of the Missisquoi River, with the black dashed line marking the 520 foot(158 m) contour:
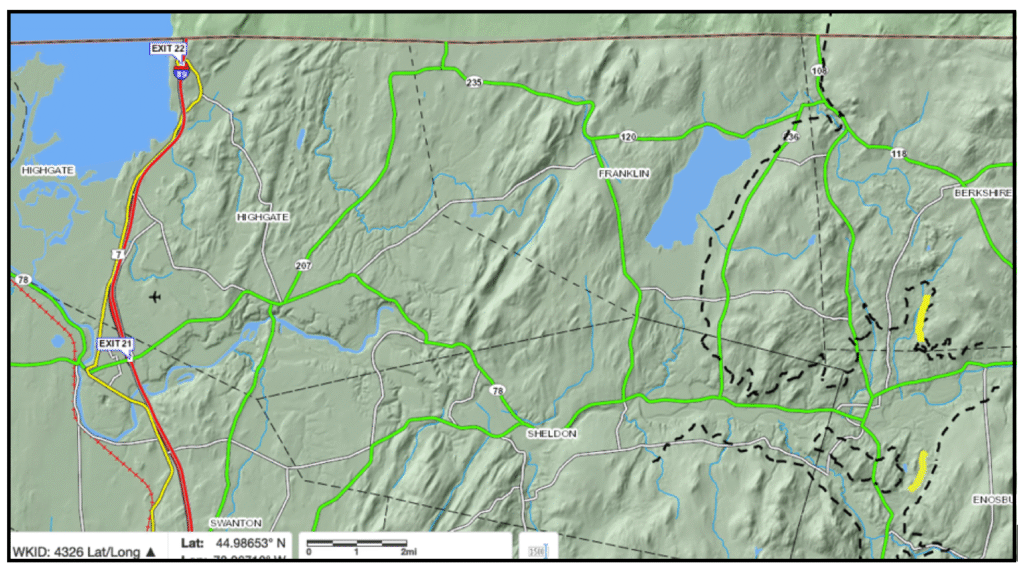
It is possible that this contour approximately marks the terminous portion of the T8 lobe. The deposit in question as a possible esker is marked by a short yellow line on the north side of the Missisquoi Basin. Interestingly, on the south side, as likewise marked by a yellow line, is another ridge feature. This feature has been altered by road construction for Howrigan Road, making it more difficult to reconstruct its original topography. However, based on field reconnaissance in 2025 this ridge is interpreted as a glacial feature, either an esker or morainic ridge. The construction of Howrigan Road has altered the topography but the road was constructed to take advantage of the ridge which is glacial in origin. In the immediately vicinity and to the east of this ridge is topography which on LiDAR resembles stagnant ice terrain, which is confirmed by Wagner’s mapping in the 1970s, and again the 2025 re-visit. It is possible that the Berkshire deposit and the Howrigan Road features are remnant end moraine segments of the T8 ice lobe. If these features are end moraines, it needs to be said that these ice margin feature are not a typical moraine as described by Parent et Occhietti in Quebec, which are substantial kame and kettle type deposits. However, in New York, Franzi (2024 personal communication) has mapped extensive moraines which are narrow and quite subtle but definite features, not unlike these ridge segments.
Further, on the south side of the Missisquoi Basin, south of the village of Enosburg Falls, on the north-sloping flank of the Basin, and just to the east of the Howrigan Road features are a series of very feint and subtle but nevertheless definite multiple, parallel streak-like markings on LiDAR imagery, as shown by the traces on the following screen shot from VCGI:
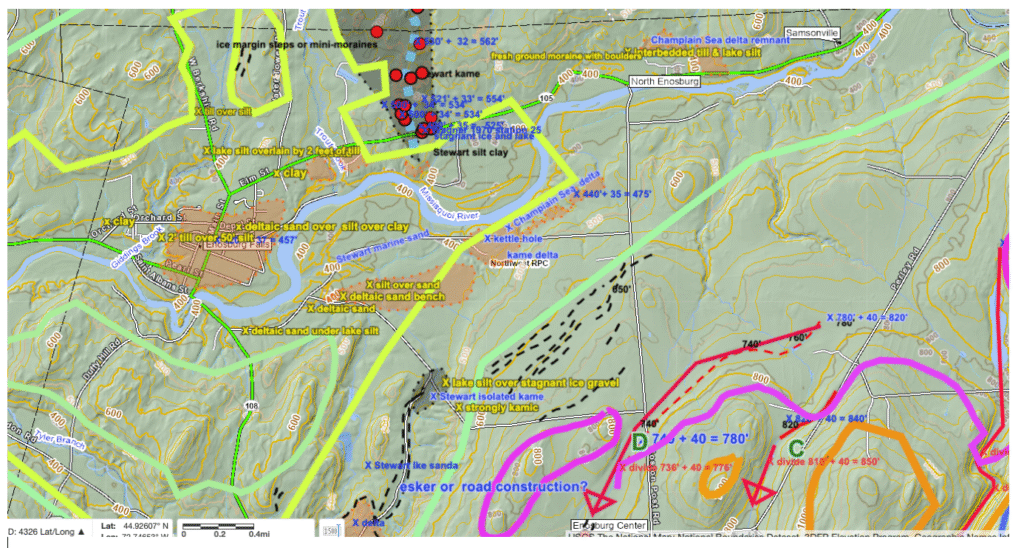
The markings are delineated by a series of more or less parallel black colored dashed lines on the VCGI map. The elevations of these markings range from a high of about 730 feet to a low of about 600 feet, extending from just below the T6 ice margin (maroon lines) to the T7 ice margin (sage green line). These linear elements are in terrain identified on the State map as till ground moraine. The origin of these lines in terms of the mechanics of their formation is uncertain. It is possible that they represent Steps, as described above, but the available topographic information shows no obvious terrain variation. In any case, these features interpreted as marking the progressive recession of the active ice margin from the T6 to T7 times and levels. 3It is noted that similar feint marking have been noted elsewhere. They seem to be associated with and found on northwest sloping terrain hillsides, similar to Ice Marginal Channels, suggesting that the formation of these features, like the Channels which are much more common, was somehow related to the pressing of the active ice margin against these hillsides. The possibility of including these as part of the repertoire of ice margin features was considered. While they likely in fact are ice margin markers, and as such provide significant information related to deglacial history, owing to the fact that they are relatively uncommon they were not identified as such as ice margin features.
It is notable that these markings suggest that by the time of their formation, the ice mass in the Missisquoi Basin was a very narrow lobe on the floor of the basin. The elevation of the lowest marking is about 600 feet, which compares to the peak elevation of the Howrigan Road feature a short distance to the west of about 460 feet. The markings suggest the recessional lowering of the ice sheet from T6 to T7 time. At T7 time the ice lobe was largely confined to the Missisquoi Basin and its major tributary sub-basins such as the Trout Basin to the east (Locale CV2) and the “The Branch” basin where the Howrigan Road features are located at the basin mouth, and the Black Creek Basin to the west. The T7 margin on the south side of the Basin is associated with kame deltas related to the Fort Ann level. As noted elsewhere, the T7 margin was closely associated with Fort Ann features suggestive of a long, narrow open water corridor along the T7 ice margin which projected in the southward a long distance in the Champlain Basin, indicating a long convex ice lobe in T7 time. This corridor apparently extended into Quebec where Fort Ann equivalent features have been identified by Quebec researchers, using the name Lake Candona.
Also as noted by Cannon (1964) and Wagner (1972), Fort Ann features are well marked on the south side of the Missisquoi Basin but tend to be remarkably absent or scant on the north side. This suggests that either the open water corridor may have somehow penetrated the T7 ice margin, as suggested in the discussion elsewhere in regard to Ice Tongue Grooves, or alternatively that the absence of Fort Ann features on the north side is explained by the readvance of the ice sheet associated with the T8 margin. This readvance again was suggested by Cannon and Wagner. Also, Wagner noted that the terrain on the north side of the Missisquoi Basin is remarkably fresh looking ground moraine with an unusual; abundance of boulder erratics.
These observations lend support though do not prove that the ridge-terrain feature at Howrigan Road is a moraine, possibly marking the T8 margin. However, whether the ridge at Howrigan Road is a moraine or an esker, is in a sense immaterial, because either way an ice margin is indicated. Cannon reported readvance evidence in the “The Branch” basin, about 2 miles south of the Howrigan Road features, specifically identifying till overlying contorted sands which are here interpreted as part of a Champlain Sea delta and a readvance of the T8 margin. .
As noted above, Wagner mapped portions of the area in the late 1960s and early 1970s. Notes from that mapping are pertinent:
- In the 1970s, an active gravel pit along route 105 near Enosburg Falls, near the southern end of the “esker?” showed typical stagnant ice sand and gravel, with collapse structures, including a large in-faulted mass of lacustrine silt. This pit is now badly slumped with geologic features no longer discernible. As noted above, many gravel pits presently exist in the stagnant ice deposit. The area was again revisited in 2023 when it was possible to examine several northern pits, at and immediately south of the ridge crest, showing typical stagnant ice sand and gravel, in places with thicknesses in excess of 75 feet, and in places with collapse structures. However, the present owner of the pits immediately north of Route 105, which are now much larger declined to permit an examination of these pits.
- Exposures of Champlain Sea deltaic remnants in the 1970s in many places in the Missisquoi Bain showed a thin veneer of lacustrine sediment overlying topset deposits, and in several locations a thin, partial, overlying layer of glacial till. Cannon(1964) 4 Cannon, W. F. 1964, Report of Progress: 1964; The Pleistocene Geology of the Enosburg Falls Quadrangle; Vermont Geological Survey Open File Report No 1964-1; 13 p. likewise reported multiple exposures of till overlying other deposits in the area, in particular deltaic sands at the Champlain Sea level, which led him to suggest a readvance of the ice sheet, though he was unwilling or unable to suggest that this occurred in Champlain Sea time.
- The appearance of the terrain near Enosburg Falls and elsewhere on the north side of the Missisquoi Basin in places has a striking appearance of a fresh, young looking, bouldery ground moraine. This may be a mappable feature, but to date such mapping has not been attempted. Also, LiDAR imagery of this feature shows a distinctive signal. Such ground moraine is very different from that seen elsewhere in Vermont, where ground moraine generally has been modified by the effects of proglacial standing water following ice margin recession.
It is obvious that the features described above deserve to be studied in more detail. It is suggested that the T8 margin at Locale CV5 was associated with the Champlain Sea at the marine limit, based on preliminary circumstantial evidence, with on the one hand the esker(?) grading southward to and merging with the ancestral Missisquoi Champlain Sea delta, or alternatively with a moraine being deposited in close association with the delta.
The suggestion that the T8 margin is associated with the Champlain Sea at the marine limit at this Locale is very significant, with major implications, in particular regarding the transition from Lake Fort Ann to the Champlain Sea and the readvance of the ice margin in T8 time. This interpretation fits and correlates with readvance evidence at the T8 margin in the LaPlatte Basin and near Bridport, as explained above in a previous discussion.
Lake Fort Ann features to the south, as indicated in the preceding, are associated with the T7 ice margin. Mapping of other Locales in the Missisquoi Basin and as well further south in the Champlain Basin show that the T7 ice margin was associated with Lake Fort Ann, which apparently penetrated northward along a narrow corridor of the T7 ice margin. Lake Fort Ann features have also been identified in Quebec, referred to as Lake Candona. The recession of the ice margin in T7 time along a narrow corridor allowed for the expansion of Lake Fort Ann and eventually led to the opening of the Basin to the Champlain Sea. Conventional paradigm-ic thinking is that this entailed a northward recession of the ice margin, but more likely was northwesterly along the convex lobe.
The following is a modified map of Lake Candona by Parent et Occhietti. 5 Parent, M. et Occhietti, S, 1999, Late Wisconsinan Deglaciation and Glacial Lake Development in the Appalachians of Southeastern Quebec, Quaternaire, V 53. Pp 117 – 135. The authors suggest the extent of Lake Candona, as marked by the gray shaded area on this map, with the position of the ice margin in Fort Ann time relatively far to the north. The blue shading has been added here as discussed below to suggest a more convex lobe in Fort Ann(Candona) time.
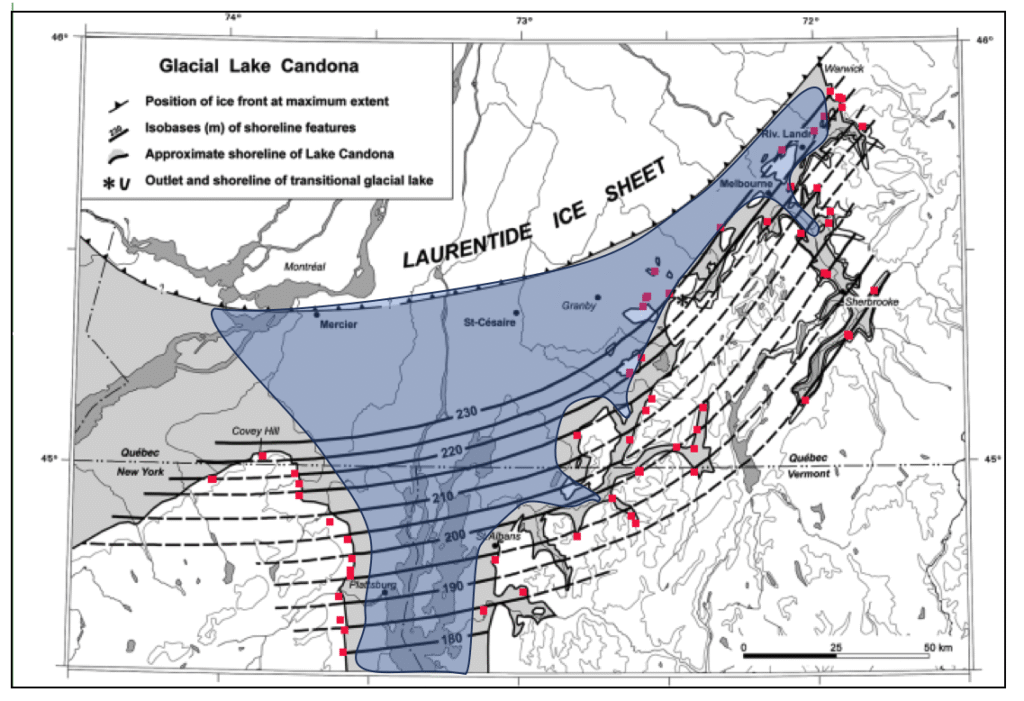
The Parent et Occhietti map suggests that the central lobe front ice margin had substantially retreated far to the north in Fort Ann time. Therefore, an ice “oscillation” as suggested above in T8 time, would of necessity have entailed a relatively substantial, more major readvance of the ice margin.
As reported by the authors, the above map is based on shoreline features as shown in an earlier 1988 report(Figure 7), marked on the above map as red dots. This shows that the delineation of Lake Fort Ann(Candona) is based on a small number of shoreline features in Vermont, and that the position of the ice margin per se in Quebec in Fort Ann time apparently is not documented.
Again, the VCGI mapping here indicates that the T7 and T8 margins extended southward in the main Basin as a long convex lobe, with Fort Ann and Champlain Sea occupying narrow corridors along these margins.
As suggested by Chapman and reflected by the above map, Lake Fort Ann extended northward to and beyond the Canadian border. An alternative conceptual interpretation of the ice margin position in Fort Ann/ Candona time as shown by the blue shaded area added to the above map, is a more lobate configuration of the ice margin at Fort Ann time. Of course, while the VCGI data support this interpretation in Vermont, whether or not in Quebec and New York Lake Fort Ann/ Candona features are associated with such an ice margin is unknown.
The point here is to suggest a different paradigm model for the nature of the ice margin at T7 Fort Ann and T8 Champlain Sea times, involving more convex lobe shapes, associated with narrow water bodies. This suggests that Lake Fort Ann may have extended northward into Canada not as a broad or wide, open spanse as suggested by the above map but rather as a narrow body of water along the T7 ice margin. This is important, because, as noted above, a broad spanse, as suggested by the Parent et Occhietti mapping, would require a substantial readvance of the ice in T8 time.
The State Surficial Geology tab on VCGI shows ponded water sediment extends eastward up the Missisquoi Basin floor to the vicinity just east of Enosburg Falls. Some of this is attributed here to the Champlain Sea, but portions of the deposit may correlate with Lake Fort Ann. However, the State map shows no deltaic features as would be expected with drainage along the Missisquoi Basin floor in Fort Ann time. In this present mapping, Fort Ann deltaic deposits are identified in the southern tributaries of the basin as for example at an adjusted elevation of 695 feet in Trout River Basin at Locale CV2. In the main Missisquoi Basin at this elevation only stagnant ice deposits are mapped, though the possibility of Fort Ann delta deposits farther north, across the Canadian Border can not be ruled out, and in fact is suggested by Parent et Occhietti mapping. In the VCGI mapping reported here, no deltas at the Fort Ann level in drainage systems on the north side of the Missisquoi Basin have been identified. This may be attributable alternatively to a) ice presence in Fort Ann time (but this hypothesis needs to account for the report of Fort Ann equivalent features in Quebec) , b) the small size of these tributaries and therefore the limited sediment availability for the formation of deltas, or c) the readvance in T8 time extending over and destroying Fort Ann features.
If in fact the ice margin retreat northward into Quebec in Lake Fort Ann time was more limited to a narrow corridor in the above described manner, the association of the T8 ice margin with Champlain Sea features at Locale CV5 (and as will be shown, as well at Locale CV6), suggest a significant but perhaps nevertheless a relatively minor oscillation of the ice margin in T8 time, again as documented by the identification of silt-clay deposits overlying Champlain Sea deltas and in one location likewise including glacial till. And likewise, this interpretation fits with the evidence in the LaPlatte Basin and in the Bridport area.
Further, in terms of deglacial history and the marine invasion into the Champlain Basin, the advance of the Champlain Sea into the Basin likely was progressive, from northeast toward the southwest, presumably with the opening taking place in Quebec. This observation stands in contrast to the progressive development of Champlain Sea features in Vermont from south to north. As discussed elsewhere. Wright suggested that the lowering of from the Fort Ann level to the Champlain Sea level took place suddenly. The length of time between the initial opening of the Missisquoi Basin associated with the incursion of the Champlain Sea and the readvance is unknown, but probably was brief. Likewise, the magnitude of the oscillation associated with the T8 readvance is unknown but probably was limited. The nature of the water body fronting the T8 margin associated with the readvance, including its level and extent are likewise unknown. As suggested by Franzi, strandlines in the Champlain Basin likely were diachronous, and as noted elsewhere in this present report, the ice margins identified in this report is likewise over simplified in that these T time features were likewise diachronous, which is explicitly documented by features showing progressive recession within T times at various locations in Vermont as reported here.
All of these issues as part of the deglacial history are intriguing and as suggested by Wagner’s 2023 Open Letter, deserve further study.
c. Locale CV6 Fairfield pond and Greens
A substantial stagnant ice deposit at the T7 in the Fairfield Pond area and significant ice margin features at lower and youngers T8 levels in the Greens Corners area are mapped on VCGI These deposits and features are discussed here and in more detail as part of my 2023 “Open Letter” to the Vermont State Geologist as presented in Appendix 5.
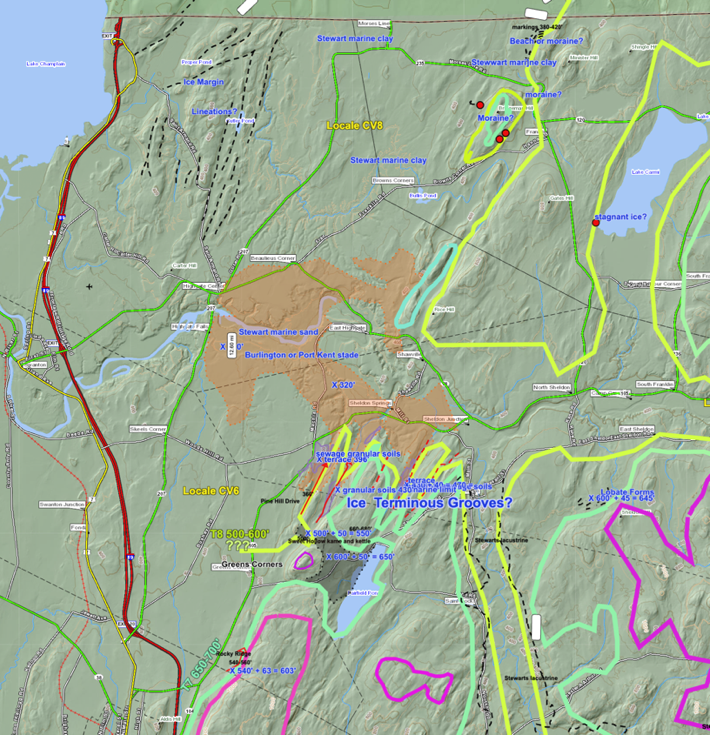
The Fairfield Pond deposit is located in an upland area immediately west of Fairfield Pond as marked on the above map by gray colored shading. It consists of strong hummocky, typical kamic stagnant ice topography. Outcroppings indicate gravelly soils. The feature generally occurs at elevations ranging from about 580 feet – 680 feet. To the east of Fairfield Pond only thin ground moraine with numerous bedrock outcroppings was found. The surface water elevation and depth of Fairfield Pond are about 548 feet and 40 feet, respectively. Bedrock outcroppings near the Pond outlet suggest that the Pond likely is in a closed basin, and therefore may be a kettle hole, occupied by an ice block of at the time of the feature formation.
It is apparent that the stagnant ice deposit was formed by a small local lobe of the main ice sheet in the Champlain Basin, extending eastward across a low topographic divide via a col on a bedrock ridge, eastward into the Fairfield Pond area. The ridge generally has elevations of 700 – 800 feet and above. However, a saddle with a lower topographic divide on the ridge, with kamic material at the surface, presently has an elevation of 660 – 680. The thickness of the deposit at this divide is unknown but judging from the topography could be several tens of feet, indicating an even lower land surface elevation for the ice sheet incursion. An alternative connection with the ice sheet that formed this deposit hypothetically could have been a lobe of ice extending southward from the Missisquoi Valley, up the drainageway of Black Creek. However, a reconnaissance of that area showed only thin, patchy ground moraine over shallow bedrock. This area and feature provides another example of the remarkable sensitivity of the ice margin to physiography, in accordance with the “Bath Tub Model.” This deposit marks the T7 margin.
South of Greens Corners and west of Fairfield Pond, in the Rocky Ridge Road vicinity(see above map), are two topographic linear drainage elements(shown together on the above map), in both cases marked by surface water Drainage Lines extending down the west side of the same bedrock upland as at the western margin of the Fairfield Pond deposit. Drainage begins uphill and extends westward downhill, but is abruptly and strongly diverted into linear drainage swales oriented approximately northeast-southwest. The elevations of the bottoms of the drainage swales vary but are on the order of 540 feet( local) and 603 feet(adjusted), in the T8 elevation range. Both swales are bounded on the east by the bedrock hillside, and on the west by pronounced ridges which are mostly bedrock but in places include gravel deposits(generally these have no distinctive topographic expression but in places are faintly kamic).
Care is required in inferring these swales were formed at an ice margin, given that in much of Vermont the bedrock commonly imparts a grain to the topography. In this case, in fact, the swales are oriented roughly parallel to the bedrock structural grain. However, the swales are unusually pronounced and the drainage patterns exceptionally diverted. The “clincher” is that the swales are bounded by ridges which include kamic gravel deposits, which likely were ice deposited, at T7 time. It is believed that these are bedrock controlled ridges, with swales accentuated by ice marginal drainage with stagnant ice deposit subsequently formed in the swales, at the T7 margin and level.
Immediately northeast of Greens Corners is another remarkably long, narrow and deep drainage way, known as Sweet Hollow, as shown on the above map. The Sweet Hollow valley likely was at least partly eroded along an ice margin drainage channel. A ridge-like deposit of sand and gravel lies athwart and at the head of Sweet Hollow, at a local elevation of 500 feet and adjusted elevation of 550 feet, slightly lower than the aforementioned drainage swales at Rocky Ridge, at an elevation correlative to T8. Remnants of two old gravel pits in this deposit are evident but are too overgrown to discern any geologic information. According to the property owner, whose family has owned the property for several generations, both gravel pits were active more than 50 years ago. Immediately southwest of the gravel ridge is a mostly enclosed, oval-shaped topographic basin, the floor of which is at an elevation of about 460 feet. The same property owner indicated that the basin is a natural feature, fundamentally unaltered by gravel pit excavation. In my opinion, the basin is likely a kettle and the ridge a kame or kame terrace.
The kamic ridge has a flat top surface, which slopes northeastward and grades into terrace deposits extending a short distance down Sweet Hollow. Multiple fluvial surface terrace remnants are evident further downgradient in the Hollow, above a surprisingly and curiously broad, flat, and sharp-edged valley floor. Near the mouth of Sweet Hollow, which opens into the Missisquoi Valley lowland, are deltaic deposits which are extensive in this part of the Valley at the Champlain Sea level. The State Surficial map shows a “marine sand” deposit extending up into Sweet Hollow, suggestive of drainage down Sweet Hollow, and likewise other neighboring drainage ways marked as Ice Tongue Grooves on VCGI are graded to Champlain Sea deltaic deposits The upper surfaces of the kamic ridge, and the immediately adjacent terrace, may be correlative with terrace remnants further down the Hollow, and in turn with a Champlain Sea deposits. At this point, however, the correlation of the kame and kettle feature at the head of the Hollow via terraces in this drainageway to the deltaic deposits is uncertain and needs more careful study.
The Sweet Hollow channel was considered in Wagner’s 1972 report as related to control of “Lake Greens Corners,” a previously unreported strandline between Fort Ann and Champlain Sea levels, associated with an ice margin oscillation, the margin here identified as T8. In essence, I inferred a spillway at the head of this channel. I now believe that the inferred spillway is incorrect, in as much as the gravel deposit at the head of the channel could not have sustained major drainage without being substantially eroded. However, I continue to believe that this channel was a spillway for drainage from the main valley to the south, because a higher lake water level could not have been sustained as the ice sheet receded to open Sweet Hollow to drainage. The absence of an actual erosional spillway feature at the head of this drainageway may be explained by this location being at an ice margin, perhaps with blocks of ice in Sweet Hollow preventing the formation of a spillway, the drainage being through a network of crevasses.
Finally, immediately northwest of the features just described at Sweet Hollow is another area of two conspicuously linear drainage features. These likewise are unusually pronounced erosional topographic swales, apparently predominantly in bedrock, with a roughly parallel orientation to Sweet Hollow. The elevation of swale troughs, at about 360 feet, is lower than the similar features at Sweet Hollow, but likewise may be graded to Champlain Sea deposits, again as demarcated on the State map The channels are ice marginal features, particularly given the context of their proximity to other similar features as described above.
These linear drainage features are marked as “Ice Tongue Grooves,” delineated at the “corner” between the Champlain Basin and the Missisquoi Basin, interpreted as representing drainage features formed in conjunction with the T7 and T8 ice margins related to drainage of Lake Fort Ann northward via the channels into the Champlain Sea. Significantly, like the similar Grooves mapped at the mouths of the Winooski and Lamoille Basins, these Grooves are believed to mark the Missisquoi lobe extension of the Champlain Lobe, as a destabilized margin, in this case with drainage from the T7 to T8 level associated with the opening of the corridor defined previously, marking the transition from Fort Ann to Champlain Sea. The Grooves are graded downward to deposits mapped on the State surficial geology map as Champlain Sea, at the marine limit.
d. Locale CV 7 Colchester Pond and Indian Brook Reservoir Area
The following is a screen shot from VCGI, showing this Locale:
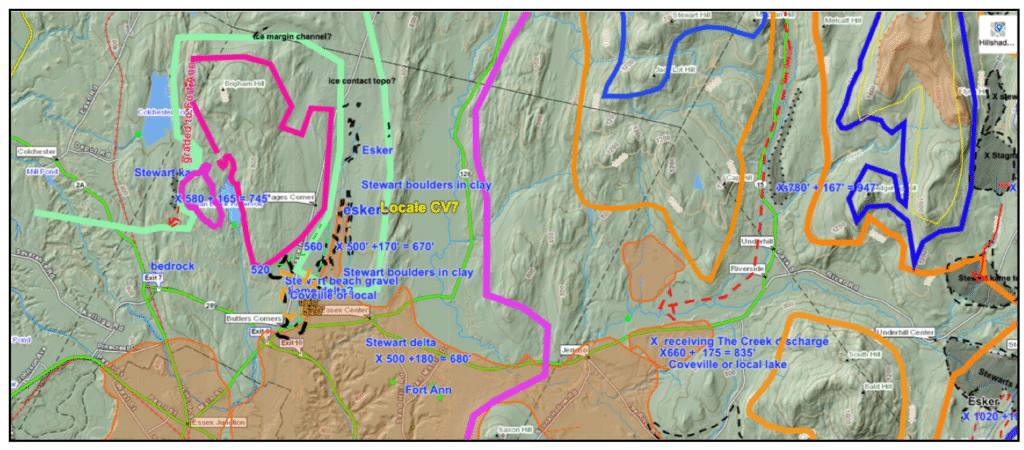
In the Essex area is an esker deposit, which back in the 1970s was an annual Glacial Geology class field trip stop. At that time, I believed that eskers were relatively rare in Vermont. Thanks to LiDAR, the reverse is now the case, with numerous eskers found in many locations. In most of these instances, eskers occur near the present valley floors, suggesting limited postglacial erosion. Eskers are one of several types of stagnant ice features, all of which mark the ice margin. Elevations of esker ridges tend to suggest downgradient drainage directions.
The Essex esker is a case in point and is a major, important element in the deglacial history of this Locale. LiDAR imagery indicate three esker segments, as marked on the VCGI map. The adjusted elevations of these segments suggests that these represent the T7 ice margin. The esker segments appear to grade southward into a Fort Ann delta. Similarly, to the east, near Underhill, southward drainage in the The Creek lowland is graded into a delta at the Fort Ann level.
The VCGI mapping suggests that in T4 to T8 time the level of the ice sheet progressively lowered, with the main mass of the Champlain lobe occupying the floor of the Basin to the west, but with many foothill nobs emerging above the ice sheet as nunataks. This progression is marked by a step-down sequence, including many Bedrock Grooves and Drainage Lines which are graded to kame delta deposits for local proglacial water bodies, giving way to Fort Ann Lake Vermont. Obviously, meltwater was increasingly associated with this recession and was substantial. The evidence suggests that the ice margin was substantially influenced and perhaps controlled by meltwater, especially standing water, with the progressively northward expansion of a regional more or less open water corridor along the T7 and then T8 margin in first Fort Ann time and then the Champlain Sea at the marine limit and below. The Essex esker illustrates this relationship with drainage marked by the esker graded southward to deltaic deposits associated with Fort Ann Lake Vermont on the floor of the basin at the mouth of the Winooski.
As can be seen on the above VCGI map, in T6 time the ice margin (maroon colored line) indicates the emergence of Brigham Hill, with ice occupying the terrain below this level. By T7 time (sage green colored line on the VCGI map) continued recession resulted in an ice mass in the lowland of present day Alder Brook to the east, where a stagnant ice margin was associated with and marked by the “Essex esker,” which again is graded southward to a Fort Ann delta. The T7 margin wrapped around the north side of Brigham Hill, and thence projected southward in the Champlain Basin against foothill terrain, extending as far southward to a position in the lowland near the nose of the Taconics. As discussed elsewhere, this margin was associated with calving in the Middlebury Bench.
The T7 margin in the Essex-Colchester area was originally drawn so as to indicate a westward extension across the basin toward New York, possibly as a calving margin. In fact, the above map is from this early version. However, more recent mapping now correlates these features with kame delta deposits further south at Sucker Brook in the Williston area at the Fort Ann level, which Springston and DeSimone interpreted as having formed in close proximity to the ice margin, thence continuing southward as part of the calving margin in the Middlebury Bench, along a much more convex T7 lobe than suggested by the early interpretation as depicted above.
In the Colchester Pond area, again with reference to the above VCGI map the T7 margin is marked by an isolated kame as depicted on the State map, and by a Drainage Line associated with a Bedrock Groove which may extend southward to deltaic deposits at the Fort Ann level. The map below is taken from the VCGI map showing the area of these features:
Again, the T6, T7, and T8 ice margins are marked by the maroon, sage green, and yellow lines, respectively. As can be seen the topographic low presently occupied by the Indian Brook Reservoir was occupied by a small T6 lobe, with the ice sheet level thereafter continuing to lower as the margin receded, generally westward.
Preliminary field examination in this area in 2024 and again in 2025 suggests interesting details:
- The S & M isolated kame mostly lies against and on a bedrock controlled ridge. However, no topographic or depositional evidence for this deposit has as yet been found.
- The Drainage Line is a pronounced linear, which is clearly bedrock controlled, reflecting the bedrock structural grain, as is the case for many Bedrock Grooves in the area north of the Winooski along the foothills. A search for field evidence regarding drainage in 2024 and 2025, such as granular material as would be expected in association with substantial drainage, showed predominantly thick peat and muck associated with the numerous beaver ponds. It is possible that the granular material, if present, is buried.
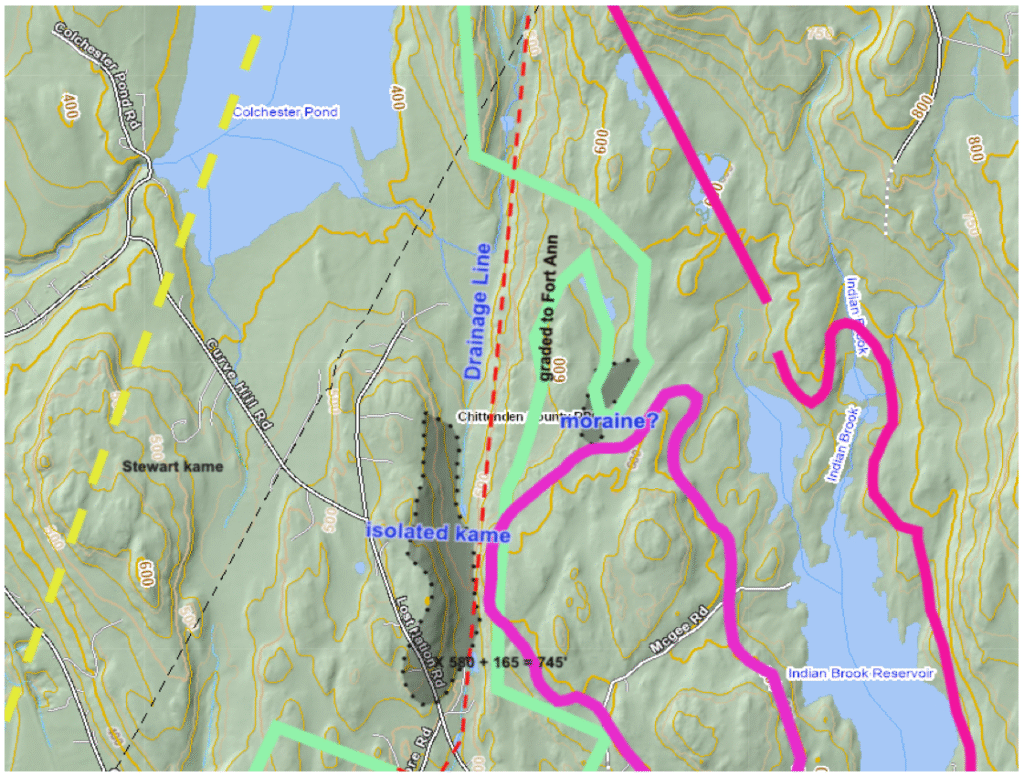
- Field reconnaissance in the area marked “moraine?” in 2024 and 2025 showed a strong linear topographic feature, located close to the western border of the Town of Essex Indian Brook Reservoir recreation area. The reservoir itself is man-made. The following is a map taken from an All Trails hiking app:
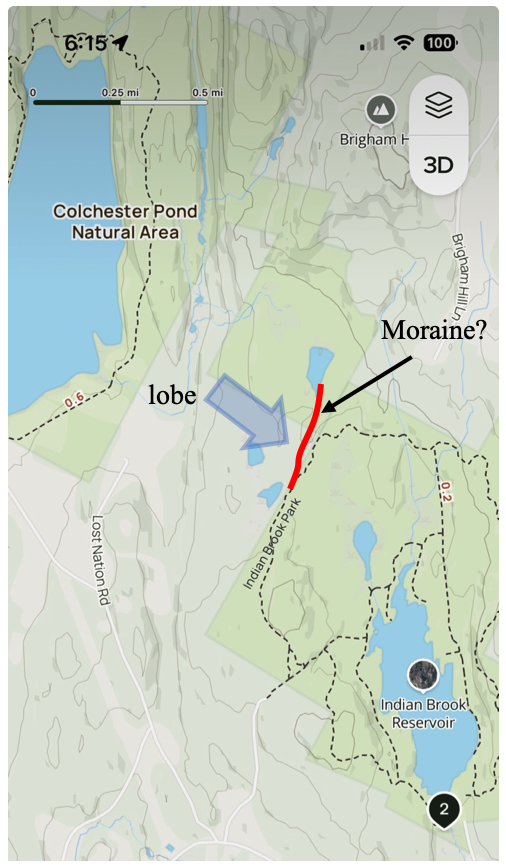
The feature identified as “Moraine?” on the above map consists of multiple prominent linear ridges. No exposures of the material composing the ridges were found. Many large erratic boulders are strewn on the surface of the ridges. However, bedrock exposures were also observed on the ridge indicating that the moraine-like ridge likely is not actually a moraine, at least in its entirety. The terrain in this area consists of multiple linear ridges, which likely are bedrock controlled, but part of the ice margin drainage similar to that associated with the Essex esker and the Colchester Pond Drainage Line as described above. Whereas the Essex esker seems to be related to the Fort Ann deltaic deposits at the mouth of the Winooski, the downgradient extent of the Colchester Pond and perhaps related drainage lines in the vicinity of the “moraine?” are uncertain and require further study.
e. Locale CV 8
This Locale is in the northwestern corner of Vermont where the T8 ice margin marks the Champlain Lobe which lies against and on the west side of a low relief but nevertheless prominent bedrock prong extending southwesterly from Quebec into the Missisquoi Basin. Within the Missisquoi Basin, as indicated by VCGI mapping, this Missisquoi sub-lobe extended up basin into the Lake Carmi sub-sub-basin, continuing northeastward where this sub-lobe joined with the Rivier Pike lobe which extended southwestward to the Berkshire area which was previously described as part of Locale CV5.
The following is a portion of the previously shown physiographic map which illustrates these lobes:
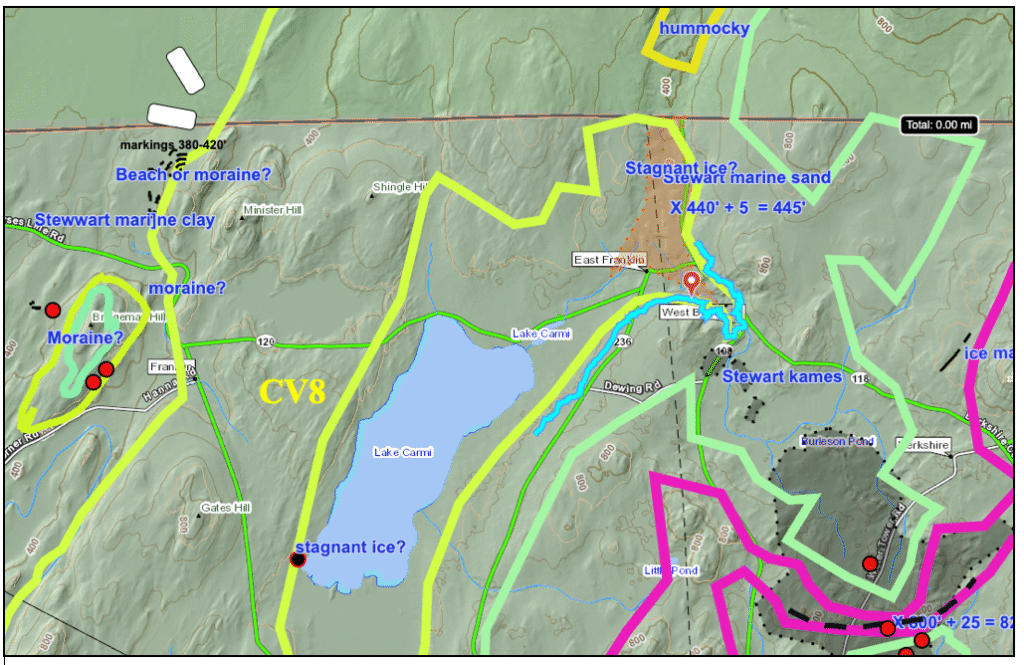
The following is an unmarked VCGI map for this Locale, with the State surficial geology map tab turned on:
The aforementioned prominent ridge composed of the substantial stagnant ice deposit near Berkshire marking the juncture of the Pike and Missisquoi lobes in the Berkshire area in T6 time is marked by a short maroon colored line. As can be seen, the State map shows predominantly glacial till ground moraine(ochre color). The dark green areas in the Pike Basin represent stagnant ice deposits which mark the progressive northwestward recession of the Pike lobe ice margin. The lighter green denotes “Lake Sand.” The topography in the area of the Lake Sand is uneven and not typically deltaic; it is likely that this deposit represents a kame delta deposit at an approximate local elevation of 540-560 feet, and an adjusted elevation of 550-570 feet. As such, this level is above the Champlain Sea which is at about 466 feet at the Canadian border, and below Fort Ann which is at nearly 700 feet. Thus, the deltaic deposit likely represents a local proglacial lake. As can be seen, the State map shows that the stagnant ice deposit and the deltaic sand are intimately associated with each other.
The following is a closeup screen shot showing the stagnant ice deposit as the gray shaded area with the 520 foot(158 m) elevation contour highlighted:
Stagnant ice features in the upper Pike Basin thus provide compelling evidence of ice margin recession of the Pike River Basin lobe from the T6 to the T7 and T8 levels and times. As described previously in Locale CV5 the Riviere Pike lobe extended southeastward where it abutted against the Missisquoi Lobe at T6 time where a prominent stagnant ice ridge formed (at the juncture where the Riviere Pike lobe abutted against the Missisquoi lobe). Subsequent recession separated these lobes.
Continuing the ice margin recession story, the following is a larger scale screen shot again with a portion of the 520 foot(158 m) contour highlighted in bright neon blue. The yellow colored T8 margins suggest the Pike lobe to the north separated from a lobe extending northward up the Lake Carmi Basin:
The russet colored area at the head of the T8 Lake Carmi lobe is a deposit identified on the State map as “marine sand.” The topography of this deposit includes brood flat areas at an elevation of about 445 feet, which is close to the Champlain Sea level at the marine limit as mapped by Wagner(1972). Thus, this deposit is regarded as a Champlain Sea delta at the marine limit. LiDAR imagery does not show evidence of stagnation. However, LiDAR imagery suggests stagnant ice topography along the flank of the Pike Basin on both sides of the Quebec border. It is possible that the delta deposit slightly followed after the T8 time but seems to be closely associated. A sand or gravel pit in this deposit merits field examination.
The T8 ice margin is traced further westward as depicted on VCGI based on its inferred elevation possibly marked at scattered locations by features which while intriguing may or may not be ice margin related, requiring field examination. As a final note, as discussed above the Lake Carmi area was mapped by Wright(2020) but ice margins such as discussed here are not recognized or discussed. 6Wright,(2020) Surficial Geology of the Lake Carmi Watershed and Adjacent Map Area “A,” Northwestern Vermont, Lake Carmi Watershed Project for the Vermont Geological Survey, 15 p. As indicated in the above, many reports by Wright and colleagues, generally in open-file reports for the Vermont Geological Survey, present remarkable details about the surficial geology, but do not attempt to delineate the presence of ice margins and associated deglacial history. Discussions with Wright in 2024 made clear that he believes that the delineation of such margins is needed, but that detailed mapping is required before such interpretations are made. This represents a philosophical difference of opinions. At that time, it was my hope that this could be done collaboratively, but unfortunately he takes issue with doing so. As suggested above, from my perspective, not including the recession of ice margins in the mapping process “squanders” an opportunity to look for and collect specific relevant information in the mapping process. In any case, all of this pertains to the matter of how the scientific understanding, in this case about deglacial history, can best be advanced, including the matter of paradigms and peer review.
Footnotes: