a. General
In three locations, all in similar physiographic settings near the mouths of major Champlain Basin tributaries, namely the Lower Missisquoi, Lamoille, and Winooski Basins, are sets of somewhat arcuate, nested grooves in the bedrock terrain, marking the southeastern corners of ice sheet sub-lobes projecting up into these basins. 1 Such corner locations are consistent with evidence indicating the tendency for both the ice sheet to press firmly against upland terrain in such settings and as well for drainage of meltwater on the ice sheet to be directed to such locations by its surface gradient. This pattern is discussed elsewhere herein with regard to “Ice Marginal Channels,” “Bedrock Grooves,” and the Shattuck Mountain Potholes, which are different types of ice margin features as discussed separately below. Shilts, in his report on deglacial history of the Lac Megantic area in Quebec, refers to lobe juncture locations as “pivot points. The Missisquoi features were recognized as marking drainage along the margin of the ice sheet in my mapping in the 1970s, although their full meaning was not then understood and was incorrectly interpreted. The Lamoille features were recognized during the course of this present VCGI mapping, based primarily on their distinctive pattern which is especially obvious on LiDAR imagery. To my knowledge this area and these features have never been examined by detailed mapping. The Winooski Grooves are in an area which I mapped in detail in the 1960s and 1970s and as well has likewise been subsequently mapped in detail by other researchers. The Grooves in this area were first recognized as such by my recent VCGI mapping, and are part of a detailed and very complex story about the recession of the ice margin related to changes of water levels in the Winooski and main basin.
As discussed further below all three of these sets of Ice Tongue Grooves appear to be graded or related to deltaic deposits and associated proglacial water levels:
- The Missisquoi Grooves to Champlain Sea delta deposits at the marine limit, with evidence of close ice proximity, and possibly as well to a lower marine strandline (which if correct would have significant implications regarding the presence of ice in late glacial and Champlain Sea time).
- The Lamoille Grooves to Fort Ann kame delta deposits.
- The Winooski Grooves, to both Coveville and Fort Ann level deposits, with a complex history, including a relationship to local proglacial Lake Mansfield (a large local proglacial water body in an interior lowland area within the Green Mountains, a successor to Lake Winooski), as discussed in detail in Locale W1 and other Winooski and Lamoille Basin Locales).
All three sets of Grooves are part of a larger deglacial history story involving rapid recession of the ice margin and a close relationship between the ice sheet and proglacial water body levels, whereby water level changes from Coveville to Fort Ann and Fort Ann to Champlain Sea occurred. These changes, which were both substantial and sudden, caused calving and the transformation of the eastern Champlain lobe margin from a lateral to a frontal margin. Calving was restricted to the main Champlain Basin, with the proglacial water bodies in each of these tributary Basins showing no evidence of calving, likely due to insufficient water depths.
Although the evidence obtained from VCGI mapping provides only “relative” and not “absolute” time differences, the evidence indicates that the recession of the ice sheet levels and margin positions took place very rapidly in a manner which is highly suggestive of a “collapse” of the Champlain lobe, consistent with its reverse gradient setting, beyond a “tipping point.”
Still further, the evidence related to this larger story indicates that:
- The recession of the Champlain lobe margin consisted of step-down sequence of deposits along the eastern margin of the Champlain lobe during much of its early recessional history, from the earliest T3 time in the Lobate Phase through T6 time. Whereas some evidence of lobes penetrating eastward into tributary basins along the flank of the Green Mountain at these times is found, with substantial stagnant ice deposits at frontal positions of these lobe tips indicative of localized deposition at frontal positions of these lobe tips, in general many scattered stagnant ice deposits are mapped on VCGI along this flank suggestive that these represent deposits formed along the lateral margin of the Champlain lobe, consistent with predominantly southward ice flow ice flow in the main Basin.
- However, beginning in late T6 time and continuing thereafter the evidence indicates that the eastern margin of the Champlain lobe is marked by substantial stagnant ice deposits along its eastern margin, indicating that these formed along the frontal margin of the Champlain lobe. This observation is consistent with a transformation of the eastern margin from a lateral type to a frontal type margin.
- Further, this transformation was associated with development of:
- A long narrow, more or less open water corridor, consistent with a “Disaggregated” ice margin as described in the literature, with progressive, substantial, and likely rapid northward standing water penetration of this corridor along the Champlain lobe eastern margin in Coveville to Fort Ann times, extending into Quebec (as marked by Lake Candona features as reported in the literature), in turn leading to the draining of Fort Ann. waters and the incursion of the Champlain Sea into the Champlain Basin.
- A calving south-facing frontal margin which likewise progressively receded northward from south to north, and as well calving of ice stream frontal margins (marked at grounding lines) in tributary re-entrant basins within the “Middlebury Bench.” This Bench was an important elevated physiographic foothill upland that likely served as a buttress support for the ice sheet. The elevation of the Bench was such that as the sheet thinned, fully penetrating crevasses (by hydrofracture?), led to the weakening of this support, with widespread stagnation, in a manner whereby calving developed along the eastern margin of ice streams in re-entrant basins in the Bench (such as the LaPlatte, Lewis, New Haven, and Little Otter Basins, with calving progressing in a direction from east to west.
In essence, this evidence indicates that the Champlain lobe underwent substantial transformation beginning in late T6 time, whereby the formerly lateral eastern margin of the lobe transformed into a frontal margin. This transformation was itself progressive from south to north, but likely progressed quite rapidly and was associated with the development of calving.
Further, the evidence indicates that this transformation was associated with and likely triggered first by the lowering of Lake Coveville to Fort Ann and then second by the lowering of Fort Ann to Champlain Sea water levels. These changes in water levels took place suddenly and were substantial. This evidence is consistent with well established observations that proglacial water bodies can serve as buttressing support for ice sheets, and that lowering of water levels can as well serve to diminish that support, as a major Glacial Dynamic.
In addition, the lowering from the Coveville to the Fort Ann levels corresponded with a) the “breakout” of proglacial Lake Iroquois in the Ontario Basin into the Champlain Basin, and b) the drainage history for Lakes Winooski and Mansfield (as described by Wright et al), both of which likely contributed to the Dynamic and associated instability.
Again, the associated water level lowerings were sudden and substantial which is here regarded as causing major Glacial Dynamic alterations of the ice sheet. The Ice Tongue Grooves are a part of this deglacial story.
During my research and writing of this report I had multiple “Epiphanies” (as reported in a separate section of this report below) indicating that a) this recession was rapid, involving the development of a long convex lobe of the ice sheet in the Champlain Basin, associated with both northward and westward recession of this convex lobe shaped ice margin, and b) that this recession was also marked by pulses, either as “readvances,” or alternatively “oscillations” of the ice margin, or more likely both, as reported in the literature, including some debate about the nature of these pulses as oscillations or readvances. Previously published reports by Cannon and Wagner in the Missisquoi Basin, by Wright in the main Champlain Basin near Charlotte, by Calkin in the Middlebury area, and by Connally further south in the main basin (as discussed in detail elsewhere herein) all point to instability of the ice margin, with Calkin in particular recognizing and debating the nature of the instability associated with the recession, leading him to suggest rapid recession by calving. And further, Wagner’s mapping in the 1970s recognized unusual deposits (several of which were likewise recognized by Van Hoesen in the Monkton area) which indicate and are consistent with rapid ice recession, calving, and ice margin instability. These are referred to as “Headless Deltas” and “Ribbed Lacustrine” deposits, located at scattered multiple locations in the Middlebury Bench, from as far north as the Missisquoi Basin, and as far south as the DeLong Hill and West Salisbury areas on the south end of the Middlebury Bench.
Further, the VCGI mapping evidence indicates this recession involved both active ice margins and stagnant ice margins, as “hybrid” ice margin pairs, with each showing a “dance” marked by recession of the active margin from an earlier time to the next lower position while its associated stagnant ice margin partner remained and persisted (likely owing to its insulating sediment cover). This pattern is referred to as a Style described as “Everything, Everywhere, All at Once, and Continuing,” to underscore the complexity of this spatially and temporally overlapping recessional history.
Still further, the distinction between active versus stagnant ice margins came to be recognized in this VCGI mapping as being significant with regard to meltwater drainage, with active ice margins capable of restraining and directing meltwater along ice margins, in contrast to stagnant ice margins where meltwater was able to penetrate and leak through the stagnant ice. Such drainage of course led to and was associated with proglacial water bodies impounded by active ice which in the early times of the step-down recession consisted of multiple local proglacial lakes. In time, these water bodies progressively coalesced, becoming larger and more regional in scale, eventually leading to Lake Vermont and the Champlain Sea. The development of such large water bodies contributed to the Glacial Dynamic because these were able to affect large portions of the Champlain lobe margin (both through heat transfer between water to ice and as well by physical buttressing support changes).
Ice Tongue Grooves are a significant part of the recessional history as just described. This history was exceedingly complex, as shown by details as discussed in a) the deglacial history section of this report, b) the presentation of Locales in the Appendix, and c) my appended Open Letter to the Vermont State Geologist. My understanding of this recessional history evolved during both my VCGI mapping and the writing of this report. (This complexity made this a difficult report to write and now as well makes it a challenging story to read and follow.)
My thinking led to various “Epiphanies,” as discussed below. Interestingly, at a late time in the writing of this report, as part of my “Epiphanies,” it was realized that linear groove-like features which I had previously identified on the eastern flank of Snake Mountain as “Ice Marginal Lines” may instead be part of a distended set of Ice Tongue Grooves at a similar setting at the mouth of the Otter Creek Basin. Thus, in general Ice Tongue Grooves, taken together as ice margin features, may represent conditions and events associated with the recession of ice tongues in the four major tributary Champlain basins, all of which, the evidence indicates, were occupied by substantial ice tongues as deglaciation progressed. The Otter Creek features differ from the Missisquoi, Lamoille, and Winooski features in that, if in fact these features are Ice Tongue Grooves, they occur as multiple, separate pieces across a larger, longer reach of the Otter Creek Basin mouth, perhaps a distension of the ice margin caused by the low slope of the Otter Creek Basin floor. They may have formed in Coveville or Fort Ann time, or perhaps both, although they may as well be associated with the transition from Lake Vermont to the Champlain Sea, The evidence indicates that the progression from Coveville to Fort Ann to Champlain Sea likely took place suddenly and rapidly over a relatively short span of time.
In general, Ice Tongue Grooves are interpreted as having formed along a steepened eastern Champlain lobe ice margin ice margin against uplands, representing destabilization and transformation of the eastern margin of the Champlain lobe from a lateral to a frontal margin.
The identification of the Ice Tongue Grooves and the interpretation of associated deglacial histories are based on two lines of evidence:
- Direct evidence associated with the features themselves, which suggests drainage along steeply sloping ice margins. As noted elsewhere below, steeply sloping ice margins are contrary to the “Bath Tub Model” which implicitly suggests flattened, low gradient margins. This steepening is believed to be related to the destabilization of the Champlain lobes eastern margin in conjunction with proglacial water bodies along receding ice margins. Whereas steep ice sheet gradients would at first seem to conflict with the Bath Tub Model, this evidence is seen as actually strengthening the case for Model in that ice margins became increasingly controlled by proglacial water bodies, the levels of which did not suffer from gradients as in the case of the ice sheet.
- Indirect or inferential circumstantial evidence taken from the larger regional deglacial history associated with step-down ice margin recession and the opening of these basins and the lowering of regional proglacial water levels from Coveville to Fort Ann Lake Vermont and from Fort Ann to Champlain Sea. As already noted, it is believed that these water level changes were associated with major Glacial Dynamics that included calving but as well, as just stated, destabilization and transformation of the eastern margin of the Champlain lobe from a lateral to a frontal margin.
In this introduction of Ice Tongue Grooves the focus is on the direct evidence. The larger body of indirect evidence is more challenging, in that this is part of a more complex deglacial history story involving information from other ice margin features and well the larger interpretation of deglacial history not yet introduced and discussed, as for example the step-down recession of the Champlain margin, the development of a narrow, “Dissaggregated” open water corridor along the eastern margin, and the triggering of calving. The indirect evidence related to the interpretation of Ice Tongue Grooves as representing destabilization and transformation of the eastern margin from a lateral to a frontal type margin is given in multiple places within the text in subsequent sections below, and also in the discussions of specific Locales at locations where Ice Tongue Grooves have been identified. These Locales include Locale CV6 for the Missisquoi lobe features, Locale L6 for the Lamoille lobe, Locales W1 for the Winooski lobe, and Locale CB2 which encompasses the Otter Creek basin features. In addition, the discussion of Epiphanies,” especially Epiphany #5, includes information pertaining to the destabilization of the ice margins.
The identification of the history as just described, as part of the progressive learning process, which is discussed in much more detail in subsequent sections below, entails fitting many pieces of a complex story together in a sensible, rational, and coherent way. And despite the fact that the way these pieces fit together is remarkable, as just noted going beyond the introduction of Ice Tongue Grooves as ice margin features, the historical meaning and significance with regard to destabilization is still at this point regarded as tentative, requiring further study. Such study likely will require follow-up examination in the field where such evidence is likely to be much more helpful than the type of information obtained from remote mapping from the VCGI study as reported here. VCGI mapping is quite limited and of course provides no subsurface stratigraphic and structural evidence which is critical for such historical “proof” of various hypotheses, again specifically including the nature of Ice Tongue Grooves as indicative of destabilization of the Champlain lobe. In historical matters such as this, where much of the evidence is indirect and circumstantial, such proof tends to be progressive and cumulative, in time serving as proof by the preponderance of the evidence.
To be clear, in my opinion the evidence for the identification of these features and this interpretation at this point is suggestive but not sufficient to conclusively prove that Ice Tongue Grooves indicate destabilization. Thus, these features and their interpretation are presented here as hypotheses which are believed to have merit, but require further study. 2 There are many examples of interpretations which are now established but began as theories requiring further study before they were widely accepted, as for example the theories of plate tectonics, evolution, and the Ice Ages. And of course, as well there are examples of theories which were discarded because they ultimately proved to be faulty and invalid, such as the theory of “catastrophism.”
Interestingly, in as much as this VCGI study is limited, by the nature of remote mapping, evidence has been reported in the literature which fits with and lends support to the destabilization/transformation hypothesis advanced here. Multiple reports, including for example by Stewart and MacClintock, Larsen, Cannon, Calkin, and most recently Wright, and his colleagues, present information about ice sheet flow directions and movement, including from striation evidence. This evidence is discussed at length in various reports, and interpreted in different ways. But such evidence is consistent with the hypothesis that the Champlain lobe at an early time extended far to the south in the basin with its eastern margin representing a lateral margin, in the sense of ice movement in the lobe being more or less southward. However, for example Cannon in the Missisquoi Basin, regards the striation evidence as indicating a late shift in ice movement to include an eastern component more directly up the Missisquoi Basin. Such evidence is compatible with the interpretation given here that the eastern margin transformed from a lateral to a frontal margin as part of its destabilization and collapse history.
In the following, findings for each of the four Ice Groove locations are described in detail. But again, this is only intended as an introductory overview, with much more detailed information presented in other sections of this report.
b.Missisquoi Ice Tongue Grooves
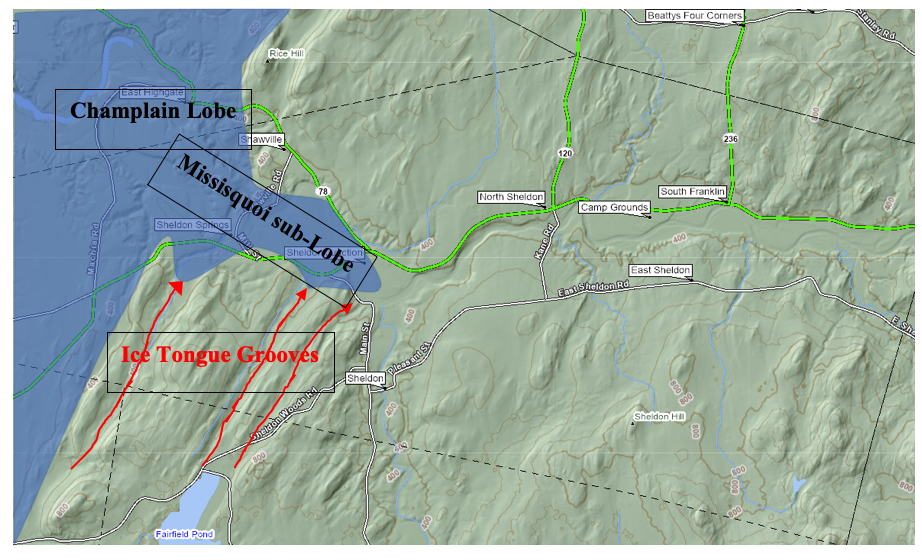
As discussed in Locale CV6, the surficial geology associated with the Missisquoi features is relatively well documented. My Open Letter to the Vermont State Geologist in Appendix E contains substantial information about these and similar ice margin features nearby, which clearly document the receding active margin in great detail, with substantial evidence indicating that drainage was diverted along multiple, progressively receding active ice margins, including the formation of the Ice Tongue Grooves. It is believed that this drainage enhanced pre-existing bedrock structural fabric. The Missisquoi Basin Ice Tongue Grooves are interpreted to be active ice margin features capable of restraining meltwater, with meltwater drainage extending down the Grooves along a steepened margin, graded to Champlain Sea deltaic sands at the marine limit. In addition, these Grooves include a kame terrace and kettle hole at the head of one of the Grooves indicating the presence of a stagnant ice margin, with drainage graded down the Grooves. Thus, the Missisquoi Ice Tongue Grooves likely represent hybrid type ice margin features.
By way of introduction, the following screen shot from the basic VCGI map shows the mouth of the Missisquoi Basin and the mapped Ice Tongue Grooves and gives a sense of the Missisquioi lobe at a late glacial time when the Ice Tongue Grooves were formed. The blue shaded area gives a sense of the Champlain lobe and its tributary lobe in the Missisquoi Basin at a late time, though the Ice Tongue Grooves themselves represent the progressive previous recession of this ice margin.
The following screen shot is from the VCGI map showing the mapped ice margins and other features, including the Ice Tongue Grooves in this basin:
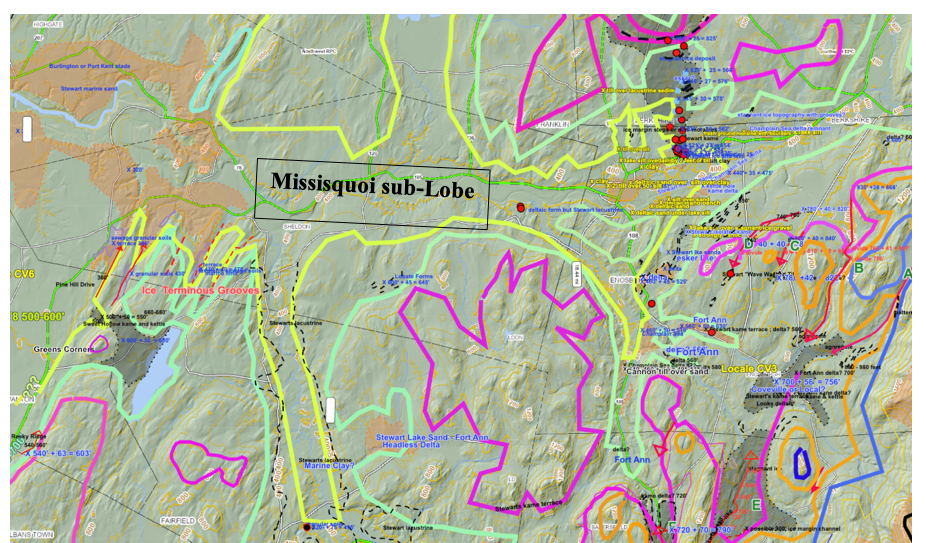
Note that this map was generated at an early time when the Ice Tongue Grooves were referred to as “Ice Terminous Grooves.” These features are located at the mouth of the Missisquoi.
The progressive recession of the ice margin is marked by:
- T4 margin – heavy blue line
- T5 margin – heavy orange line
- T6 margin – heavy maroon line
- T7 margin – heavy green line
- T8 margin – heavy yellow line
The details of the features on this map and the associated recessional history are provided in subsequent sections of this report, but the above map gives a sense of the progressive development of the ice margin recession and Ice Tongue Grooves formation along the receding ice margins.
c. Lamoille Basin Ice Tongue Grooves
Ice Tongue Grooves at the mouth of the Lamoille Basin are marked by red dashed lines, per the following VCGI map screen shot:
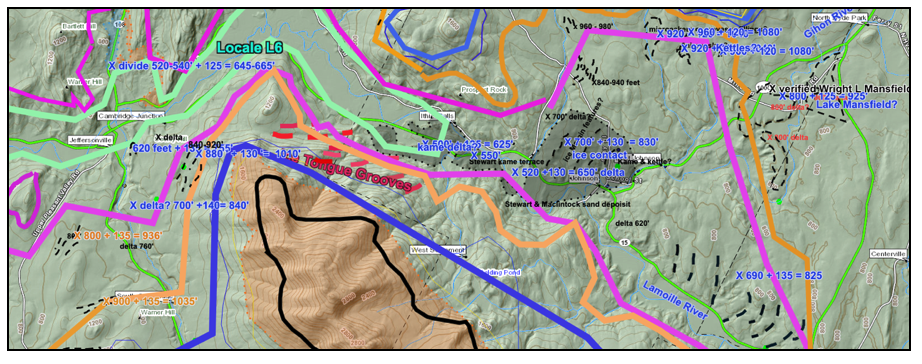
The location of the Ice Tongue Grooves is above Jeffersonville, where the Lamoille Basin transitions from the Champlain Basin floor and the foothills into the Green Mountains. As can be seen on the above map, the Grooves extend down the hillside on the south side of the Lamoille valley from the T4 margin time (blue line), through the T5 and T6 margin time (orange and maroon lines) to near the valley floor in conjunction with the sage colored T7 margin time. The Grooves likely were formed individually and progressively along a relatively steep ice margin, but this progression is not depicted on the above map.
In general, the T4-T7 margins in the Lamoille Basin, including the above map area and as well the area to the east, mark the progressive step-down recession like the oft stated “multiple rings on a slowly draining bath tub.” As discussed below in the section of this report dealing with deglacial history, without delving into details here, the margin of the Champlain lobe stood at the mouth of the Lamoille and along the foothills to the north and south, again as marked by the blue line T4 ice margin, the orange line T5 ice margin, the maroon line T6 ice margin, and the green colored T7 ice margin. These ice margins correspond with numerous ice margin features both to the north and south along the foothills, and as well within the ice tongue in the Lamoille Basin, again marking the progressive step-down recession of the ice sheet eastern lateral margin in the main basin and the Lamoille basin.
As can be seen, the Ice Tongue Grooves descend from the T4 margin high on the hillside to the T7 ice margin on the Lamoille Basin floor in close association with a substantial kame delta deposit (gray color shading) at the Fort Ann level on the basin floor. This kame delta can be seen on LiDAR imagery to have markings consistent with progressive ice margin recession.
The T4, T5, and T6 margins extend up-valley in the Lamoille Basin, marking the Lamoille ice tongue, where they are associated with kame deltas marking the strandlines of Lake Winooski and Lake Mansfield, and thus the Lamoille lobe of the ice sheet served as an ice dam for these water bodies, as in the Winooski Basin. Recessional ice margin features on the floor of the Lamoille Basin mark the progressive down-valley recession of the Lamoille lobe ice margin in T6 time, suggestive of a relatively rapid recession of the ice margin. The above map shows the westernmost T6 and T7 lobe tips associated with recession west of the village of Johnson.
Thus, the Ice Tongue Grooves appear to be related to the recession of the Lamoille lobe from an early time when it served as an ice dam for local upland lakes into the time when the basin opened for the invasion of Lake Vermont at the Fort Ann level.
If, as suggested here, the Ice Tongue Grooves formed at the margin of the Lamoille lobe ice tongue as it receded westerly, the question arises as to the formation of these features in the context of the “Bath Tub Model.” The Ice Tongue Grooves suggest relatively steep gradients of the lobe tip, with drainage from relatively high levels at 1200-1400 feet(366 – 427m) at T4 time or T5 levels at 1000-1100 feet(305-335 m), downward to the T6 and T 7 levels at 800-900 feet(244 – 274 m) and 600-700 feet(183 – 213m), whereas the Bath Tub Model operates under the presumption of relatively low ice surface gradients at each ice margin position and time. Thus, the relatively steep gradient of the Ice Tongue Grooves is problematical. This is as well the case with the other Ice Tongue Grooves.
The answer to this apparent conundrum is suggested by relatively recent glaciological literature, as discussed below, which indicates that ice sheet margins, including ice tongues fronted by standing water, tend to be unstable, all the more so for reverse bed gradient conditions, leading to destabilization, sometimes beyond a “tipping point” whereby destabilization may become self-reinforcing and thus continuing. These conditions tend to cause the destabilization of at least that portion of the ice sheet, as a Glacial Dynamic, with lowering of ice sheet margins, steepening of ice surface gradients and adjustment of ice stream flow directions, with accelerated steaming toward the water bodies, with increased ice margin recession, with or without calving depending on the local conditions. These conditions persist as the ice sheet attempts to adjust back toward a “normal,” glacial dynamic equilibrium condition. In this case, restabilization would have involved the transformation of the eastern margin of the Champlain lobe from a lateral margin to a frontal margin, at a new, lower frontal ice margin level. This interpretation applies to the Missisquoi and Winooski Basin Ice Tongue Grooves, and perhaps as well to possible Ice Tongue Grooves at the mouth of the Otter Creek Basin.
d. Winooski Basin Ice Tongue Grooves
As just noted, the information available pertaining to the Winooski Basin and environs, including the Ice Tongue Grooves is very substantial and quite complex, again as discussed for several Locales, most notably Locale W1 which includes substantial information pertaining to the Grooves. The following gives an overview of the available evidence about these features.
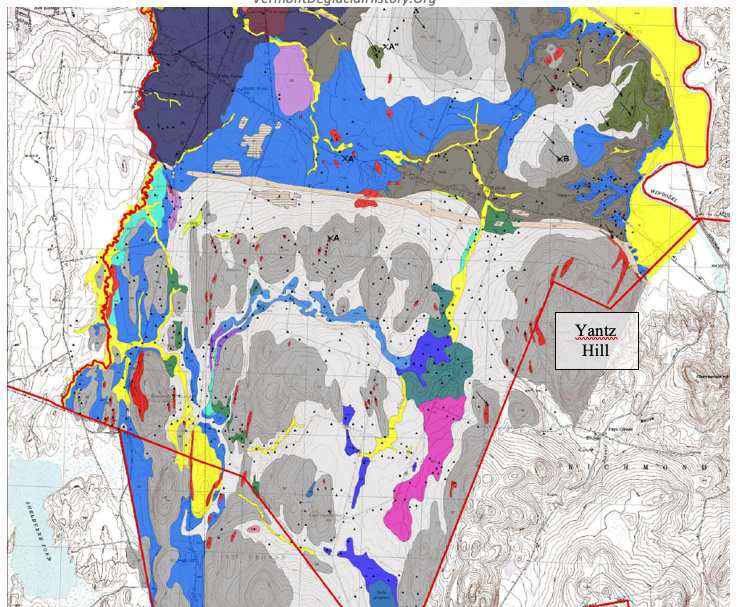
The following VCGI map is an enlarged view of the Yantz Hill area where the Ice Tongue Grooves (red colored dashed line arrows are located:
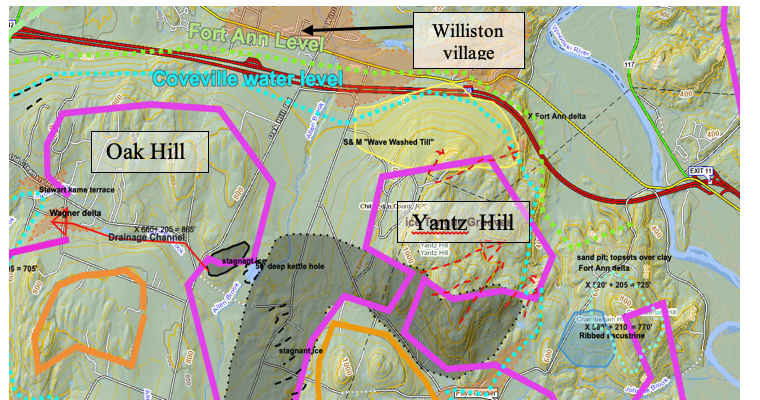
As can be seen, the Ice Tongue Grooves are on the northeast flank of Yantz Hill. These are associated with the T6 margin(maroon colored line), and are interpreted as indicating their formation in late T6 time along a receding active ice margin. The easternmost Grooves may be graded to deltaic deposits at the Coveville or Mansfield 2 level and the westernmost Grooves to the Fort Ann level, associated with the opening of the ice dam for Lake Mansfield 2. The “Wave Washed Till” deposit as mapped by Stewart and MacClintock on the north flank of Yantz Hill (yellow pattern on the above map) is regarded here as evidence of Lake Mansfield leakage beneath active ice, with drainage into a stagnant ice margin at the T6 level, as marked by the gray colored deposit on the above map, with LiDAR markings and an esker indicating southward drainage into the LaPlatte Basin associated with that basin’s calving ice stream. Thus, the ice recession is marked in this area by “hybrid” type margin features, with recession of the active margin taking place while stagnant ice persisted, again in the Style referred to herein as “Everything, Everywhere, All at Once and Continuing .”Also, a spillway outlet channel just south of Oak Hill approximately correlates with the level of Lake Mansfield 2 and likely represents drainage through a basal tunnel in the stagnant ice margin with an ice block at Mud Pond in Allen Brook Basin. This evidence underscores and signifies the recession of a temporally and spatially complex ice margin, not a simple line on a map as Vermont ice margins conventionally tend to be regarded. As shown on the above map, LiDAR features on the north side of Oak Hill mark the Coveville and Fort Ann levels.
In 2024 and 2025 the vicinity of the Ice Tongue Grooves was examined in a preliminary way. This confirmed that these are bonafide drainage features, although no evidence was found which would indicate drainage along an ice margin per se.
As discussed in more detail below, Springston and DeSimone (2007) mapped the Williston area, including the Yantz Hill area, per the following map:
Yantz Hill is located in the northeastern portion of the map area. The red colored tracts on Yantz Hill are identified as bedrock floored, which likewise fits with the interpretation given here, especially in that meltwater along an ice margin might reasonably be expected to erode surficial materials to expose bedrock. Whereas one of the tracts corresponds with an Ice Tongue Groove, not all such features correspond with Grooves.
e. Otter Creek Ice Tongue Grooves
After I had written much of this report, my continued thinking led me to reflect about Ice Tongue Grooves I had identified at the mouths of the Winooski, Lamoille, and Missisquoi Basins. As discussed below as one of my “Epiphanies,” it seemed to me that if my interpretation of these features as Ice Tongue Grooves is correct, then an examination of other basin mouths would be warranted. This led me to the mouth of the Otter Creek Basin, near Snake Mountain. In fact, features identified in that area would seem to fit with the hypothetical interpretation, or model, for such features and associated deglacial history.
The following map shows the features identified as possible Ice Tongue Grooves at the mouth of the Otter Creek Basin which lies between Buck and Snake Mountains :
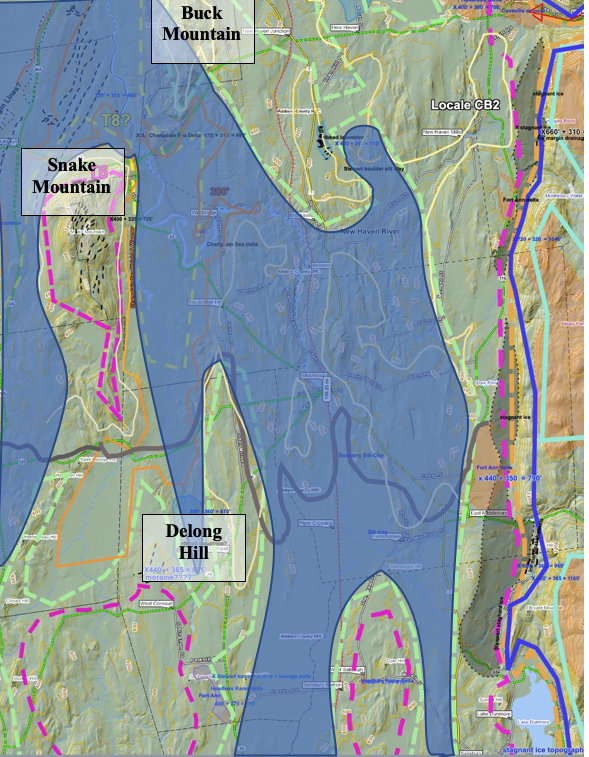
The blue shaded area represents ice coverage at T7 time, showing the Champlain lobe penetrating the mouth of the Otter Creek Basin. The Grooves are located on the eastern flank of Snake Mountain, above and successively down to the T6 level, which along with Buck Mountain to the north, mark the Basin mouth opening. The thin black dashed lines on the eastern flank of Snake Mountain represent the suspected Ice Tongue Grooves. Whereas these features likely reflect bedrock fabric, it is possible that drainage along the receding ice margin enhanced the linear depressions. Unlike the Ice Tongue Grooves mapped elsewhere these linears are not so markedly graded downward to a common level. This may reflect the low gradient of the Otter Creek Basin which may have distended the ice margin. Evidence for the close presence of an ice margin in the area is given by the Stewart and MacClintock map which shows a “kame moraine” deposit nearby to the south at DeLong Hill at an elevation of about 440 feet (134 m). This deposit is part of the evidence cited here, along with other evidence such as Headless Delta deposits, in support of a calving ice margin in close association with Fort Ann Lake Vermont. LiDAR imagery shows a moraine-like ridge nearby at West Cornwall at a similar elevation, in close association with a possible Ribbed Lacustrine deposit. LiDAR imagery of the Snake Mountain area shows a gravel pit on the south side of Snake Mountain at about this level, and a bench-like feature on the north side of Snake Mountain also at a similar level; these features may be Fort Ann strandline features but circumstantially the evidence raises the possibility of a close proximity of an ice margin at the T6/T7 levels, whereby Snake Mountain would have stood as a nunatak above the ice sheet at this level. Accordingly, the linears on the east flank of Snake Mountain can reasonably be interpreted as marking the recession of an ice margin, again at the mouth of Otter Creek Basin, in a manner consistent with Ice Tongue Grooves.
The difference between the mouth of the Otter Creek Basin versus other major Basins where Ice Tongue Grooves are identified is believed to be fundamentally attributable to physiographic differences in the configuration of the funnel- like openings of tributary basins. The gradient of the destabilized lateral ice margin stood against Basin mouth “funnels,” which especially for the Winooski and Lamoille Basins were relatively steep, sharp, and strong for both the ice sheet gradient, in conjunction with standing water at the ice margins. In contrast, the Otter Creek Basin mouth “funnel” is relatively less well defined, with a lower gradient, and at a position closer to the frontal lobe tip. As a consequence, the Champlain lobe ice tongue margin at T6 to T7 times at the Otter Creek Basin mouth, in association with and in response to the Coveville to Fort Ann transition, became much more distended in contrast to other Basin mouths and associated Ice Tongue Grooves.
f. Published Literature Relevant to Ice Tongue Grooves
Grooves formed at the margins of ice tongues are identified in the literature, much of which pertains more generally to calving ice margins. A thorough review of this literature is beyond the scope of this present report. A report by Quiquet et al(2021) [1] is cited here as examples of this literature. The following web site from the National Snow and Ice Data Center provides a diagram and description related to calving ice shelves which is especially applicable here: https://nsidc.org/learn/parts-cryosphere/ice-shelves/quick-facts-about-ice-shelves#anchor-how-do-ice-shelves-form-
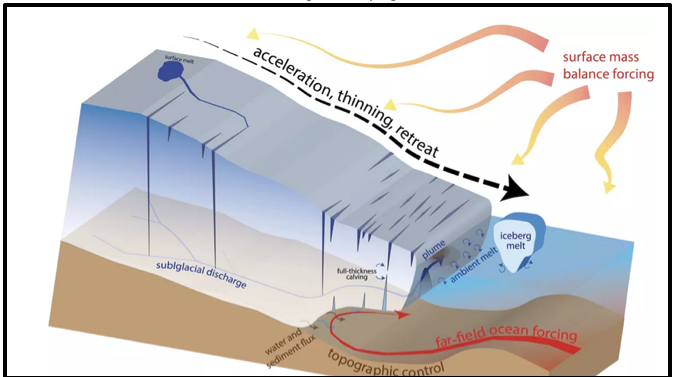
The web site states: “Two types of events occurring on ice shelves have attracted the attention of scientists. One kind is iceberg calving, a natural event. The other kind is disintegration, a newly recognized phenomenon associated with climate change.” Further, “Warm ocean water can break up an ice shelf into many pieces. The scientific community is adopting the term “disaggregation” in the most extreme cases where an ice shelf gets to the point that it looks like spilled Chiclets, a brand of candy-coated chewing gum.”
The reference to disaggregation with a “Chicklet” type ice margin is conceptually consistent with the penetration of standing water along an ice margin which is highly crevassed as suggested here for the step-down margin of the Champlain lobe giving way to standing water bodies, as described above. This concept, specifically “disaggregation” and associated destabilization, is believed to be pertinent here. The evidence indicates, again as discussed below, that calving of the frontal tips of ice streams occurred in the re-entrants in the Middlebury Bench, but that calving of the Winooski, Lamoille, Missisquoi and Otter Creek basins ice lobes generally did not occur, presumably owing to the relatively shallow depths of Lakes Coveville and Fort Ann in these basins.
The above quoted Web text illustrates and underscore the effectiveness of meltwater and standing water, especially with changes in standing water levels, as an accelerant for water penetration along and through fracture networks in the ice margin, resulting in destabilization. The reference to “Disaggregation” suggests a highly fractured, labyrinthian ice margin by which Fort Ann waters were able to penetrate the “Chicklet-like,” fragmented narrow corridor along the ice margin, first into the Winooski, and then northward from the Winooski basin to the Lamoille Basin and continuing northward to the Quebec border and beyond, leading to the opening of the ice barrier with the incursion of the Champlain Sea, which is likewise marked by Ice Tongue Grooves in the lower Missisquoi Basin. Again, this is discussed in more detail in the Deglacial History Section below.
In essence, the observation that the Ice Tongue Grooves span a range of elevations is consistent with the steepening of the ice sheet surface gradient toward the east, thus resolving the aforementioned “conundrum.” Whereas the ice sheet surface, by its steepening departed from the Bath Tub Model, this explanation for Ice Tongue Grooves is compatible with and actually strengthens the Model as the Grooves mark the ice sheet transition toward a lowered eastern margin in transition from a lateral to a frontal margin. Destabilization dynamics are the ice sheets way of shifting toward and re-establishing “normalcy,” speaking to the power of standing and flowing water as an accelerant for ice recession and control of ice margins The ice sheet surface at the time of the formation of the Ice Tongue Grooves time had a relatively steep lateral gradient toward a base level dictated by the standing water body at the ice margin in the corridor.
It is believed that Ice Tongue Grooves and associated corridor represent a unique, distinct and very important “Glacier Dynamic.” The evidence indicates, again as presented and discussed in the Deglacial History section below, that the ice margin was grounded in the foothills, but that low, standing water areas in the foothills became progressively interconnected forming very irregular pathways within a narrow corridor for the northward advance of local proglacial lake waters within and between the grounded ice mass and the mountain front in early T6 time, and that lowering of Lake Vermont from the Coveville to Fort Ann levels caused instability resulting in opening or widening of the narrow corridor associated with the draining Lake Mansfield, and development of a calving ice shelf on the south facing front of the Champlain lobe.
Of course, again, all of this is predicated on the premise that Ice Tongue Grooves are valid features, in a manner consistent with this explanation, which is a matter for future investigation, especially by field study. If this explanation is correct it suggests that the recession of the Champlain lobe was controlled and accelerated by the action of standing water from an early time. Because the chronologic information contained in the geologic record given here is all in relative and not in absolute terms, it is not possible to establish the actual speed or duration of the recession, but the evidence suggests that this recession was relatively fast and brief, which is supported by evidence related to calving ice margin features as discussed below.
As just explained, the explanation for Ice Tongue Grooves given above represents a model of considerable importance for the deglacial history of Vermont, and by implication may as well bear on modern day ice sheets and the issue of global warming. It appears that destabilization occurred during deglaciation of the Champlain Basin, especially at later times when meltwater and proglacial standing waters were substantial and had coalesced into regional water bodies. The extent to which this was local versus having more regional impact on the ice sheet beyond Vermont is uncertain, but given that Ice Tongue Grooves are identified in multiple locations in the Champlain Basin, from Coveville and early Fort Ann to late Fort Ann time transitioning into Champlain Sea time, suggests that this represents a major Glacial Dynamic representing a period of recession induced by the effects of accelerated standing water penetration along lateral ice margins.
Footnotes: