a. Locale W1
This Locale encompasses the foothills area near the mouth of the Winooski Basin, portions of which are also included in Locale CB2, per the following screenshot, taken from my VCGI map:
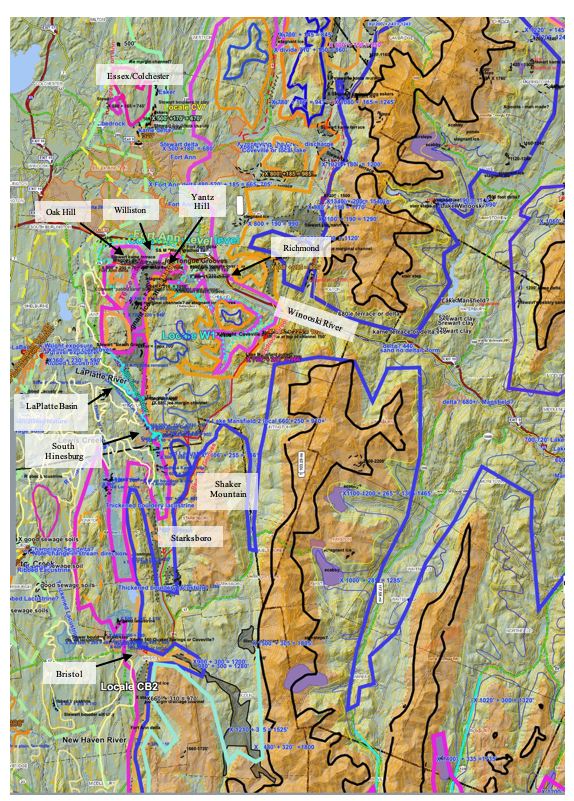
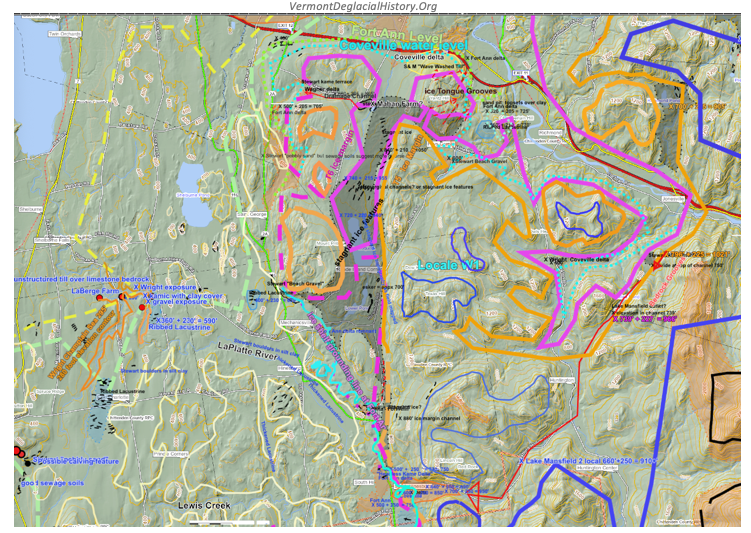
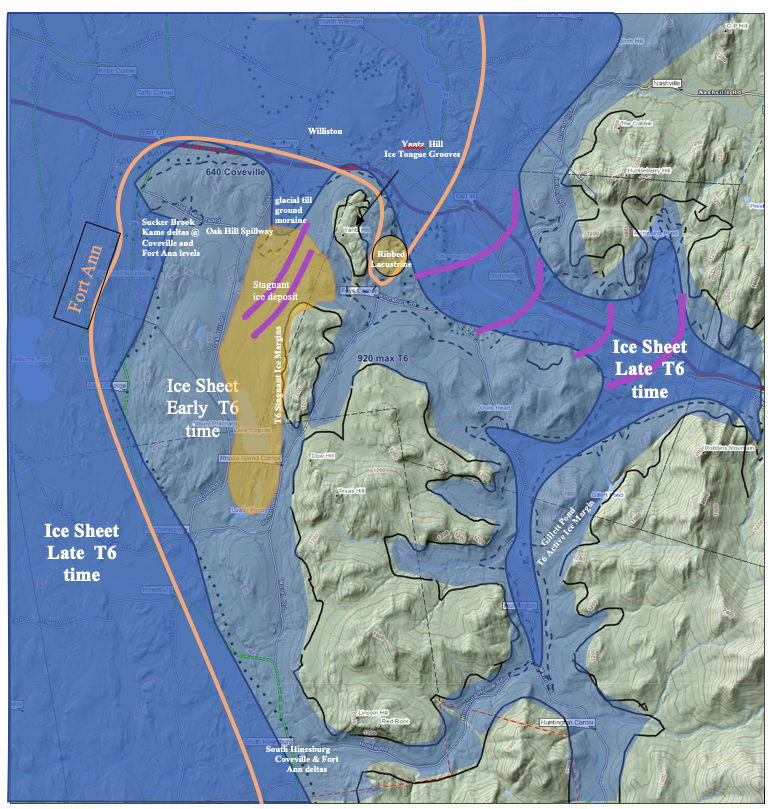
Owing to the large scale of this map, many of the features described in the following are difficult to see. With this in mind the following is an enlarged screen shot of a portion of Locale W1:
- The Winooski River is labeled, with the Colchester and Essex vicinities to the north.
- The villages of Williston and Richmond are close to the present day Winooski River.
- The villages of South Hinesburg, Starksboro, and Bristol are likewise identified.
- The heavy black line marks the 2000 foot(610 m) “local” elevation contour, the thin yellow line the 400 foot (122 m) contour, and the solid neon blue line in the LaPlatte Basin the 500 foot ( 152 m) contour which is associated with Fort Ann Lake Vermont.
- The large ochre colored areas in the uplands represent terrain above 1600 feet (488m)
- The heavy blue, orange, maroon, and sage, and yellow colored lines demarcate the T4 1200-1400 foot (366-427 m), T5 (1000-1100 foot (305 – 335 m), T6 800-900 foot (244 – 274 m), T7 600-700 foot(183 – 213 m), and T8 500-600 foot(152 -183 m) ice margins respectively.
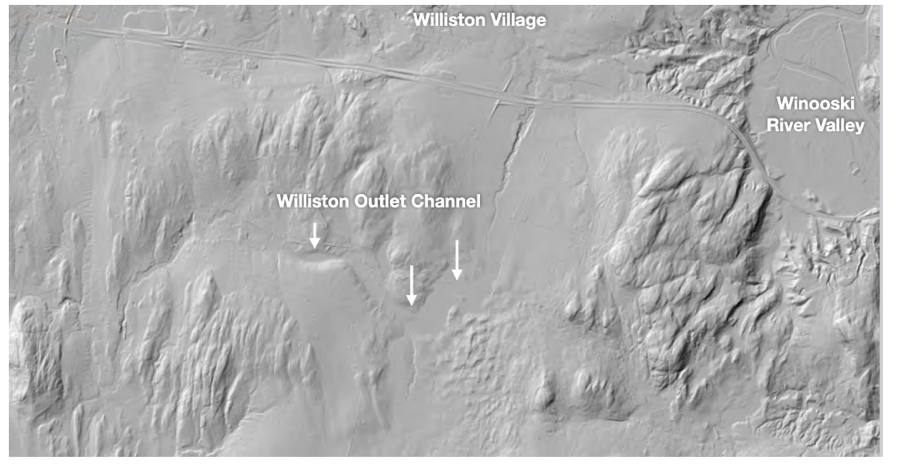
- Yantz Hill, just south of the Winooski River, east of Williston is identified. Ice Tongue Grooves, as previously discussed, are located, on the northeast flank of Yantz Hill. These are marked by red arrows, as can be seen on the enlarged map above. The eastern Grooves are believed to be graded to either the Coveville Lake Vermont level or Lake Mansfield 2 level (as discussed below),and the western Grooves to the Fort Ann level.
- Immediately to the east of Yantz Hill is a physiographic indentation where Fort Ann deltaic deposits, and as well a Ribbed Lacustrine deposit are identified, the latter marked by the small blue colored shading. The latter is interpreted as representing the presence of stagnant ice, with a lacustrine sediment veneer associated with the lowering of Lake Vermont from the Coveville to the Fort Ann levels. This deposit relates to both the issue of the presence of Coveville Lake Vermont in the Winooski Basin, versus Lake Mansfield 2, and as well to the formation of the Ice Tongue Grooves, as discussed further below. Chapman’s mapping did not identify Coveville deposits in the Winooski Basin, but he identified a Coveville beach near Milton to the north as the northern extent of Lake Coveville. In my mapping in the 1970s I did not identify Coveville deposits in the Winooski Basin. However, Wright, who mapped this basin in considerable detail, suggested the presence of Coveville in the Winooski (and as well northward to the Quebec border). Both Chapman’s and my documentation shows considerable scatter of Coveville features, which makes the delineation of this strandline uncertain. The distinction between Coveville versus local proglacial lake deposits is difficult to make. However, deltaic deposits at Bristol and South Hinesburg are major features which are interpreted as Coveville. As discussed below the projected Coveville elevation in the Winooski Basin is very close to the elevation of Lake Mansfield 2. In my opinion, the matter of Coveville in this Basin remains an open, unresolved matter, though Wright may have evidence supporting his findings.
- Immediately to the west, on the north flank of Yantz Hill, is a deposit mapped by Stewart and MacClintock as “Wave Washed Till,” which is here interpreted as related to drainage of proglacial Lake Mansfield 2.
- The gray colored area, south of Williston, is a major stagnant ice deposit representing T6 time, as discussed further below.
- On the floor of the Winooski Basin at its mouth in the North Williston vicinity is an ochre colored sprawling, shoaling type deltaic deposit, representing the Winooski River Fort Ann delta.
- At South Hinesburg is a major deltaic deposit, marked by ochre colored shading, representing four levels, including two upper local water bodies, a third at the Coveville level, and the lowest fourth level marking Lake Fort Ann. The upper three levels are prominent Gilbert-type deltas and the lowest is a shoaling type delta. Immediately south of this delta complex are Ribbed Lacustrine and Headless delta deposits in the LaPlatte Basin marking the lowering of Lake Vermont from the Coveville to the Fort Ann level and the initiation of calving. This calving is regarded as the second phase of calving, the first phase being associated with the ‘Deep Lake” portion of the basin in earlier Coveville time.
- The village of Bristol is located on a Gilbert-type delta at the Coveville level, with a lower sprawling or shoaling type delta to the west at the Fort Ann level. This area likewise is marked by substantial Headless Delta and Ribbed Lacustrine deposits as part of the second phase of calving.
- Bedrock Grooves are marked by red arrows in the uplands in the eastern part of the map area. A Bedrock Groove at the T4 level on the west flank of Shaker Mountain corresponds with drainage toward the Coveville Bristol delta. However, this delta was constructed primarily by drainage from a T4-T6 stagnant ice margin in the Starksboro vicinity for a tributary lobe occupying the headwaters of the La Platte and Lewis Creek Basins.
- Another set of Bedrock Grooves at multiple levels at the T5 and T6 margins are in the Gillett Pond vicinity. As discussed below, previous research by Wright et al has identified Gillett Pond as the outlet for Lake Mansfield 1, which was a substantial proglacial water body in the upland interior. Slight ice margin recession opened a lower outlet for Lake Mansfield 2. A Drainage Line (red arrow) on the VCGI map symbolizes the drainage for both Lake Mansfield 1 and 2, leading to the Coveville delta at South Hinesburg as suggested by Wright et al, again as discussed below.
- The active and stagnant T4-T6 ice margin features in this area represent a hybrid type margin, with the evidence indicating an “Everything, Everywhere All at Once, and Continuing” Style of deglacial history. This complexity is further discussed and illustrated for Locale W1. Both the elevation of the Bedrock Groove at Gillette Pond and the top, upper elevation of the of the major stagnant ice at Williston are at the same elevation, marking the T6 ice margin. Thus both Lake Mansfield 2 drainage at the T6 margin and stagnation of the T6 margin at Williston occurred at the same time. However, the latter was more persistent, likely owing to its sediment cover.
- On the south flank of Oak Hill is a drainage saddle separating the drainage in the Williston area for Allen Brook in the Williston vicinity from a drainage basin for Sucker Brook. A very distinct spillway channel on the divide and extending westward down Sucker Brook basin was previously identified by Wagner (1972), by Springston and DeSimone in their mapping of the Williston area, and by Wright et al in their mapping of the Winooski Basin and environs. Wagner regarded this channel as marking a local proglacial lake mapped as Lake Jericho which extended northward along the foothills to a deltaic deposit at Underhill, which in turn formed from drainage across a prominent spillway at The Creek. Springston and DeSimone interpreted drainage along Sucker Brook as relating to ice proximal deltaic deposits which my recent re-mapping identifiers as Coveville and Fort Ann.
- Bright green and blue dotted lines extend along possible strandlines for Coveville and Fort Ann waters along the north flanks of Oak Hill and Yantz Hill. These are locally marked by streaks on LiDAR imagery on the northwest flank of Oak Hill, presumably strandline markings, but otherwise are inferred based on topographic strandline projection based on my 1972 profiles..
- The LaPLatte Basin, which was a significant physiographic re-entrant in the Middlebury Bench related to an ice stream and the development of a calving margin in T7 and Fort Ann times, is labeled. The present day 400 foot (122 m) contour marked by the thin pale yellow line gives a sense of the LaPlatte Basin physiography. The solid neon blue line marks the 500 foot (152 m) contour along a northern portion of the LaPlatte Basin; this elevation is close to the Fort Ann Lake Vermont level, as marked by multiple caving margin features in this Basin, and by the fourth, lowest Hollow Brook delta at South Hinesburg. Drainage southward from the Williston stagnant ice deposit into the La Platte Basin extends into Headless Delta deposits at the Fort Ann level. The calving ice margin history of the LaPlatte Basin is discussed in detail elsewhere herein.
The deglacial history of the W2 area is obviously complex. By way of a general, regional overview introduction, the T4, T5, and T6 margins, as shown by the heavy blue, orange, and maroon lines respectively, are extensively mapped on VCGI along the foothills throughout the Champlain Basin, from the Quebec border to southern Vermont. Together these margins generally represent the step-down recession of the eastern lateral margin of the Champlain lobe along the Green Mountain western flank. Along much of the foothills this T4-T6 stepdown sequence is marked by closely spaced stagnant ice deposits which are difficult to distinguish. However, as already noted, sub-lobes or ice tongues extended into the major sub-basins in T4-T6 times, including the Missisquoi, Lamoille, Winooski, and Otter Creek Basin. These major lobes are marked by various deposits showing significant ice flow up these basins, with lobe tips marked by frontal ice margins features. Whereas elsewhere along the foothills the T4-T6 stagnant ice deposits generally represent lateral ice margins, some of the other smaller but nevertheless substantial tributary basins likewise were occupied by ice lobes with stagnant ice deposits at lobe tips marking frontal margins. For example, the re-entrant basins in the Middlebury Bench, including the LaPlatte, Lewis, New Haven, and Little Otter Creek basins were occupied by ice lobes having frontal margins at lobe tips. Likewise, the Middlebury and Neshobe River basins likewise are in this category.
The distinction between lateral versus frontal margins is important. As discussed above, in the previous discussion of Ice Tongue Grooves, it was noted that the eastern margin of the Champlain lobe transformed from a lateral to a frontal margin associated with the progressive northward penetration of a long narrow, more or less open water “Disaggregated” ice margin associated with T4-T6 stepdown margins. This corridor developed in early T6 time in the Rutland/Proctor area in conjunction with Coveville Lake Vermont, reaching the vicinity of Locale W1, generally near the mouth of the Winooski Basin in later T6 time. The step-down T4-T6 margin in this Locale is marked by hybrid active and stagnant ice margin features having simultaneous and partially overlapping but to some extent separate and distinctive histories. The major stagnant ice deposit south of Williston is unique in that it is one of the more substantial such deposit in Vermont and yet lies along the flank of the foothills and not at the tip of a basin but instead occupies an interfluve. LiDAR markings show this deposit developed progressively to the northwest in T6 time. This deposit is interpreted as marking the destabilization of the Champlain lobe and tranformation of its eastern margin in late T6 time from a lateral to a frontal type, triggered by the sudden and substantial lowering of Lake Vermont from the Coveville to Fort Ann levels.This lowering led to the rapid recession of the lobe margin, including by calving and as well the further northward penetration of the narrow open water corridor reaching first the Lamoille Basin T7 time and as marked by Ice Tongue Grooves in the Lamoille Basin, then progressing northward to and beyond the Missisquoi Basin and the Quebec border in later T7 time.
Further, the lowering of Fort Ann Lake Vermont to the Champlain Sea in early T8 time which likewise was substantial and sudden gave impetus to an additional phase of calving, and as well continuing transformation of the northern portion of the eastern margin of the Champlain lobe in the Missisquoi Basin from a lateral to a frontal type. As discussed elsewhere the evidence in the Missisquoi Basin documents a readvance in later T8 time. The T8 margin as presently mapped on VCGI suggests a long convex lobe, marked for example by the T7-T8 Fort Ann to Champlain Sea transition in the LaPlatte and other Basins in the Middlebury Bench, extending southward to the Bridport area.
Thus, as summarized by the preceding overview the W1 Locale is important as it marks a substantial and significant time associated with the rapid demise of the Champlain lobe.
Again, the T6 stagnant ice margin deposit located along the foothills from the Williston vicinity southward to the Hinesburg vicinity is thus regarded as quite significant. marking the transformation of the Champlin lobe eastern margin in this vicinity from a lateral to a frontal type in late T6 time, associated with lowering of Lake Vermont from Coveville to Fort Ann levels, and the opening of the Winooski Basin for the draining of the Lake Winooski/Lake Mansfield complex. As noted this time is also correlated with the “breakout” of Lake Iroquois in the Ontario Basin into the Champlain Basin at Covey Hill. This deposit exhibits some of the best, strongest, examples of stagnant ice terrain found in Vermont, even visible on satellite imagery. Field examination of this deposit in the vicinity immediately east of Lake Iroquois shows very pronounced semi-linear kamic ridges. The Lake Iroquois Walking Trail, developed and maintained by the Lake Iroquois Association, traverses remarkably strong stagnant ice topography. LiDAR imagery shows an esker in the southern portion of this deposit indicating southward drainage into the La Platte Basin, graded to deltaic deposits, including Headless Deltas, at the Fort Ann Lake Vermont level and time, and as well including an association with Ribbed Lacustrine deposits. These were related to the development of the calving margin in the LaPlatte Basin, one of the re-entrant basins in the Middlebury Bench.
LiDAR imagery on VCGI shows well developed lobate arcuate shaped linear features on the Wiliston stagnant ice deposit, suggestive of progressive northwestward recession of the ice margin in T6 time. The northern portion of this deposit is marked by stagnant ice features, extending across the Allen Brook basin, punctuated by a 50 foot deep kettle hole at Mud Pond, with the geomorphic evidence suggesting drainage, likely from a subglacial tunnel leading to the aforementioned spillway channel along Sucker Brook on the south flank of Oak Hill, whichagain is interpreted here as graded to a delta at first the Coveville level and then further west and downgradient at the Fort Ann level. As noted, Sucker Brook history was previously reported by both Springston and DeSimone and by Wright who identified deltaic deposits interpreted as having formed in close proximity to the ice margin.
Having given an overview, the following is a summary of highlights of the recessional history in this W2 Locale area, with reference to the above maps:
- At an early T 6 time the ice margin stood in the Starksboro vicinity, at the head of the LaPlatte and Lewis Creek Basins, where a substantial stagnant ice margin was formed at the frontal tip of this LaPlatte/Lewis lobe. Outwash marks a drainage line to a major Gilbert type delta at Bristol marking the Coveville level. At the same time drainage associated with the Bedrock Grooves on Shaker Mountain contributed to this delta formation. The Bristol delta formed in the narrow open water Disaggregated corridor that extended at that time northward along the Champlain lobe from the Proctor area near Rutland at the mouth of the Vermont Valley. It is inferred that the major stagnant ice deposit south of Williston began to form at this time.
- Continued recession of this ice lobe margin in later T6 time led to the further northward extension of the Coveville open water corridor to the South Hinesburg vicinity, where and when the major delta at the Coveville level was formed. This delta was constructed by drainage associated with recession of the margin to the T6 Bedrock Groove ice margin position at Gillett Pond, basically consistent with the interpretation given by Wright et al, associated with the lowering of Lake Winooski to the Lake Mansfield 1 level. This interpretation requires that Winooski basin continued to be blocked by the Winooski lobe at this time. This blockage is marked by the major stagnant ice deposit south of Williston.
- Still further recession of ice within the deposit south of Williston was associated with recession of the Winooski lobe, leading to the initiation of drainage of Lake Mansfield 1, via subglacial leakage (per the “Wave Washed Till deposit) and by a subglacial tunnel in late T6 time which debouched so as to form the spillway south of Oak Hill, 1 As noted, Wagner (1972) identified this spillway as related to his Lake Jeicho which extends northward to a delta at Underhill, which formed in conjunction from drainage of a local proglacial lake in the Lamoille Basin, with drainage controlled by a pronounced drainage channel associated with The Creek. with drainage graded from the spillway to a deltaic deposit along Sucker Brook at the Coveville level. The elevation of the spillway is basically the same as the elevation of Lake Mansfield 2, suggesting that the control for Lake Mansfield 2 was at Oak Hill and not the divide at Hollow Brook as suggested by Wright et al, where no spillway has been identified by my mapping. This last issue is discussed further below.
- The Ice Tongue Grooves on Yantz Hill likely formed in conjunction with the transition of the Champlain lobe eastern margin from a lateral to a frontal margin at about this time same time. It is suggested but remains uncertain that the easternmost Grooves are graded to either the Coveville or Lake Mansfield 2 level. The western most Grooves appear to be graded to the Fort Ann level.
- The lowering of Lake Vermont from the Coveville level to the Fort Ann level is marked by numerous features in this Locale:
a. Ribbed Lacustrine and Headless delta deposits immediately south of the South Hinesburg Coveville delta were formed by the inundation of remnant stagnant ice deposits, marking the initiation of T7 time and Fort Ann time, triggering calving in the La Platte Basin re-entrant.
b. Ribbed Lacustrine and Headless delta deposits immediately south of the South Hinesburg Coveville delta were formed by the inundation of remnant stagnant ice deposits, marking the initiation of T7 time and Fort Ann time, triggering calving in the La Platte Basin re-entrant.
c. drainage along Sucker Brook led to the formation of a Fort Ann delta, in close proximity to the ice margin, as suggested by Springston and DeSimone. By this time, the drainage of Lake Mansfield 1 had completed.
As just discussed, the above deglacial history relates proglacial water bodies in an interior upland area in the Winooski and Lamoille Basins. Major proglacial lakes in these basins have been mapped by multiple investigators, including Stewart and MacClintock in their statewide surfical geology mapping, by myself (Wagner, 1972), and most recently by Wright and Springston et al, 2020)[1] Wright and Springston et al generated maps, per the following, depicting strandlines and footprints for three major proglacial lakes, including Lake Winooski, Lake Mansfield 1, and Lake Mansfield 2, in order from oldest to youngest:
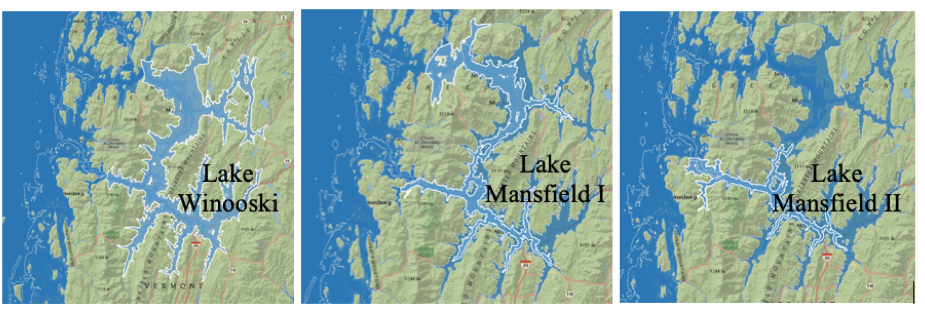
As noted elsewhere, Springston et al did not actually map the ice margin positions associated with these proglacial water bodies, but inferred the positions of ice dams based on strandline deposits and physiographic information. According to Springston et al:
- Lake Winooski was controlled by an outlet near Williamstown which drained southward into the Connecticut Basin at a local elevation of about 914 feet (adjusted elevation 1129 feet, or 344 m).
- Mansfield I was controlled by an outlet at Gillett Pond east of South Hinesburg with drainage into the Champlain Basin, at a local elevation of 739 feet(225 m) (adjusted elevation of 966 feet(295 m), to a major delta at South Hinesburg.
- Lake Mansfield II was controlled by an outlet at a divide between the Huntington Basin and the Hollow Brook Basin at local elevation of 660 feet(201 m)(adjusted elevation of 910 feet(277 m), with drainage to the delta at South Hinesburg. Both Lakes Mansfield 1 and 2 drained via Hollow Brook to a delta at South Hinesburg at the Coveville level.
VCGI mapping, which focused on ice margin positions, is in general agreement with these findings, albeit with some differences:
- VCGI mapping indicates that the Champlain lobe associated with Lake Winooski in T3/T4 times extended substantially into the Winooski and Lamoille Basins with the ice margin relatively close to the strandline of, and likely controlled by, Lake Winooski, as discussed in other Locales.
- The outlet for Lake Mansfield I at Gillett Pond (identified on the above VCGI map) lies in a Bedrock Groove, which marks the margin of the active ice sheet at T6 time. Multiple Bedrock Grooves are mapped in this area, showing the progressive recession of the active ice margin against the northwestern flank of the Green Mountains. The highest Groove, southeast of South Hinesburg in the uplands near Shaker Mountain represents drainage along the ice margin on the western Green Mountain flank, west of the ridgeline while Lake Winooski occupied the lowland to the east of the ridgeline. Further to the north, are multiple Bedrock Grooves, including the Gillett Pond feature, which are at slightly different elevations, raising the possibility that Lake Mansfield I may actually have included a range of levels.
- The outlet for Lake Mansfield II, at the drainage divide between the Huntington River and Hollow Brook, is not marked by a well-developed, incised spillway type channel, which is surprising given the expected magnitude of associated drainage. It is here believed that the drainage for Lake Mansfield 2 was at the Oak Hill spillway. The elevation of this spillway channel corresponds with the elevation of Lake Mansfield II as described by Springston et al. Lake Mansfield II likely as well corresponds with Wagner’s (1972) Lake Jericho which is marked by a deltaic deposit at Underhill formed by drainage across a divide at The Creek associated with drainage of the T6 margin.
Additional information in regard to the water bodies in the Winooski Basin was given by Wright (2018) in a GSA poster session. 2Wright, S.F., 2018, The evolution of glacial lakes in the Winooski River valley, Vermont: Geological Society of America , Abstracts with Programs, v. 50, no. 2, paper 37 https://anrweb.vt.gov/PubDocs/DEC/GEO/MiscPubs/Wright2018GlacialNEGSA.pdf Wrights maps for these water bodies are similar to the above but are included here as they more clearly show Wright’s inferred ice margins:
1 Lake Winooski:
This is Wright’s depiction of Lake Winooski, said to be controlled by an outlet south of Williamstown at an elevation of 279 m (915’), with drainage into the Connecticut Basin:
It is noted that whereas Wright shows the ice dam for Lake Winooski relatively far down the Winooski Basin, VCGI mapping indicates that the ice margin extended more substantially into the basin, essentially in close correspondence with the T4 margin.
2 Lake Mansfield 1:
As indicated, Wright suggests that Lake Winooski ended when a lower outlet was opened at Gillette Pond. Lake Mansfield 1 is said to be approximately 90 meters lower than Lake Winooski.
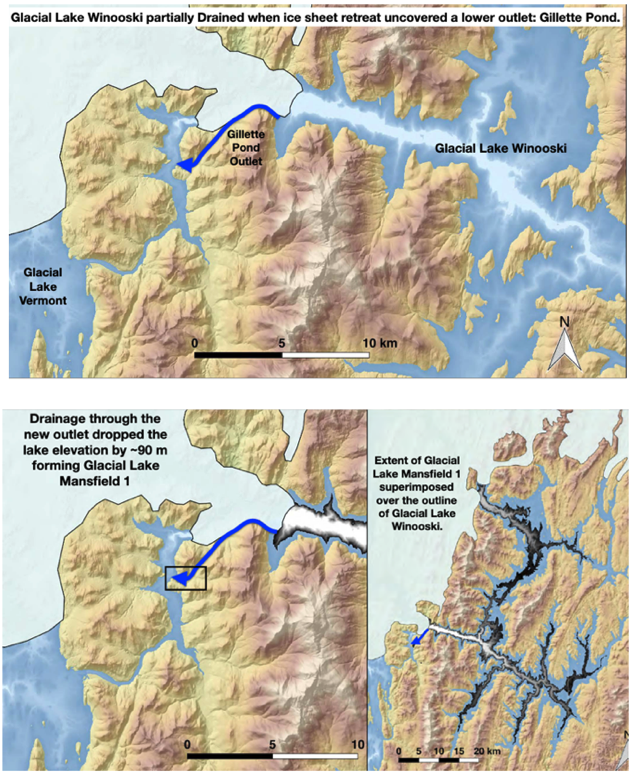
As can be seen Wright’s presentation above indicates that drainage from the Gillette Pond spillway was into a separate proglacial lake in the Huntington Basin, with an outlet across the divide with Hollow Brook ( which Wright apparently linked to the formation of the Coveville delta at South Hinesburg). Again, VCGI mapping gives a slightly different interpretation of the ice margin with the ice margin at Lake Gillett at T6 time. The position of the ice margin on the floor of the Winooski Basin at T6 time is not well marked and is uncertain.
3 Lake Mansfield 2
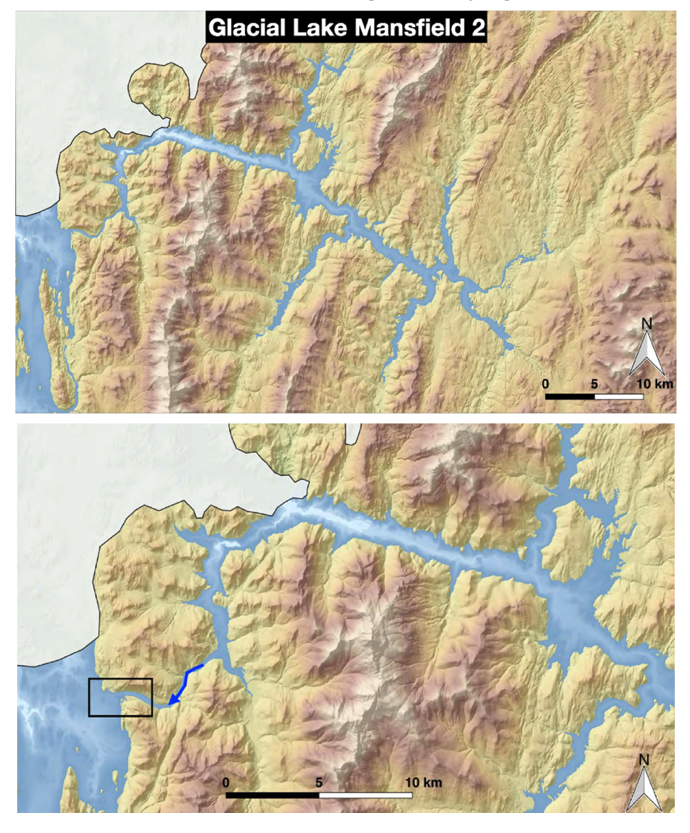
Wright suggests that Lake Mansfield 2 formed when recession of the ice margin opened the Huntington Basin, with drainage continuing across the divide with Hollow Brook to the South Hinesburg vicinity. Wright presented the following three slides for Lake Mansfield 2:
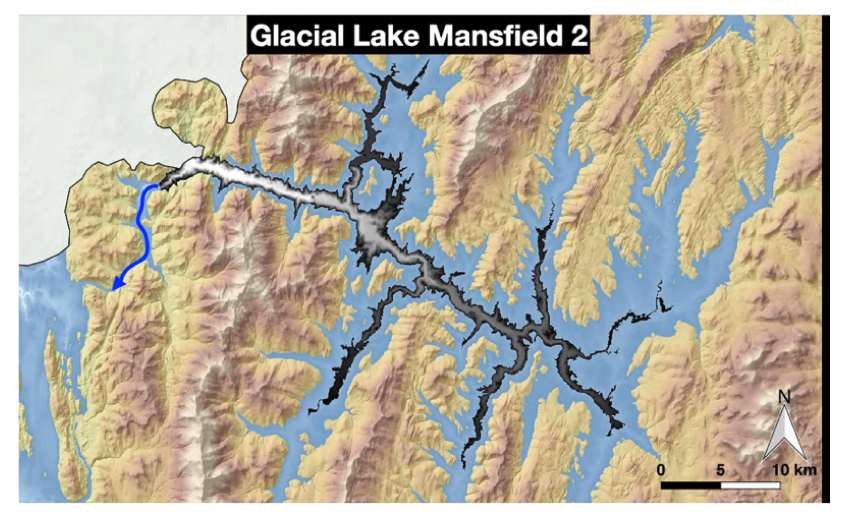
The blue arrow is assumed to be Wright’s spillway position for Lake Mansfield 2.
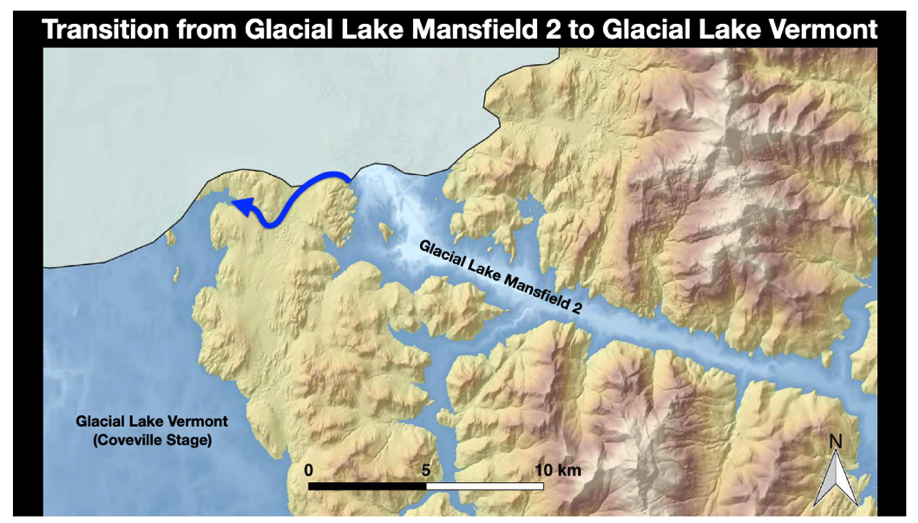
Wright then suggests a transition for the opening of the Winooski Basin, with Lake Mansfield 2 draining via the aforementioned spillway at Oak Hill, at Coveville time, as indicated by the blue arrow on the slide below:
Wright also presented LiDAR imagery showing his interpretation of opening of the Winooski Basin associated with the draining of Lake Mansfield 2.
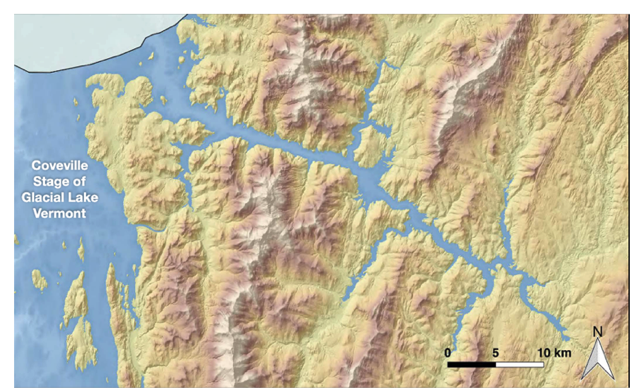
4 Coveville Lake Vermont
Finally, Wright presents his interpretation of the opening of the Winooski Basin and the invasion of Coveville waters into the Basin:
In general, I agree with Wright’s interpretation of proglacial water bodies and levels in the Winooski Basin and his recessional history. I am troubled by the fact that in my mapping in the 1970s I was unable identify a spillway at the divide between the Huntington Basin and the Hollow Brook Basin, especially considering that the amount of drainage presumably handled by this divide likely was substantial. VCGI evidence suggests drainage from an ice lobe in the Huntington Basin, down Hollow Brook basin, but more study is needed. And as discussed further below, I suspect that the Oak Hill spillway was the control for Lake Mansfield 2.
The following chart summarizes information pertaining to the elevations of various water bodies and associated features.
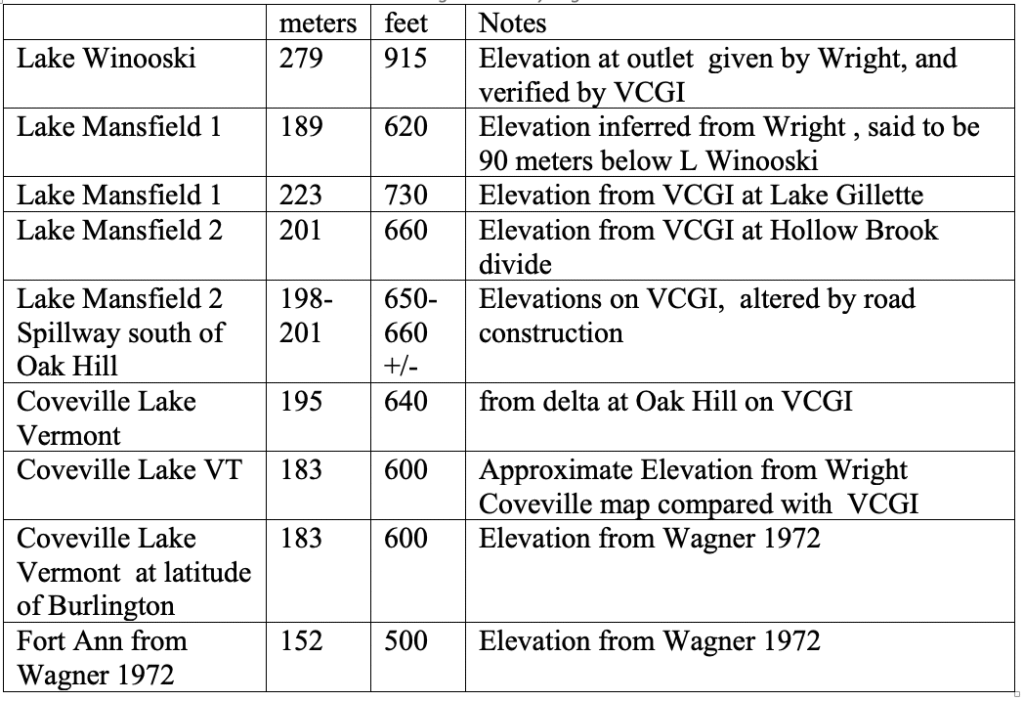
These are ”local” elevations , uncorrected for rebound. Wright’s suggestion that Lake Mansfield 1 was 90 meters below Lake Winooski is puzzling. As can be seen, the elevation of the spillway at Oak Hill is very similar to the divide between the Huntington and Hollow Brook Basins, which in my opinion suggests that the control of Lake Mansfield 2 may have been at the Oak Hill spillway. Also as can be seen, the elevation of the spillway at Oak Hill, which is here taken as a possible control for Lake Mansfield 2, is very close to the suggested elevation of the Coveville delta downgradient from the spillway. This is in fact born out by recent field mapping. In my opinion, the evidence in support of the Coveville level regionally in Vermont is not strong. As noted, both Chapman’s data and my data from my 1972 report show considerable scatter. Further, the distinction between Coveville versus local proglacial waste bodies is difficult. This raises the question in my mind as to the validity of the interpretation of Coveville waters in the Winooski Basin. Perhaps the most intriguing take-away is Wright’ s illustration, as shown above, for his suggested transition from Lake Mansfield 2 to Coveville. It is noted that his ice margin impinges on Yantz Hill in a manner consistent with the interpretation given here for the Ice Tongue Grooves and my revised interpretation of the “Wave Washed Till” deposit, also on Yantz Hill. As noted above, in my 1972 lake level report I correlated the Oak Hill spillway with a delta at Underhill by which I suggested a local proglacial Lake Jericho. It is possible that Lake Jericho actually corresponds with Lake Mansfield 2, which would mean that the ice margin at Lake Mansfield 2 time would entail a narrow ice impingement against Yantz Hill.
The following is an enlarged screenshot of my VCGI map for this area:
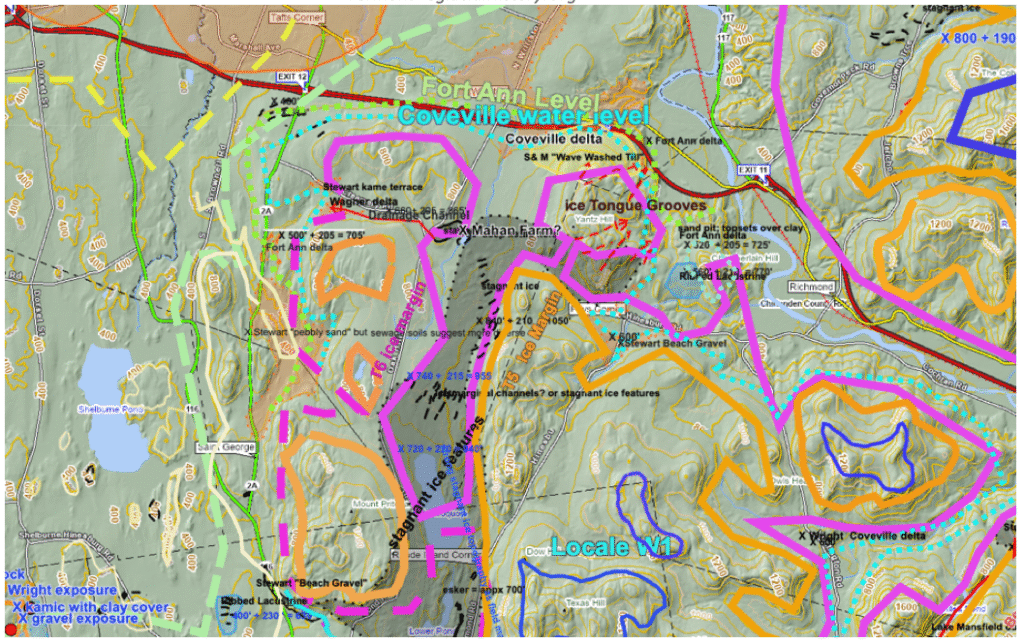
Again, the maroon line marks the T6 ice margin, the green line the T7 margin, and the yellow line the T8. It is noted that in making this interpretation I relied on Wright’s reporting of Coveville features in the Winooski Basin. On the northwest corner of Oak Hill, LiDAR imagery shows streaks which are possibly suggestive of Coveville and Fort Ann strandlines, and I have identified possible Coveville deltaic deposit at the mouth of the Winooski, but at this point I am not convinced that Coveville waters entered the Winooski Basin. It is noted that as can be seen on the above VCGI map, a small Ribbed Lacustrine deposit is located southeast of Yantz Hill. If correctly interpreted this deposit would suggest the presence of the ice margin in the Winooski Basin when Lake Vermont lowered from the Coveville to the Fort Ann level. In my opinion more study of this area and its deglacial history is warranted.
To get a better sense of the deglacial history of the mouth of the Winooski I revisited this area, using a basic VCGI topographic map, per the following, which is a crude tracing of features shown on above VCGI maps. The map shows the ice margin representing the top of the T6 margin at 920 feet. The top of the T6 ice margin at an elevation of about 920 feet, which corresponds with the Bedrock Groove at Lake Gillett, which is the control for Lake Mansfield 1, and as well the upper elevation of the major stagnant ice deposit near Williston. The Lidar markings on this deposit show progressive development or recession of ice margin features toward the northwest, as suggested by the maroon colored lines, leading to the spillway south of Oak Hill, which is here believed to represent the drainage control for Lake Mansfield 2. The elevation of this spillway is at an approximate elevation of 920 feet, which is slightly above the Coveville level.
The above map also shows progressive recession of the lobe in the Winooski Basin, as marked by maroon lines in T6 time. It is suggested that the Ice Tongue Grooves at Yantz Hill are consistent with this recession. The small Ribbed Lacustrine deposit southeast of Yantz Hill indicates that the recession of this lobe persisted into early Fort Ann time. In general, the lowering from the Coveville to the Fort Ann levels was associated with with the initiation of the second phase of calving in Fort Ann time further south in the La Platte and other re-entrant basins in the Middlebury Bench. The interpretation of deltaic deposits along Sucker Brook by Springston and DeSimone likewise fit with the close presence of the ice margin at the mouth of the Winooski Basin in Fort Ann time. Similarly, the evidence in the Essex area, immediately on the north side of the Basin mouth, includes esker deposits at the T7 level and time, which are graded to the Winooski Fort Ann delta.
b. Locale W2
This locale is included here primarily to illustrate the outlet area for Lake Winooski south of Williamstown inT4 time in the area of the divide between present day drainage basins of the Stevens Branch to the north and the Second Branch of the White River to the South.
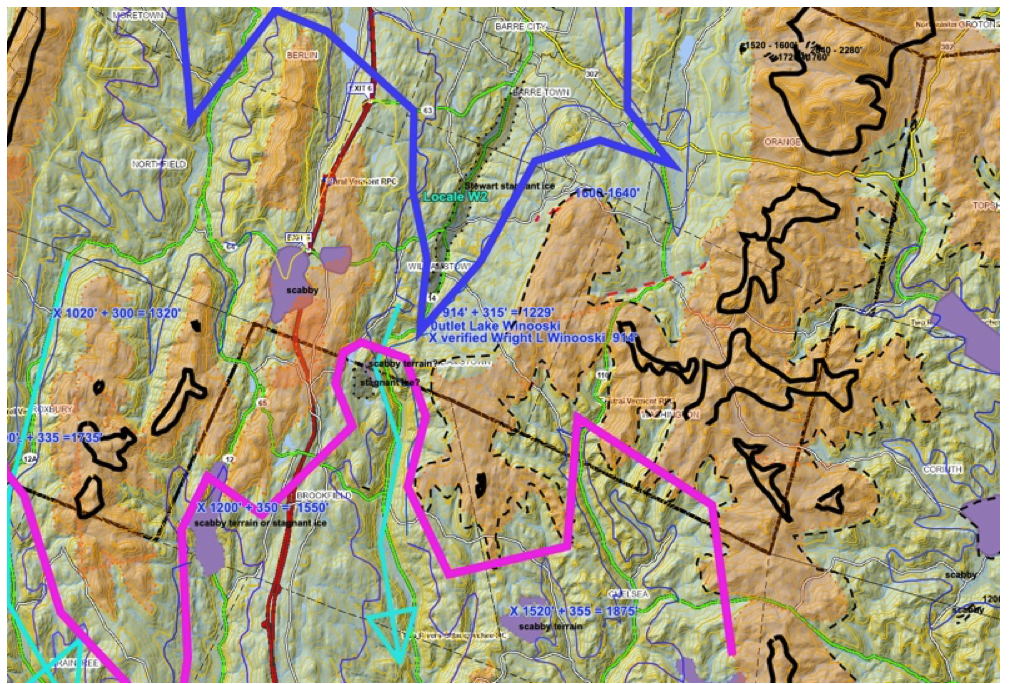
The location of the Lake Winooski outlet at the divide as identified by Wright and others is marked. As can be seen, stagnant ice deposits are mapped on both the north and south sides of the divide(marked by the purple line) at the T4 level. A patch of Scabby Terrain is shown to the west of the divide, but occurs more substantially further south along the T2 Ice margin, and further to the west along the perimeter of Lake Winooski. The State Surficial Geology map tab on VCGI indicates lacustrine silt-clay deposits in the lower Stevens Branch basin in the Barre area. These observations are consistent with and lend support to the interpretation given above that the Williamstown outlet for Lake Winooski was initially blocked, with incipient Lake Winooski opening as the ice margin retreated northward from the outlet in T4 time.
The heavy maroon colored line on the above screenshot represents the T2 ice margin(not the T6 margin which elsewhere is also marked by a maroon colored line) associated with the previously described Disconnection of ice mass in the Middle Connecticut Basin. Drainage from Lake Winooski was across the divide between the Winooski and Connecticut Basins. However, this drainage, including into the residual Disconnected ice mass area, has not been studied here.
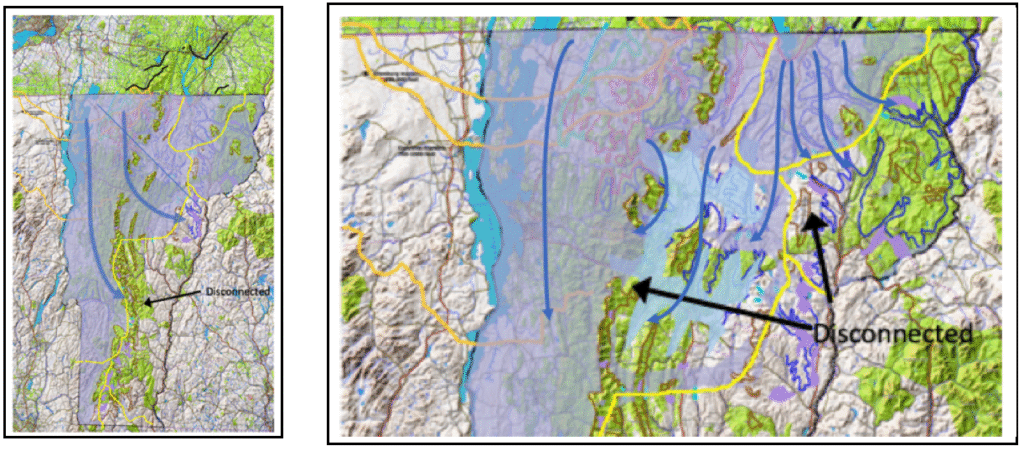
The mountainous terrain on the western margin of Lakes Winooski, beyond the above map area, is a region with relatively deep valleys draining the eastern flank of the Green Mountain front range. Scabby Terrain patches and stagnant ice deposits are mapped on VCGI in the floors of many of these valleys with drainage extending downslope to deltaic deposits associated with Lakes Winooski and/or Mansfield. These features are interpreted as “Disconnections” of ice masses in these deep valleys, a “Glacier Dynamic” feature whereby the penetration of standing water at the Lake Winooski level along the western perimeter of this water body resulted in separation and isolation of ice masses in these valleys. The T4 and T5 ice margins are discussed in more detail below in regard to the Winooski and Lamoille basins.
VCGI mapping provides evidence marking the receding ice margin of the ice mass in the Winooski Basin headwaters, including the Stevens Branch near the outlet prior to the development of Lake Winooski. The Winooski sublobe abutted against substantial upland terrain. For example, east of Marshfield.
The maps below illustrate the T4-T5 time, showing flowlines and associated Disconnections:
This VCGI map illustrates features in this Locale:
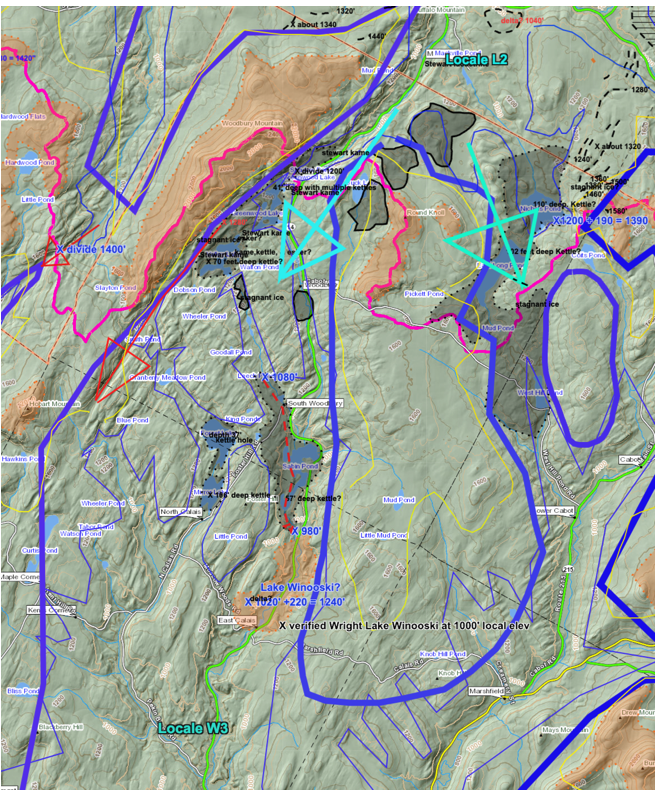
Physiographically, this Locale is located in the headwaters area of the Winooski Basin, near the divide with the Lamoille Basin, in a low area between Woodbury Mountain on the west and the more substantial Stannard Mountain on the east(off the map), the latter serving as a major upland between the Connecticut Basin and the Winooski Basin.
Demarcations on the map are as given previously. Again, the heavy blue line represents the approximate the T4 1200-1400 foot(366 – 427 m) ice margin. Stagnant ice deposits(grayed areas on map) at this margin suggest commingling of ice across the divide(marked by the purple line) between the Lamoille and Winooski Basins in this Locale. These deposits represent the ice margin for sub-lobes of the T4 Champlain Lobe, which extended into both the Winooski and Lamoille Basin. The T4 margin is closely associated with kettle hole ponds, many of which have substantial depths, as marked on the VCGI map. For example:
- Nichols Pond 110 feet
- East Long Pond 110 feet
- Greenwood Lake 41 feet
- Valley Lake 70 feet
- Sabin Pond 57 feet
These likely contained longer lasting ice block at T4 time. The occurrence of deep “kettle hole” type basins is typical in the Memphremagog Basin at the T4 to T6 levels, which is part of the evidence which prompted the concept of a “hybrid ice margin” and a Style referred to as “Everything, Everywhere, All at Once, and Continuing.” The T4 “hybrid” ice margin includes both active and stagnant margin features , with the ice masses remaining in deeper kettle holes as the active ice margin receded. Thus, the T4 – T6 ice margins were spatially and temporally overlapping.
The southernmost stagnant ice in this Locale is in the vicinity of Sabin Pond. The State surficial geology map shows a stagnant ice deposit in the Sabin Pond area, which is supported by the soil sewage tab. LiDAR imagery shows very strong kamic topography, including an esker. The elevations of the esker ridge crest indicate a southward gradient, from local elevations of about 1080 feet at the north end to 980 at the south end. These elevations, when adjusted, correspond with the T4 margin.
Immediately south of the Sabin Pond margin is a deltaic deposit(?), as indicated by the State Surficial map and topographic expression. LiDAR imagery indicates mining excavations at the head of the delta, which make geologic interpretation more difficult, but it appears that the esker feature represents a Drainage Line which grades into the deltaic deposit, which likely formed along the ice sheet margin, at an elevation corresponding with Wright’s Lake Winooski. Downgradient from this deltaic deposit to the south, the State Surficial Map shows the presence of lacustrine deposits. Thus, meltwater drainage from stagnant ice in the Sabin Pond area served to feed the Winooski level delta when the area to the south was ice free. This is a significant observation as it indicates that when Lake Winooski developed in T4 time stagnant ice remained along and just above its perimeter. This fits with the progressive recession of the ice sheet, water penetration along its margin, and the long-lasting presence of ice masses left behind, as part of the “hybrid” The T5 and T6 ice margins, as shown on the above map, is marked by a substantial stagnant ice deposit just south of Williston. LiDAR imagery of this deposit includes lobate forms suggestive of progressive ice margin retreat during T5 -T6 times and the formation of this deposit. These features clearly and impressively show the main Champlain lobe at this level extending southward in the Champlain Basin against the foothills, and as well suggest an ice tongue sub-lobe wrapping around the nose of the Winooski Basin mouth, extending eastward into the Winooski Basin. Field examination of this deposit in the vicinity immediately east of Lake Iroquois show impressive, stagnant ice topography with very pronounced semi-linear ridges. This area shows some of the best, strongest examples of stagnant ice deposit terrain found anywhere in Vermont.
To the northwest of Sabin Pond in the Lamoille/Winooski divide area, above the level of Lake Winooski, Greenwood Lake with a depth of 41 feet and Valley Lake with a depth of 70 feet are both kettle holes. The State surficial map shows an intimate association between stagnant ice deposits and lacustrine deposits in this area. The elevations of these features are near the upper range of the T4 ice margin.
Immediately west of Sabin Pond, downgradient from the Greenwood Lake and Valley Lake areas are Forest Lake and Mirror Lake, with depths of 76 feet and 106 feet respectively. The State map shows a stagnant ice deposit in the close association with Forest Lake and a “moraine” deposit with Mirror Lake. These likewise likely are kettles occupied by stagnant ice, at a lower level, close to the bottom of the bottom of the T4 margin. However, evidence of Lake Winooski deltaic or bottom set deposits are not present, perhaps indicating ice presence at Lake Winooski time.
In general, the evidence suggests commingling of ice across the Lamoille and Winooski divide at T4 time, in close association with Lake Winooski. The large turquoise colored arrows are intended to suggest more substantial ice supply from the north.