To move on to another important element about the ice margin database as mapped here, if one were to make a graphical plot of the number and size of ice margin features across their elevation ranges in Vermont, it would look something like the following schematic:
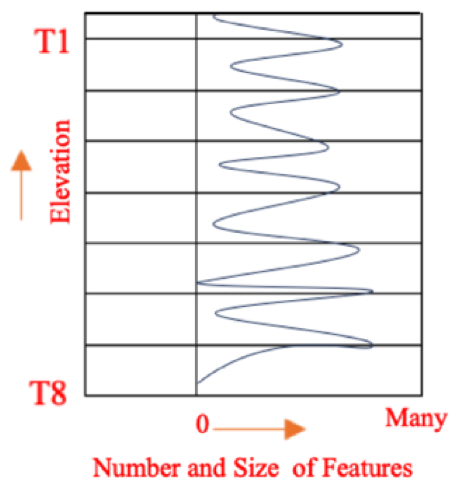
The ice margin evidence in many places in Vermont, again as discussed in detail in the historical section of this report, suggests that Vermont deglacial history is marked by numerous, closely, and relatively evenly spaced ice margin features across the elevation spectrum, but with larger and more numerous features associated with the T levels, commonly as valley fill deposits, as shown on the above graph.
The point of this schematic is that the record of deglacial history is not marked by abrupt changes of ice margin positions from one T level to the next, but instead the record is made up of a multiplicity of ice margins spanning the intervals between T levels, indicating that the ice sheet lowering was progressive and incremental, once again, much like “many rings on a slowly draining “Bath Tub”.” This progressive and incremental nature of ice margin recession applies both to intervals between T times and levels, and as well within T levels and times. Many of the T level ice margin features, as for example stagnant ice deposits and kame delta deposits, show evidence, especially on LiDAR imagery, of progressive, incremental recession within individual deposits themselves, and within basins, from the very small scale to Statewide.
Perhaps the T levels represent recession slow down pauses, or “stillstands.” The term “stillstands” tends to carry with it an implied climate variation, but that is not the intent here. Whereas these “stillstands” might represent climatic cooling, three points need to be made in this regard:
- The T levels may represent “stillstands” only in the sense that time is required for the formation of stagnant ice deposits and other ice margin features, more so for more substantial features.
- The ice marginal data are silent in regard to climate. It is possible that climate variations resulted in T levels, but this can not be, and is not, inferred or implied.
- In terms of Glacial Dynamics, other, alternative factors besides climate can result in “stillstands.”
To elaborate briefly on alternative causes of “stillstands,” a large and diverse literature related to ice margin stability exists, which suggests that “stillstands” may occur due to a variety of factors. The intent here is not to delve deeply into this subject, which is beyond the scope of this report. Intuitively, with regard to “stillstands,” in the context of a Bath Tub Model, it would seem that this might include, for example, controls or influences related to basin hypsometry, physiographic or geomorphic patterns of the landscape geomorphology as part of the regional Appalachian terrain evolution, and standing water levels. Literature reports make clear that hypsometry of ice sheets and their basins can be a significant factor in ice margin response of different glaciers and ice sheets to climate warming in modern times. The premise here is that the rate of the late Pleistocene retreat of the Laurentide ice sheet margin in a warming climate over a prolonged time varied depending on the ice volumes as the ice sheet receded. This has not been studied for Vermont, but nevertheless makes intuitive sense. It appears that a hypsometric analysis of Vermont physiography has never been done, and in any case doing so in the context of deglacial history would entail evaluating hypsometry of the basin physiography as it existed in late glacial times, before isostatic rebound. Further, in examining hypsometry the question arises as to the extent of the basin being considered, and whether or not just Vermont physiography should be considered, versus perhaps regional Laurentide ice sheet physiographic hypsometry.1This point is made more clearly and substantially in a report by Stokes, C.R., 2017, Deglaciation of the Laurentide Ice Sheet from the Last Glacial Maximum, Geographical Research Letters, V 43, pp 377-428.
Assuming that local, Vermont scale hypsometry may be a contributing factor, a qualitative sense of Vermont hypsometry can be judged visually from present-day physiographic maps. For example, one of the previously presented physiographic maps is again shown below:
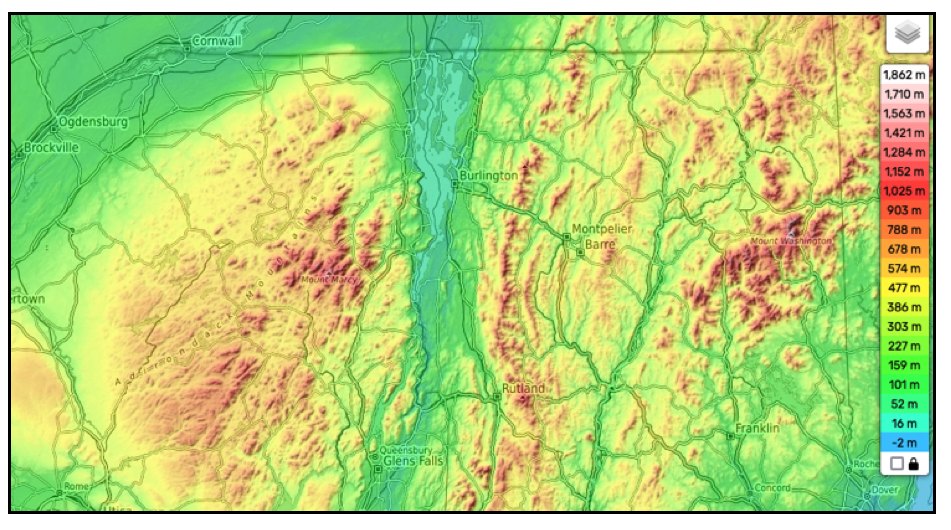
This suggests possibly important hypsometric levels with hypsometric “shelfs” at the bottom of the yellowish color at about 477- 386- meters(1500 -1266 feet), and below the darker green at 303-159 meters(993- 521 feet). These hypsometric “shelfs” represent levels where the volumes of the ice at and below the shelfs were smaller than above, and may help to explain the “stillstands” at approximately the T4 1200-1400 foot(366- 427 m) and T6 800 foot(244 m) levels, which were major T levels and times for major stillstands,
The point is not to suggest these observations are correct, but rather to illustrate the idea, or concept, that if deglaciation proceeded like a slowly draining “Bath Tub”, then “stillstands” marked by T levels related to hypsometry are not just possible, but expectable, and not surprising. Hypsometry would seem to be a plausible element in the rate of ice sheet lowering but it is difficult to establish and single out a cause and effect relationship.
As noted above, another factor may have to do with the long term geomorphic evolution of the landscape rooted in geologic history of the Appalachian Mountains. In terms of physiographic or geomorphic patterns, it is noted, as an example, that the elevations of divides between the Memphremagog Basin with the neighboring and Connecticut and Lamoille Basins tend to fall within the 1200-1400 foot(366- 427 m)range. These divides likely are geomorphically related to the long term, geological development of Vermont physiography. Further, these divide areas generally have relatively flat terrain where, when the ice thinned, in fact major stagnant ice deposits at valley heads associated with the T4 level can be found. The ice sheet was opportunistic, with for example stagnant ice features forming wherever ice thickness were insufficient to sustain active ice flow, and where sediment supply was available. Thus, it is possible that geomorphic physiographic patterns may be a contributing factor to the occurrence of “stillstands” at certain levels.
A third element likely affecting deglacial history and “stillstands” may be related to the levels of standing water bodies, as already suggested above. Ice margins are closely linked with water levels in the Champlain, Winooski, Lamoille, and Memphremagog Basins, as controlled by drainage outlets. It is believed that this relationship represents a Style and Glacial Dynamic that in fact largely affected if not controlled ice margin levels, with the ice margin chronology closely linked with the proglacial water level chronology, based on evidence discussed elsewhere in this report.
In sum, all of the preceding complications underscore the point that this report, which explores and develops the Bath Tub Model as a basis for deducing deglacial history based on ice margin features at different elevation levels, is regarded and intended as providing a conceptual foundation for further study, but not the final word on the matter of Vermont deglacial history.
Footnotes: