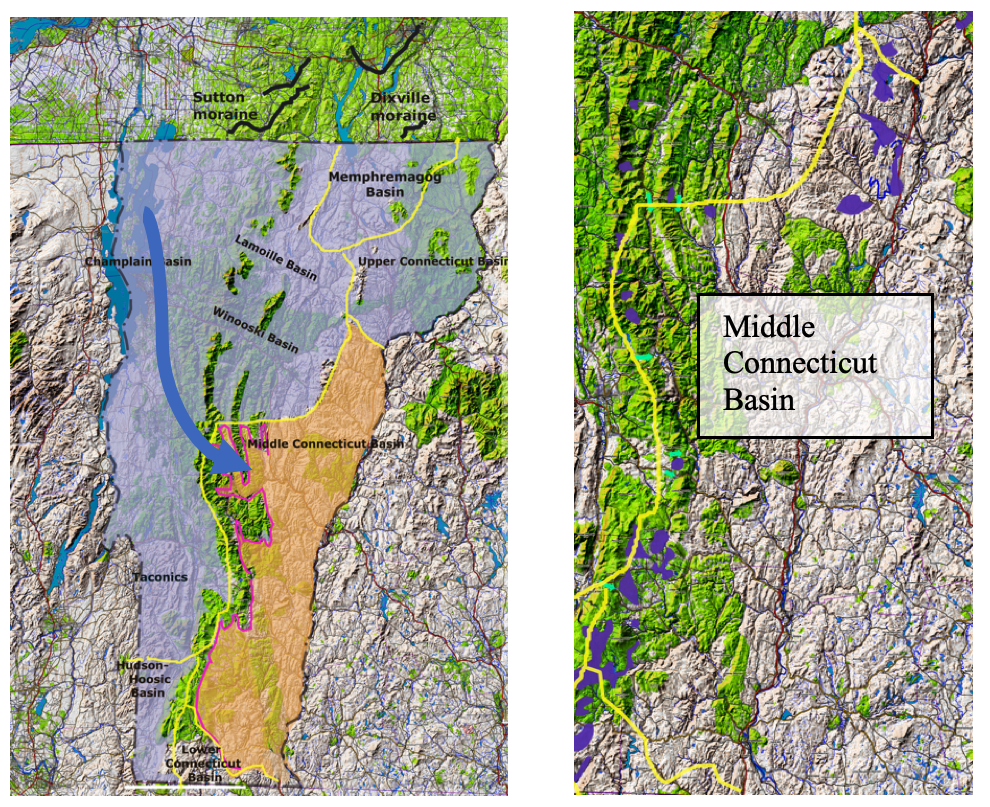
The Statewide map shown below left depicts the active ice extent at T2 time by the blue shading, the T2 margin as mapped on VCGI by the lavender colored line, as marked by Scabby Terrain, and the inferred en masse stagnated ice mass in the Middle Connecticut Basin by the orange shading. Again, the T2 margin corresponds with the upper limit of Scabby Terrain,which represents T2 time but not the T2 time ice margin associated with the ice sheet in the parent Champlain Basin at T2 time. The T2 ice sheet margin was slightly higher than the col elevations associated with the ice supply to the Middle Connecticut Basin.
The map below right shows Scabby Terrain, as purple colored shading, along the western and northern perimeters of the Middle Connecticut Basin, marking the upgradient Disconnection locations in T2 time. Stagnation of the ice mass occurred in T2 time when the ice sheet level lowered to elevations where and when ice supply from the main Champlain Basin, as depicted schematically by the blue arrow to the Middle Connecticut Basin, became interrupted. Whereas only one arrow is depicted, this pathway connection was via multiple low cols on the Green Mountain ridge line, as identified on VCGI, but not presentable here owing to scale limitations. The ice mass in the Middle Connecticut Basin was supplied by eastward ice flow from the Champlain Basin across cols and as well by southward ice flow pathways from the upper Winooski Basin via low terrain across divides. Some areas of Scabby Terrain patches mapped on VCGI are too small to be readily visible on this map.
The Scabby Terrain tract marking the T2 boundary as shown on this map is roughly 85 miles(140 km) long, at a range of elevations, but generally corresponding with an adjusted elevation of about 2600 feet(793 m). Prior to the Disconnection the ice mass in the Middle Connecticut Basin was sustained by flow across low col divides between Champlain Basin on the west, the Winooski Basin on the northwest, and the Memphremagog Basin on the north, with this last pathway continuing to sustain active ice in the Upper Connecticut Basin after the T2 Disconnection.
More detailed information pertaining to T2 level and time is given on the VCGI maps and the discussion for Locale MC1 in Appendix 2. The elevations of cols on the west side correspond closely with the T2 2600 foot(792 m) level, consistent with the explanation for Disconnection of ice in col pathways primarily from the Champlain Basin to the west caused by thinning of the ice sheet, resulting in en masse stagnation. In contrast, the cols on the north side tend to be lower, as for example at adjusted elevations of 1320 feet(402 m) at Roxbury and 1229 feet(375 m) south of Williamstown. Thus, it appears that ice from the Winooski lobe may have extended across these divides, at this time, but perhaps the more circuitous route for ice flow from the Champlain lobe resulted in insufficient flow to serve as the sustaining source of active ice in the Middle Connecticut Basin. Alternatively, it is possible that more detailed mapping may show that the T2 Disconnection actually involved multiple events.