At various locations scattered around Vermont are elongate linear or curvilinear features on the terrain as evident on VCGI maps, usually enhanced by LiDAR imagery. These generally are in shallow bedrock terrain with thin till ground moraine or lacustrine of marine silt-clays. Whereas these linears may simply reflect bedrock structural elements, such as foliation or schistosity, or in some cases be associated with strandlines, it is believed that some of these relate to ice margin positions. In some places these show deposits suggestive of more granular materials, as for example documented by the surficial geology and soil sewage favorability tabs on VCGI. These linears are marked on VCGI maps, as Ice Margin Lines.” Owing to the uncertainty regarding their origin and significance, these features were not used in the identification of ice margins.
“Ice Margin Lines” northwest of Snake Mountain are of particular note. The following are screen shots of the area, taken from VCGI, on the left with the LiDAR tab turned on but no markings, and on the right from the VCGI Project Sheet:
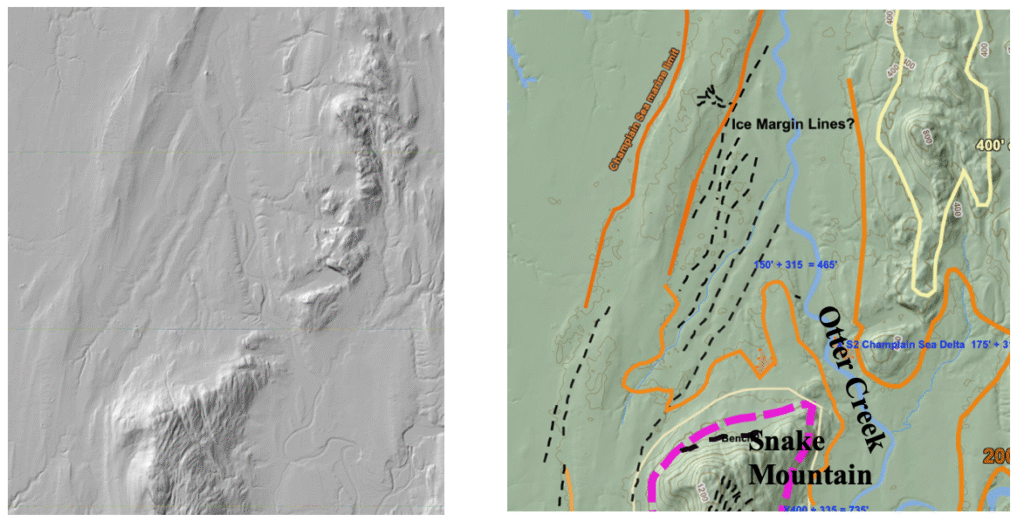
- The dashed black lines on the right image mark the Ice Margin Lines
- The maroon line = the T6 ice margin near the base of Snake Mountain. Again, early T6 time was associated with Coveville and late T6 time with Fort Ann, including the development of a calving margin in the Middlebury Bench
- The yellow lines = the 400 foot(122 m)elevation topographic contour, drawn to get a better sense of the physiography
- The orange lines = the approximate Champlain Sea marine limit.
It needs to be said that a closer examination of the area of these Ice Marginal Lines(?) on LiDAR indicates substantial information which is as yet not understood. For example, Lidar imagery suggests possible outwash fans(?) associated with the westernmost ridge, which is consistent with literature for present day ice sheets. Sewage soil favorability maps on VCGI show textural variations with a linear pattern of more granular soil on the west flank of the same westernmost ridge. Both of these observations might somehow be associated with a calving margin grounding line. However, other interpretations are possible. For example, the more granular soils might instead be associated with the Champlain Sea strandline and have nothing to do with an ice margin presence. Again, more study please!
The geologic origin of these features, as by now should be clear, is uncertain. Of course, they may be bedrock controled with no glacial significance However, neither the State Surficial Geology Map, nor the sewage favorability tab on VCGI, give any indication of shallow bedrock. It is not believed that they are physiographic expressions of bedrock structure, enhanced by glacial actions.. The State Surficial Geologic map shows that the surface soils in the area of the Ice margin Lines are bouldery silts and clays, which would be consistent with a calving mechanism. No information is given as to whether these are lacustrine or marine in origin, though the fact that they are below the marine limit, suggests the latter.(Interestingly, the State map makes a distinction between bouldery material on the floor of the Basin at the linears, as compared to apparently non-bouldery silt and clay on the floor of the Basin at a lower elevations; the meaning or significance of this, if any, is unknown. The soil sewerage favorability tab shows no variability of soil surface textures, suggesting that the linears likely are not postglacial erosion in origin related to bedrock structural fabric
The Ice Margin Lines at this location resemble and may be “Mega-scale Lineations”(MSGLs) or “Grounding Zone Wedges. ” As described above, MSGLs are elongate linear elements on generally flat topography associated with fast moving ice streams at calving ice margins, with the linears thought to be impressions caused by the weight of fast moving ice in ice streams on underlying soft sediment, typically soft, deformable till. Thus, MSGLs form at the grounding line of calving ice margins, oriented parallel with ice streaming.
MSGLs dimensions typically are :
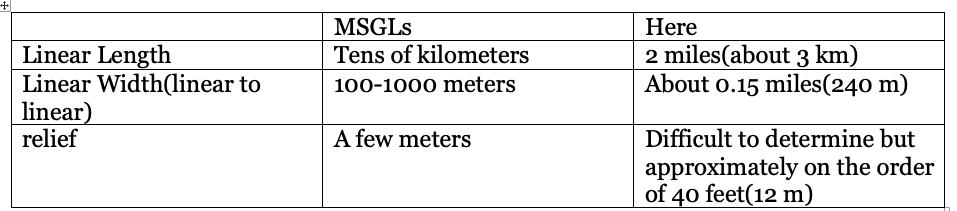
Thus, the Vermont features are shorter than typical MSGLs, comparable in width, but much deeper.
Grounding Zone Wedges are linear features associated with calving ice margins, formed either by the ploughing of underlying soils, usually till, into ridges, or by ice block imprinting in till or other sediment deposition at a stationary grounding line position. They range in size from a few meters thick to hundreds of meters, and be several kilometers long. They typically are asymmetrical in profile, being thicker at the grounding line with a steeper upgradient side. They form transverse to ice streaming.
If the linears are grounding line features they could have formed during an earlier, initial,first stage of calving in the deeper, western trough of the Basin floor, as described above, perhaps in early T6 and Coveville time. Alternatively, they could have formed at a much later time. Intriguingly, these linears are at elevations which is close to the marine limit for the Champlain Sea and the boundary of the bouldery silt and clay soils, again as shown on the State map, almost exactly coinciding with the marine limit of the Champlain Sea.
Interestingly, as noted above, Connally(1970),1 Connally, G. G.(1970), Surficial Geology of the Brandon-Ticonderoga 15 minute Quadrangles, Vermont; Vermont Geological Survey, Studies in Vermont Geology No 2, 32 p. who mapped the surficial geology of the Brandon and Ticonderoga Quadrangles, identified evidence which he interpreted as indicative of a “Bridport readvance.” His report presents photographs(Plates 5 and 6) which show till overlying material interpreted as till overlying material identified as outwash or lacustrine gravel, with shear planes in the till incorporating gravel from the lower layer. The exact location of the exposure is uncertain but is reportedly near West Bridport, which is a few miles southwest of the linears on the basin floor near Snake Mountain. Connally suggested this exposure may represent a glacial readvance. Connally also recognized the close association with the bouldery lacustrine or marine silt and clay soils as shown on the State Surficial map. In a subsequent report, Connally and Cadwell(2002) 2 Connally, G.G. and Cadwell, D.H., 2002, Glacial Lake Albany in the Champlain Valley, in the field guide for the 71st Annual Reunion, Northeastern Friends of the Pleistocene guidebook, pp B81 – B817. suggested that the readvance may be limited to(suggesting a correlation with) the bouldery fine grained materials on the basin floor. They indicate that the entire pit with the readvance evidence had been removed as of 2002, and thus this exposure is no longer accessible. Subsequent reports by others have raised doubt about the evidence for a readvance.
It is here suggested that linears and the Bridport “readvance” originally proposed by Connally may correspond with a calving ice margin oscillation or readvance in T8 time, similar to the evidence noted above in the Middlebury and Charlotte areas. The State surficial map does not associate the bouldery fine grained material on the basin floor in the area as marine or lacustrine, merely as “boulders in clay” but the elevation is below the marine limit.
The following screenshot from VCGI shows the area of interest:
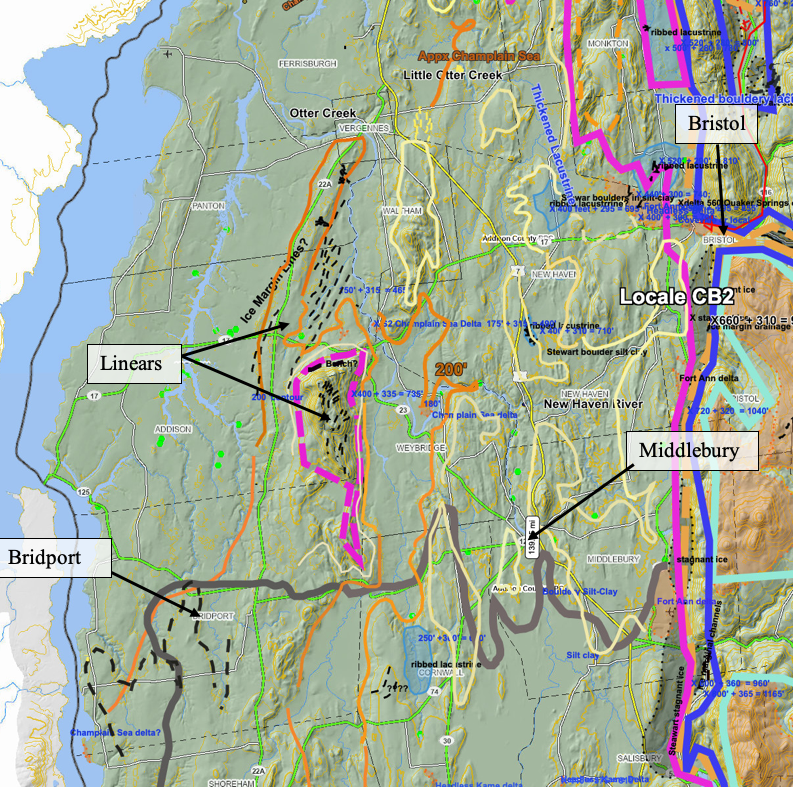
The location of the linear features near Snake Mountain and the Bridport area are identified. The orange colored line represents the marine limit, as drawn by Chapman and Wagner(1972) and as well by Springston and Wright. And the heavy dark gray line marks the boundary of the bouldery soils. As can be seen, the linears are basically at the marine limit near Snake Mountain, at the mouth of Otter Creek. As such, if these linears were formed as calving ice margin features at the calving line, as for example as grounding line wedges, they would support calving of the long convex lobe in T8 time as discussed above.
In essence, to conclude with regard to the origin of the Ice Marginal Lines northwest of Snake Mountain, at this point all possible options are on the table, including the possibility of “None of the Above.” More study of these features is needed, including not just the linears but as well the surrounding area, including the Champlain Sea deltaic deposits in the area in regard to any evidence that these may have formed in proximity to an ice margin.
As can be seen on the above map, Ice Margin Lines are also identified on the eastern flank of Snake Mountain. As discussed previously, these may represent portions of Ice Tongue Grooves similar to features identified at the mouths of the Winooski, Lamoille, and Missisquoi Basins.
Ice Marginal Lines are also identified on the floor of the Missisquoi Basin near the Quebec border:
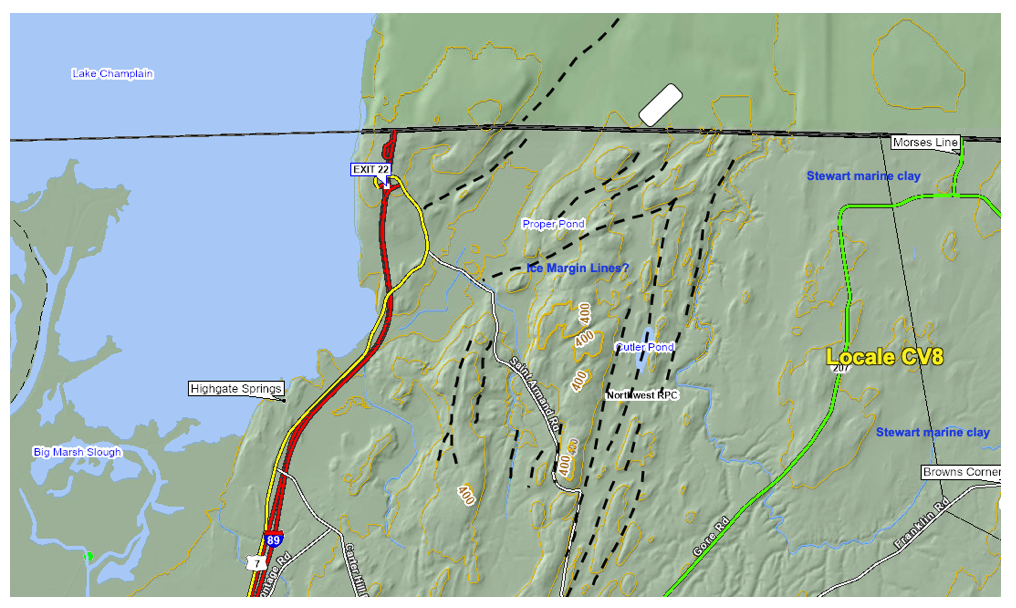
Again, the significance of these features, if any, requires further study. It is apparent that many of the ridges which are part of the Ice Margin Lines are marked by shallow bedrock, and the troughs between these ridges are floored by marine silt-clay, some but not all of which is identified as “bouldery.” However, scattered along the floors of these troughs in some places are gravel deposits which Stewart and MacClintock interpreted as “beach gravel.” VCGI LiDAR imagery shows no evidence which would be consistent with or suggestive of wave action along a strandline, but in some cases suggests these deposits form some type of constructional topography. This evidence raises the possibility that the gravel may represent ice marginal features, which would be quite significant. Also, in places the VCGI map with the sewage soil favorability tab turned on shows that some of these groove floors are marked by “Georgia Stony Loam” which is a USDA Soil Conservation Service soil type characterized by a dense mix of stones in a mix of sand, silt, and clay; this type of deposit likewise may be consistent with and indicative of a calving ice margin. Once again, further study is needed.
Not all “Ice Marginal Lines” identified in VCGI mapping are on the basin floor. For example, Ice Marginal Lines in the Castleton area, occur at a much higher level on the west flank of the Taconics, as shown on the following map:
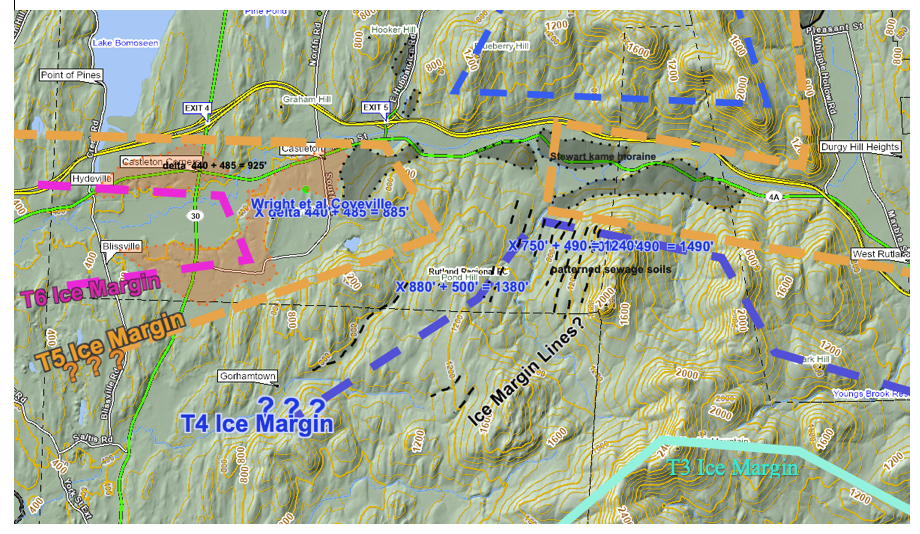
These occur between the T4 and T3 ice margins, which are correlated with the WMMS and its reported readvance. The VCGI sewage soil tab suggest more granular soils may be associated with these features.
In general, Ice Marginal Lines as mapped on VCGI are scattered broadly across Vermont, both singly and in clusters. Bedrock Grooves are prominent linear features, but these differ substantially from features mapped as Ice Marginal Lines, in that Bedrock Grooves are much more pronounced, clearly erosional features in bedrock terrain, with clearer evidence of formation by meltwater erosion along ice margins, commonly leading via Drainage Lines to downgradient kame deltas.