As previously discussed the Connecticut Basin physiography differs significantly from its neighbors, as shown on this regional map:
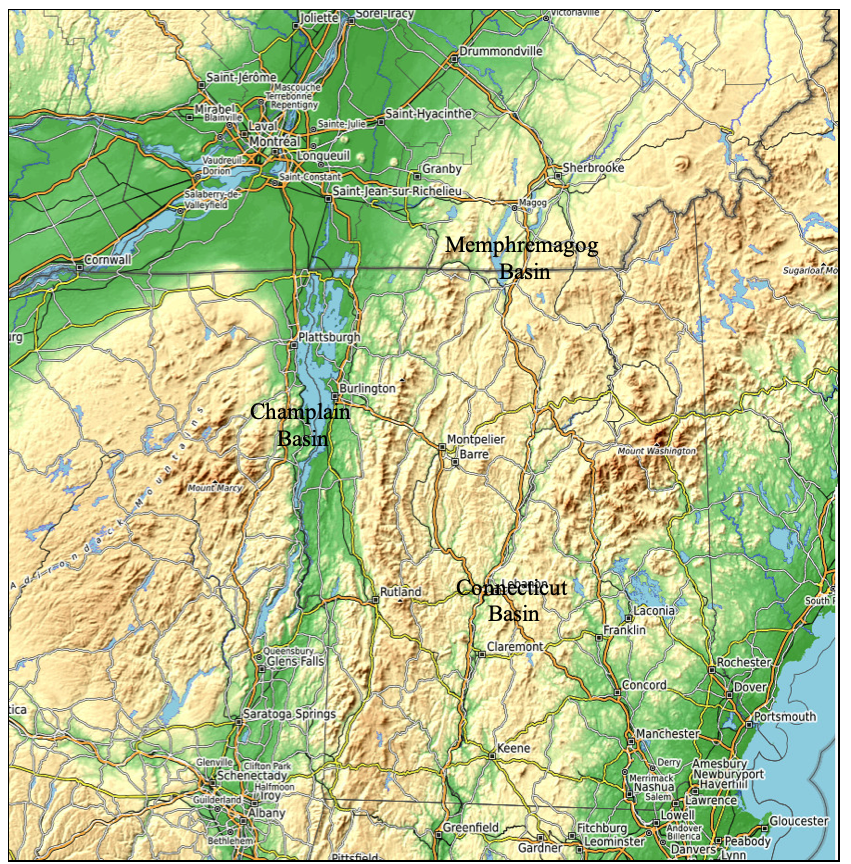
As is obvious, the Connecticut Basin is long and narrow, its floor relatively high, and in its northern portion near the Canadian border is constricted by the Appalachian Mountain uplands.
The regional physiography shown on this map gives a sense of the challenge facing the Laurentide ice sheet. Of course, at its peak, the ice sheet covered the entire region. How the ice sheet advanced into Vermont and made its way to its terminus in southern New England is a subject that predates the late deglacial history, which is the focus here. The question raised is how the ice sheet in this basin managed to sustain itself during deglaciation. The evidence provided above indicates that the Basin was “fed” by the Champlain lobe which ended by Disconnections in T1 and T2 times, and by the Memphremagog lobe (with some input from the Lamoille/Winooski lobes) which ended by a third Disconnection in T4 time. Obviously, active ice existed in the Connecticut Basin in Vermont in earlier times.
As discussed above, Larsen suggested that whereas the recession of the ice sheet in the Connecticut Basin in Massachusetts and southern Vermont(south of the Putney area) was by northward retreat of an active ice margin, the lack of a radial pattern of striations on the west side in Vermont north of Putney leds him to conclude that, “deglaciation of the Connecticut Valley north of Putney was by a stagnant tongue of ice.” Larsen’s observation may be correct in that Putney is located in southern Vermont, about 10 miles north of the Massachusetts Border. It may be that his observation indicates that active ice flow in the Connecticut lobe persisted, ending progressively in T1, T2, and T4 times. This is supported by the observation here which indicates that Ice Marginal Channels, which again are taken as indicators of active ice, are remarkably uncommon in much of the Connecticut Basin in Vermont.
The evidence for the boundaries of the ice mass associated with the third Disconnection with its lobe tip near Bradford is provided by VCGI mapping for this Locale.

This VCGI map 1 This map was created early in the VCGI mapping process and has since been modified. For example, more recent versions of this map depict the Scabby Terrain patches and tracts in a lavender color as opposed to the gray color on this above map. But otherwise, in general the above map suffices for the purpose of the overview of this Locale. shows the distribution of Scabby Terrain in the northern part of the basin associated with the Disconnection at T4 time The thin blue and yellow lines on this map trace the present day 1200 foot(366 m) and 1400 foot(427 m) contours, respectively, and the russet colored areas depict terrain above 1600 feet(488 m). The purpose of these markings is to give a sense of the physiography. Obviously, postglacial isostatic rebound altered elevations but in general the physiographic patterns shown on this map give a sense of the terrain as it existed in late glacial times. The physiography of the Connecticut Basin is narrowed by uplands in both Vermont and New Hampshire in the Bradford, Vermont area, delineating the “Upper Connecticut Basin.”
Ice Marginal Channels, which are uncommon south of Bradford in the Basin, occur at elevations from about the 2000 to 1200 foot(610- 366 m) levels, below which Scabby Terrain is prevalent above stagnant ice deposits which are extensive on the Basin floor. The gray colored areas on this map mark Scabby Terrain extending along the 1200-1400 foot(366 – 427 m) elevations. The elevation of the Basin floor in this area generally is on the order of about 800 feet(244 m) and below. Thus, the Scabby Terrain and stagnant ice deposits occur close to the Basin floor. Stagnant ice deposits are very widespread and common in the headwater areas of many tributary valleys, consistent with a 1200-1400 foot(366 – 427 m) hybrid ice margin, again generally at elevations slightly lower than the Scabby Terrain Tract. Eskers are especially numerous and common, seemingly occurring in every tributary valley in the upper reaches of the Basin. Stewart and MacClintock, 1969, p 91, make reference to an esker in the St Johnsbury area, stating: “The most impressive esker in Vermont is a ridge of gravel extending for twenty-four miles in the Passumpsic River valley.” This esker is located on the floor of the Basin.
The Ice Marginal Channels, Scabby Terrain, and stagnant ice deposits suggest an ice mass with a lobate shape in the Upper Connecticut Basin. The fact that Scabby Terrain and as well stagnant ice deposits occur close to the floor of this lobate shaped area suggest en masse stagnation, which is interpreted as resulting from the third Disconnection that occurred when the ice thicknesses in the divides areas between the Memphremagog Basin and the Connecticut Basin became insufficient to sustain active ice flow from the former into the latter.
The map below shows S & M’s map depicting their “moraines” in the Upper Connecticut Basin:
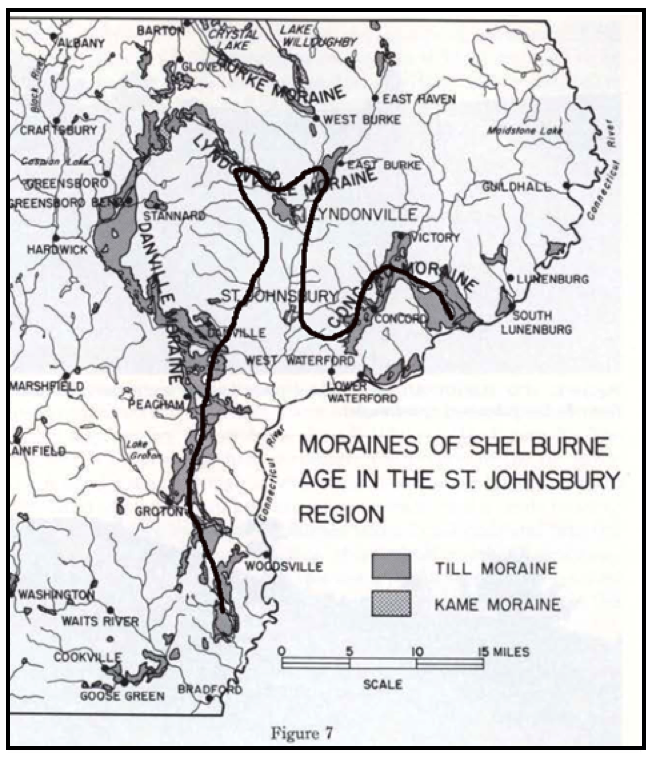
As already noted, S & M’s moraines generally correspond with the Scabby Terrain tract mapped on VCGI. The moraine on their Figure 7 is described(p 83) as, “an almost continuous till moraine trending north-south … fifty miles long … one half to four miles wide… with conspicuous morainic topography.” They add, “To the writers’ knowledge, this is one of the largest and best developed moraines in northern New England.” The black line is added to show the approximate location of the Scabby Terrain Tract which generally corresponds with S & M’s moraine, except for a portion extending into the Hardwick area where S & M identified ridges they interpreted as moraine but are marked as numerous Ice Marginal Channels giving the appearance of moraine. S & M’s moraine, which again corresponds with Scabby Terrain, extends southward to the Bradford vicinity, suggesting a narrowing ice lobe, reflecting the narrowing of the basin physiography.
This map shows the S & M moraine superimposed semi-transparently on a map of Lake Hitchcock, the latter taken from a map by Springston et al as previously identified.
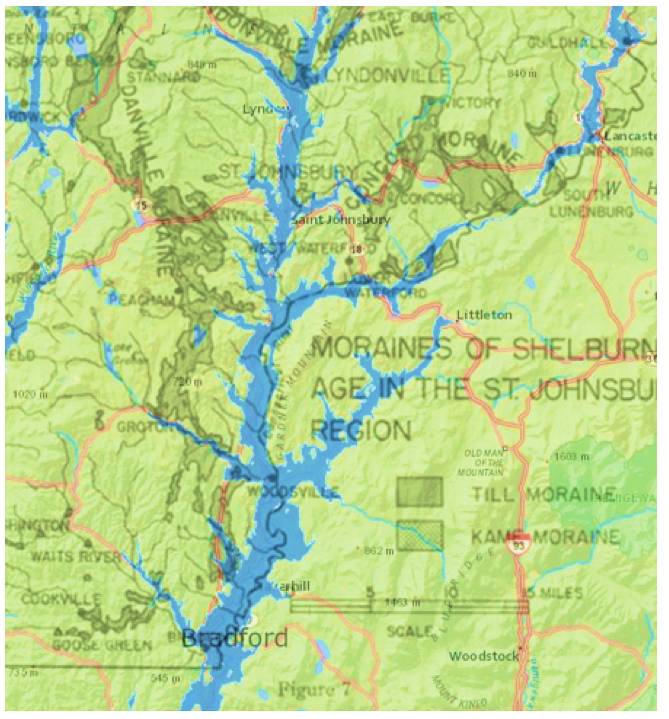
Lake Hitchcock was a substantial water body in the Basin. As has been long and well known, Lake Hitchcock expanded northward against the receding ice margin. S & M’s State surficial geology map shows substantial lacustrine silt-clay, and deltaic sand deposits along the valley floor south of Bradford related to Lake Hitchcock. Whereas VCGI mapping has not closely examined Lake Hitchcock features, as discussed further below in Appendix 3 in connection with the discussion of the White Mountain Morainic System, the evidence from S & M’s surficial map suggests an outwash plain extending downgradient from the Scabby Terrain ice margin in the Bradford vicinity, graded into Lake Hitchcock deltaic deposits. Together this evidence suggests the frontal ice margin of the T4 en masse stagnant lobe in the Connecticut Basin may have been in the Bradford area. It is believed that this en masse stagnation in the Upper Connecticut Basin took place following the readvance reportedly associated with the White Mountain Morainic System which is correlated with T4 time(see Appendix 3 below). In other words, according to this thinking, the T4 ice margin mapped extensively in Vermont, including its correlation with ice margin positions in New York, and the Dixville moraine in Quebec, and as well with the White Mountain Morainic System in the New Hampshire portion of the Upper Connecticut Basin, may represent an ice sheet readvance, which was then immediately followed by the en mass stagnation of this ice lobe in the Upper Connecticut Basin. By T5-T8 times, the ice margin had receded and was marked only on the Memphremagog and Champlain Basin. The duration of this stagnation is unknown, but as suggested elsewhere, the T4 margin was a hybrid type with stagnant ice remaining while the active ice margin receded to the T5 position. 2 I am aware that Larsen found and reported stratigraphic evidence in central Vermont suggestive of a readvance of the ice sheet, and that Springston and Wright likewise reported such evidence in the Winooski Basin near Middlesex and Montpelier. In as much as stratigraphic information is not provided by VCGI mapping I have not examined this evidence. It is here believed that the readvance discussed correlates with the White Mountain Morainic System. If this is the case the correlative ice margin connection between the features in the Connecticut Basin with the central Vermont would be along a circuitous pattern as shown by the T4 ice margin, as shown by the Statewide maps presented in this report.
Of course, this explanation given here does not imply that the entire ice lobe in the Connecticut Basin, including its extension southward beyond Vermont was part of the en mass stagnation. Beginning from the time of the maximum glaciation the deglacial recession of the ice mass that occupied this basin likely was robustly supported by nourishment from the accumulation area of the parent Laurentide ice sheet. The question as to the extent of en masse stagnation beyond Vermont to the south is not dealt with here.
Footnotes: